Contents lists available at ScienceDirect journal homepage: www.elsevier.com/locate/scitotenv
Jörg Gartler a,b, Brett Robinson a,⁎, Karen Burton a, Lynne Clucas a
a Soil and Physical Sciences, P O Box 84, Lincoln University, Lincoln 7647, New Zealand b University of Applied Sciences Wiener Neustadt, Austria
H I G H L I G H T S
► Biosolids mixed with biochar increased the soluble Zn in soil.
► 生物固体(污泥)与生物炭混合施用提高了土壤中可溶性Zn含量。
► The biosolids/biochar mixture results in significantly increased Zn uptake by some crops species/varieties.
► 生物固体/生物炭混合物显著提高了部分作物种类/品种对Zn的吸收。
► Chenopods showed the greatest Zn uptake, followed by leafy vegetables.
► 藜科植物对Zn的吸收量最高,叶菜类蔬菜次之。
► Cadmium, Cu and Pb were below guideline levels in all samples, except the leaves of spinach and beetroot.
► 除菠菜和甜菜根叶片外,所有样品中的镉、Cu和Pb含量均低于指导限值。
a r t i c l e i n f o
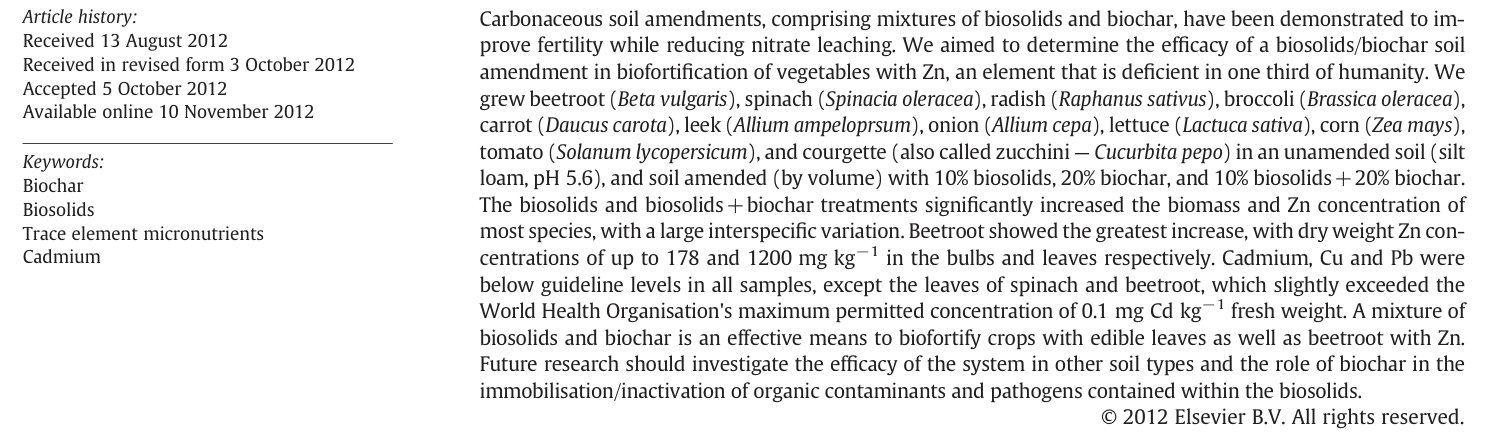
a b s t r a c t
1Introduction引言
Zinc (Zn) is a trace element micronutrient for both plants and animals. One third of humanity is deficient in Zn, with various deficiency rates in various countries ranging from 4 to 73% (Hotz and Brown, 2004). In the United States, 10% of the population consumes less than half the recommended dietary allowance for Zn and is at increased risk for Zn deficiency (Ho, 2004). Zinc biofortification aims to increase the concentration of this essential micronutrient in crop plants, pre-harvest, by agronomic means or genetic modification (Cakmak, 2008).
锌(Zn)是植物和动物共需的微量元素营养素。全球三分之一的人口缺Zn,各国缺乏率从4%到73%不等(Hotz and Brown, 2004)。在美国,10%的人口Zn摄入量不足推荐膳食供给量的一半,缺Zn风险较高(Ho, 2004)。锌生物强化旨在通过农艺措施或遗传改良,在收获前提高作物中这一必需微量营养素的浓度(Cakmak, 2008)。
Typically, Zn is the trace element that is present in the highest concentrations in biosolids (Smith, 2009). Many studies have shown that the application of sewage sludge (biosolids) to soil increases the Zn concentration in crop plants (Balik et al., 1998; Dudas and Pawluk, 1975; Kemp and Hemkes, 1976; Weggler-Beaton et al., 2003; Wells and Whitton, 1979). Such biofortification using biosolids has an additional benefit of reusing a waste material that has a global production in excess of 10 Mt yr−1 (Bradley, 2008). However, in addition to macro and micro-nutrients, biosolids also contain heavy metals, endocrine disrupting compounds, pesticides, herbicides, surfactants, and pathogenic helminths, bacteria, viruses and fungi (Krogmann et al., 1999; Singh and Agrawal, 2008). Stricter regulations and improved treatment technologies have resulted in reduced pathogen burdens and decreased concentrations of heavy metals and organic contaminants (Chaney, 1990), leaving N loading as the rate limiting factor of the addition of high-quality biosolids in some countries (Gibbs, 2003). The rates of biosolids addition used for biofortification in the aforementioned studies ranged from 600 to >3000 kg N ha−1. These rates are well above the maximum permissible N-loading rates for agricultural soils, which are typically 200–400 kg N ha−1 (Gibbs, 2003).
通常,Zn是生物固体(污泥)中浓度最高的微量元素(Smith, 2009)。大量研究表明,向土壤施用污水污泥(生物固体)可提高作物中的Zn浓度(Balik et al., 1998; Dudas and Pawluk, 1975; Kemp and Hemkes, 1976; Weggler-Beaton et al., 2003; Wells and Whitton, 1979)。利用生物固体进行生物强化还具有资源化利用废弃物的附加效益,全球生物固体年产量超过10 Mt yr−1(Bradley, 2008)。然而,除大量和微量营养元素外,生物固体还含有重金属、内分泌干扰物、杀虫剂、除草剂、表面活性剂以及致病性蠕虫、细菌、病毒和真菌(Krogmann et al., 1999; Singh and Agrawal, 2008)。更严格的法规和改进的处理技术降低了病原体负荷以及重金属和有机污染物的浓度(Chaney, 1990),使得在一些国家氮负荷成为限制优质生物固体施用量的因素(Gibbs, 2003)。上述研究中用于生物强化的生物固体施用量为600至>3000 kg N ha−1,远高于农业土壤允许的最大氮负荷量(通常为200–400 kg N ha−1)(Gibbs, 2003)。
⁎ Corresponding author. Tel.: +64 3 325 3838x8471.
⁎ 通讯作者。电话:+64 3 325 3838x8471。
E-mail address: brett.robinson@lincoln.ac.nz (B. Robinson).
0048-9697/$ – see front matter © 2012 Elsevier B.V. All rights reserved. http://dx.doi.org/10.1016/j.scitotenv.2012.10.027
0048-9697/$ – see front matter © 2012 Elsevier B.V. 版权所有。http://dx.doi.org/10.1016/j.scitotenv.2012.10.027
Knowles et al. (2011) demonstrated that biochar, a form of charcoal that is added to soil, effectively mitigates nitrate leaching from biosolids. Biochars have been shown to reduce the mobility and other plant uptake of some contaminants found in biosolids, such as Cu (Karami et al., 2011), Cr (Dong et al., 2011), Pb (Cao et al., 2011), Cd (Beesley and Marmiroli, 2011), as well as pesticides such as atrazine (Cao et al., 2011), and other organic contaminants such as polycyclic aromatic hydrocarbons (Gomez-Eyles et al., 2011). A potential drawback of using a biochar/biosolids mixture for Zn biofortification is that biochar has also been shown to reduce Zn bioavailability to plants (Beesley and Marmiroli, 2011).
Knowles et al.(2011)证明,生物炭(一种施入土壤的木炭)能有效减轻生物固体引起的硝酸盐淋溶。研究表明,生物炭可降低生物固体中某些污染物的迁移性及植物吸收,如Cu(Karami et al., 2011)、Cr(Dong et al., 2011)、Pb(Cao et al., 2011)、Cd(Beesley and Marmiroli, 2011),以及阿特拉津等农药(Cao et al., 2011)和多环芳烃等其他有机污染物(Gomez-Eyles et al., 2011)。利用生物炭/生物固体混合物进行Zn生物强化的一个潜在缺点是,生物炭也被证明会降低Zn对植物的生物有效性(Beesley and Marmiroli, 2011)。
The sorptive properties of biochars are variable and are strongly influenced by the source material and pyrolysis temperature (Uchimiya et al., 2011a, 2011b). A review of the mechanisms of contaminant immobilisation by biochar is provided by Beesley et al. (in press). Ideally, the biochar should be produced from a widespread and low-cost biological residue. Such a source material is waste from the Monterey pine (Pinus radiata D. Don) timber industry. This tree has been introduced in vast areas of New Zealand (where it is the most common tree), Australia, Chile, South Western Europe and South Africa (Earle, 2010).
生物炭的吸附特性差异较大,并受原料和热解温度的强烈影响(Uchimiya et al., 2011a, 2011b)。Beesley et al.(in press)综述了生物炭固定污染物的机理。理想情况下,生物炭应由分布广泛且成本低廉的生物残余物制备。辐射松(Pinus radiata D. Don)木材产业的废弃物即为此类原料。该树种已被大面积引种于新西兰(为当地最常见的树种)、澳大利亚、智利、欧洲西南部和南非(Earle, 2010)。
We aimed to elucidate whether a biochar/biosolids mixture would be as effective for Zn biofortification as biosolids alone. Specifically, we sought to determine the growth and elemental composition of Beta vulgaris (L.), Spinacia oleracea (L.), Raphanus sativus (L.), Brassica oleracea (L.), Daucus carota (L.), Allium ampeloprsum (L. [J. Gay]), Allium cepa (L.), Lactuca sativa (L.), Zea mays (L.), Solanum lycopersicum (L.), and Cucurbita pepo (L.) in soils amended with biosolids, biochar, a biosolids/biochar mixture, and a control soil.
本研究旨在阐明生物炭/生物固体混合物在Zn生物强化方面是否与单施生物固体同样有效。具体而言,我们测定了Beta vulgaris (L.)、Spinacia oleracea (L.)、Raphanus sativus (L.)、Brassica oleracea (L.)、Daucus carota (L.)、Allium ampeloprsum (L. [J. Gay])、Allium cepa (L.)、Lactuca sativa (L.)、Zea mays (L.)、Solanum lycopersicum (L.)和Cucurbita pepo (L.)在施用生物固体、生物炭、生物固体/生物炭混合物的土壤以及对照土壤中的生长状况和元素组成。
2Materials and methods材料与方法
Biosolids were obtained from the Kaikoura regional treatment works, New Zealand. Some 160 kg of biosolids were homogenised using a concrete mixer and passed through a 20 mm sieve. The moisture content of the fresh biosolids was 53% (Knowles et al., 2011). The biochar was manufactured from P. radiata D. Don chips that were pyrolised in the absence of oxygen at a temperature of 350 °C. The biochar was crushed to give particles with a maximum diameter of 10 mm (Clough et al., 2010; Taghizadeh-Toosi et al., 2011). The chemical properties of the biosolids and biochar used in this experiment are given in Table 1. The topsoil, obtained from Parkhouse Garden Supplies Limited, Christchurch, New Zealand, was a silt loam. Table 2 gives the soil properties.
生物固体取自新西兰Kaikoura地区污水处理厂。约160 kg生物固体经混凝土搅拌机均质化后过20 mm筛。新鲜生物固体的含水率为53%(Knowles et al., 2011)。生物炭以P. radiata D. Don木片为原料,在无氧条件下于350 °C热解制得,并经粉碎使颗粒最大直径为10 mm(Clough et al., 2010; Taghizadeh-Toosi et al., 2011)。本试验所用生物固体和生物炭的化学性质见表1。表层土取自新西兰基督城Parkhouse Garden Supplies Limited,为粉砂壤土,其性质见表2。
Soil chemical properties of the biosolids and biochar. Values in brackets represent the standard error of the mean (n=3 unless otherwise indicated). Adapted from (Knowles et al., 2011).
生物固体和生物炭的化学性质。括号内数值为平均值的标准误(除另有说明外,n=3)。引自(Knowles et al., 2011)。
| Biosolids生物固体 | Biochar生物炭 | |
|---|---|---|
| pH | 4.1 | 7.8 |
| CEC (cmol(+)kg−1) | n.d. | 8.0ab |
| C (%) | 28.0 (0.2) | 70.6a |
| N (%) | 2.7 (0.03) | 0.2a |
| P (mg kg−1) | 4683 (2) | 412 (2) |
| S (mg kg−1) | 6972 (43) | 288 (12) |
| Ca (mg kg−1) | 9818 (176) | 7758 (160) |
| Mg (mg kg−1) | 2204 (17) | 605 (11) |
| K (mg kg−1) | 4330 (67) | 1713 (17) |
| Na (mg kg−1) | 428 (3) | 1000 (29) |
| Cd (mg kg−1) | 2.8 (0.0) | 0.1 (0.01) |
| Cr (mg kg−1) | 32 (1.4) | 2.8 (0.6) |
| Cu (mg kg−1) | 561(33) | 14 (5) |
| Pb (mg kg−1) | 96 (3) | 1.0 (0.2) |
| Zn (mg kg)−1 | 878 (13) | 16 (1.3) |
n.d. = “not determined”. a Single analysis on homogenised material. b Taghizadeh-Toosi et al. (2011).
n.d. = “未测定”。a 对均质化样品进行的单次分析。b Taghizadeh-Toosi et al.(2011)。
A control and three soil treatments were prepared using a concrete mixer. Biosolids were mixed into the soil at a rate of 10% by volume (T1). Biochar was mixed into the soil at a rate of 20% by volume (T3) and a treatment was prepared (T2) incorporating 10% biosolids and 20% biochar by volume. On a weight basis, the rates of biosolids and biochar addition were 2% and 2.5% respectively.
使用混凝土搅拌机制备1个对照和3个土壤处理。生物固体按体积比10%混入土壤(T1);生物炭按体积比20%混入土壤(T3);另设一个处理(T2),按体积比混入10%生物固体和20%生物炭。按质量计,生物固体和生物炭的添加比例分别为2%和2.5%。
For each soil type, 55 two-and-a-half litre plastic pots (diameter 16 cm, height 15.5 cm) were filled to a depth of 13 cm. The pots were placed in a greenhouse at Lincoln University, New Zealand and left for 2 weeks before planting. In each soil treatment, there were five replicates of 11 plant treatments, namely beetroot (B. vulgaris subsp. vulgaris L. var ‘Baby Beet’), spinach (S. oleracea L. var ‘New Zealand’), radish (R. sativus L. var ‘Champion’), broccoli (B. oleracea L. var ‘Shogun’), carrot (D. carota L. var ‘Egmont Supreme’), leek (A. ampeloprsum var. Porrum (L.) J. Gay), onion (A. cepa var. Cepa L. var ‘Pukekohe Long Keeper’), lettuce (L. sativa L. var ‘Green Oak’), corn (Z. mays L. var. rugosa), tomato (S. lycopersicum L. var ‘Russian Red’), and courgette (also called zucchini — C. pepo L. var ‘Blackjack’). All plant material was sourced from Oderings Nursery, 20 West Coast Road, Yaldhurst, Christchurch, New Zealand. Beetroot, carrot, lettuce, radish, spinach, corn and courgette were grown from seed, whereas broccoli, onion, leek and tomato were grown from seedlings. Three seeds were planted per pot. After emergence, seedlings were thinned out to one per pot. Pots were arranged in a randomised block design. Planting occurred in late January 2010. In late March 2010, the corn was transplanted into 7.5 l pots (diameter 26 cm, height 20 cm). Pots were watered daily to field capacity. Any excess water drained via holes in the bottom of the pots. All plants were periodically fertilised with Ruakura solution (Table S1, Supplementary data). Because of the appearance of whitefly infection of the broccoli, these plants were sprayed with Key Pyrethrum (14 g l−1 pyrethrum and 56.5 g l−1 piperonyl butoxide in the form of an emulsifiable concentrate diluted to 5 ml l−1) on March 10th and 29th and on May 3rd.
每种土壤类型各装填55个2.5 L塑料盆(直径16 cm,高15.5 cm),装土深度13 cm。花盆置于新西兰Lincoln University温室中,静置2周后种植。每个土壤处理设11个植物处理,各5次重复,分别为甜菜根(B. vulgaris subsp. vulgaris L. var ‘Baby Beet’)、菠菜(S. oleracea L. var ‘New Zealand’)、萝卜(R. sativus L. var ‘Champion’)、西兰花(B. oleracea L. var ‘Shogun’)、胡萝卜(D. carota L. var ‘Egmont Supreme’)、韭葱(A. ampeloprsum var. Porrum (L.) J. Gay)、洋葱(A. cepa var. Cepa L. var ‘Pukekohe Long Keeper’)、生菜(L. sativa L. var ‘Green Oak’)、玉米(Z. mays L. var. rugosa)、番茄(S. lycopersicum L. var ‘Russian Red’)和西葫芦(又称zucchini——C. pepo L. var ‘Blackjack’)。所有植物材料均购自新西兰基督城Yaldhurst West Coast Road 20号Oderings Nursery。甜菜根、胡萝卜、生菜、萝卜、菠菜、玉米和西葫芦由种子播种,西兰花、洋葱、韭葱和番茄则由幼苗移栽。每盆播种3粒种子,出苗后间苗至每盆1株。花盆按随机区组设计排列。种植于2010年1月下旬进行。2010年3月下旬,将玉米移栽至7.5 L花盆(直径26 cm,高20 cm)中。每天浇水至田间持水量,多余水分经盆底孔排出。所有植物定期施用Ruakura营养液(表S1,补充数据)。由于西兰花出现粉虱侵染,于3月10日、29日和5月3日对其喷施Key Pyrethrum(14 g l−1除虫菊酯和56.5 g l−1增效醚,为乳油剂型,稀释至5 ml l−1)。
Plants were harvested upon maturation of the edible portions, which was between the 19th of March (radish) and 1st July (onion). The edible portions of the plants were excised. The root vegetables (beetroot, radish, and carrot) were peeled. The outer layer of the onions was removed. The husks were removed from the corn. Tomatoes were not peeled. The fresh weight of the edible portions was determined. Both the edible portions and the residual material was washed thoroughly with deionised water and placed in a drying cabinet at 105 °C until a constant weight was obtained. Samples were ground and stored in an airtight container until chemical analyses.
植物在可食部分成熟时收获,收获时间介于3月19日(萝卜)至7月1日(洋葱)之间。切取植物可食部分。根类蔬菜(甜菜根、萝卜和胡萝卜)去皮,洋葱去除外层,玉米去除苞叶,番茄不去皮。测定可食部分鲜重。可食部分和剩余材料均用去离子水彻底清洗,置于105 °C烘箱中烘至恒重。样品经粉碎后储存于密封容器中,待化学分析。
Following incubation in the greenhouse, six soil samples from each treatment as well as the control were dried, and sieved to b2 mm using a Nylon sieve. Soil C and N concentrations were measured using an Elementar Vario MAX CN analyser. Soil pH was determined using 10 g of soil and 25 ml of deionised water. The mixture was shaken, left overnight, and shaken again before determination with a pH meter (Mettler Toledo Seven Easy).
在温室培养后,从各处理及对照中各取6个土壤样品,风干后用尼龙筛过<2 mm筛。土壤C和N浓度采用Elementar Vario MAX CN分析仪测定。土壤pH按10 g土壤加25 ml去离子水测定:混合液振荡后静置过夜,再次振荡后用pH计(Mettler Toledo Seven Easy)测定。
An estimation of the element solubility was made using a 0.05 M Ca(NO3)2 extraction after Black et al. (2012), who demonstrated this was the most effective procedure for determining metal bioavailability in biosolids-amended soil. Five grams of soil were weighed into 50 ml centrifuge tubes. Thirty millilitres of extractant were added and a suspension formed using a vortex mixer. The centrifuge tubes were shaken on an end-over-end shaker for 2 h and centrifuged at 3200 rpm for 15 min. After filtering (Whatman 52 filter paper), the samples were stored sealed containers until chemical analyses.
参照Black et al.(2012)的方法,采用0.05 M Ca(NO3)2浸提估算元素溶解度,该研究证明此法是测定施用生物固体土壤中金属生物有效性最有效的方法。称取5 g土壤于50 ml离心管中,加入30 ml浸提剂,用涡旋混合器制成悬浮液。离心管在翻转振荡器上振荡2 h,然后以3200 rpm离心15 min。经过滤(Whatman 52滤纸)后,样品储存于密封容器中待化学分析。
Pseudo-total elemental analysis was carried out using microwave digestion in 8 ml of Aristar™ nitric acid (±69%), filtered using Whatman 52 filter paper (pore site 7 μm), and diluted with milliQ water to a volume of 25 ml and stored for chemical analyses.
准全量元素分析采用8 ml Aristar™硝酸(±69%)微波消解,经Whatman 52滤纸(孔径7 μm)过滤,用milliQ水定容至25 ml后保存待化学分析。
Concentrations of Al, As, B, Ca, Cd, Cr, Cu, Fe, K, Mg, Mn, Na, Ni, P, Pb, S, and Zn were determined using inductively coupled plasma optical emission spectrometry (ICP-OES Varian 720 ES — USA).
Al、As、B、Ca、Cd、Cr、Cu、Fe、K、Mg、Mn、Na、Ni、P、Pb、S和Zn的浓度采用电感耦合等离子体发射光谱仪(ICP-OES Varian 720 ES — USA)测定。
Average total N and P, and pseudo total (aqua regia) concentrations of the other elements in the growth media. The “control” was a silt loam soil. Values in brackets represent standard errors in the treatments (n=6). Average pHs and standard error ranges were calculated using [H+]. In a row, values with the same superscripted letter are not significantly different.
生长介质中全N、全P的平均浓度及其他元素的准全量(王水)平均浓度。“对照”为粉砂壤土。括号内数值为各处理的标准误(n=6)。平均pH及其标准误范围根据[H+]计算。同一行中上标字母相同者表示差异不显著。
| Control对照 | T1 (biosolids)T1(生物固体) | T2 (biosolids+biochar)T2(生物固体+生物炭) | T3 (biochar)T3(生物炭) | |
|---|---|---|---|---|
| pH | 5.6 (5.6–5.7)a | 5.5 (5.5–5.6)a | 5.6 (5.5–5.6)a | 5.7 (5.6–5.8)a |
| C (%) | 3.3 (0.4)a | 3.7 (0.1)a | 5.7 (0.5)b | 5.0 (0.3)b |
| N (%) | 0.22 (0.01)a | 0.27 (0.02)a | 0.34 (0.03)b | 0.25 (0.00)a |
| P (mg kg−1) | 596 (7.0)a | 692 (30)b | 728 (29)b | 580 (27)a |
| K (mg kg−1) | 2958 (411)a | 4010 (290)a,b | 3852 (759)a,b | 4696 (280)b |
| S (mg kg−1) | 245 (5.9)a | 360 (30)a | 583 (80)b | 380 (33)a |
| Ca (mg kg−1) | 5889 (389)a | 6082 (334)a | 6692 (216)a | 6681 (163)a |
| Mg (mg kg−1) | 2579 (61)a | 2603 (47)a | 2503 (59)a | 2536 (96)a |
| Fe (%) | 1.4 (0.0)a | 1.4 (0.0)a,b | 1.40 (0.0)a,b | 1.4 (0.0)b |
| B (mg kg−1) | 12 (0.6)a,b | 13 (0.3)a | 11 (0.6)b | 13 (0.6)a |
| Mn (mg kg−1) | 237 (4.9)a | 240 (3.4)a | 235 (5.2)a | 239 (3.4)a |
| Cu (mg kg−1) | 7.3 (0.1)a | 20 (4.6)b | 30 (4.0)c | 9.0 (0.4)a |
| Zn (mg kg−1) | 52 (1.4)a | 69 (3.4)b | 89 (3.7)c | 54 (1.3)a |
| Al (%) | 1.6 (0.1)a | 1.8 (0.1)a | 1.6 (0.0)a | 1.8 (0.0)a |
| Na (mg kg−1) | 392 (31)a | 417 (27)a,b | 480 (13)b,c | 493 (14)c |
| Cd (mg kg−1) | 0.28 (0.01)a | 0.33 (0.02)a | 0.40 (0.02)b | 0.30 (0.02)a |
| Cr (mg kg−1) | 15 (0.4)a | 17 (0.2)a | 17 (0.8)a | 16 (0.7)a |
| Ni (mg kg−1) | 8.7 (0.3)a | 9.8 (0.9)a | 9.2 (0.2)a | 9.3 (0.4)a |
| As (mg kg−1) | 5.2 (0.2)a | 5.5 (0.2)a | 5.9 (0.3)a | 5.6 (0.3)a |
| Pb (mg kg−1) | 20 (0.8)a | 23 (1.2)b | 24 (0.9)b | 20 (0.7)a |
Reference soil and plant material (International Soil analytical Exchange — ISE 921 and International Plant analytical Exchange IPE 100) from Wageningen University, The Netherlands, was analysed for quality assurance. Recoverable concentrations were 91%–108% of the certified values.
为保证质量,分析了荷兰Wageningen University提供的土壤和植物参考物质(International Soil analytical Exchange — ISE 921和International Plant analytical Exchange IPE 100),回收浓度为认证值的91%–108%。
Data were analysed using Minitab® 16 (Minitab Inc., State College, Pennsylvania, USA). Data sets were analysed using ANOVA with Fisher's least-significant-difference post-hoc test to compare means. The level of significance was 0.05.
数据采用Minitab® 16(Minitab Inc., State College, Pennsylvania, USA)进行分析。数据集采用ANOVA分析,并用Fisher最小显著差数法进行事后多重比较。显著性水平为0.05。
3Results结果
3.1. Pseudo-total element concentrations in the soils3.1. 土壤中元素的准全量浓度
Given that there was no change in pH (Table 2), this increase may be due to differences in the Zn speciation in the biosolids compared to the soil, although we have insufficient data to speculate on the nature of this speciation.
鉴于pH未发生变化(表2),这一增加可能源于生物固体与土壤中Zn形态的差异,但现有数据尚不足以推断其具体形态。
The addition of biochar caused an increase in soluble Na and B. The addition of biochar did not cause a significant reduction in the solubility of any of the elements measured. This is in contrast to the findings of some other authors (reviewed by Beesley et al., 2011) who report that many biochars cause a reduction in metal solubility. Interestingly, Gan et al. (2012), reported that biochar reduced the solubility of Cu, Ni and Cr, but not Zn. Given the diverse properties of biochars, one would expect a range of influences on the solubility of metals in soil.
添加生物炭提高了可溶性Na和B的含量,但并未显著降低所测任何元素的溶解度。这与其他一些作者的研究结果(Beesley et al., 2011综述)相反,他们报道许多生物炭会降低金属溶解度。值得注意的是,Gan et al.(2012)报道生物炭降低了Cu、Ni和Cr的溶解度,但未降低Zn的溶解度。鉴于生物炭性质的多样性,其对土壤中金属溶解度的影响也可能各不相同。
Table 2 shows the pseudo-total elemental concentrations in the control soil and the treatments. The biosolids treatments (T1 and T2) caused a significant increase in total Zn, with levels increasing by a factor of 1.3 and 1.7, respectively. The T1 and T2 treatments also had higher N concentrations. Extrapolating to field conditions, the rate of N addition for the T1 and T2 treatments was equivalent to 650 and 1560 kg N ha−1 (assuming the biosolids are incorporated to a depth of 10 cm and the soil has a bulk density of 1.3 g ml−1). The rates of nitrogen addition in this study were close to the range 600–1200 kg N ha−1 where Knowles et al. (2011) demonstrated that biochar would mitigate leaching.表2列出了对照土壤及各处理中元素的准全量浓度。生物固体处理(T1和T2)显著提高了全Zn含量,分别增加至对照的1.3倍和1.7倍。T1和T2处理的N浓度也较高。外推至田间条件(假设生物固体混入深度为10 cm,土壤容重为1.3 g ml−1),T1和T2处理的氮添加量分别相当于650和1560 kg N ha−1。本研究的氮添加量接近Knowles et al.(2011)证明生物炭可减轻淋溶的范围(600–1200 kg N ha−1)。
The concentrations of Cd, Cu and Pb were also increased in the biosolids treatments, but remained below their respective Dutch target values (often used as surrogate values in NZ) of 0.8, 36, and 85 mg kg−1, respectively (Provoost et al., 2006).
生物固体处理中Cd、Cu和Pb的浓度也有所增加,但仍低于各自的荷兰目标值(在新西兰常作为替代参考值),即分别为0.8、36和85 mg kg−1(Provoost et al., 2006)。
The addition of biochar (T3) caused a significant increase in soil C, K, and Na. Extrapolating to field conditions (using the aforementioned assumptions), the rate of biochar addition is equivalent to 50 t ha−1. This rate of biochar addition was within the range rates reported by other authors (Chan et al., 2007).
添加生物炭(T3)显著提高了土壤C、K和Na含量。外推至田间条件(采用上述假设),生物炭添加量相当于50 t ha−1,处于其他作者报道的施用量范围之内(Chan et al., 2007)。
3.2. Soluble element concentrations in the soils3.2. 土壤中可溶性元素浓度
Table 3 shows the soluble (0.05 M Ca(NO3)2 extractable) concentrations of the measurable elements. Compared to the change in total Zn concentration in the T1 and T2 treatments (Table 3), soluble Zn increased disproportionately, by a factor of 4.4 and 7.5, respectively. There was also a disproportionate increase in soluble Cd and Cu.表3列出了可测元素的可溶性(0.05 M Ca(NO3)2可提取态)浓度。与T1和T2处理中全Zn浓度的变化(表3)相比,可溶性Zn的增幅不成比例地更大,分别增加至4.4倍和7.5倍。可溶性Cd和Cu也出现了不成比例的增加。
3.3. Plant growth3.3. 植物生长
All plants grew to maturity and none exhibited significant deficiency or toxicity symptoms. Table 4 shows the dry biomasses of the plants at harvesting. The biomasses of broccoli, corn, leeks, tomatoes, spinach and lettuce were not significantly affected by any of the treatments. The biomasses of the belowground vegetables, radish, beetroot, and carrot were significantly enhanced by the biowaste treatments (T1 and/or T2) and in the case of beetroot by all three treatments. This indicates that the growth enhancing effect may have been due to the physical structure of the soil, rather than the
所有植物均生长至成熟,未表现出明显的缺素或毒害症状。表4列出了收获时植物的干生物量。各处理对西兰花、玉米、韭葱、番茄、菠菜和生菜的生物量均无显著影响。地下部蔬菜萝卜、甜菜根和胡萝卜的生物量在生物废弃物处理(T1和/或T2)中显著提高,其中甜菜根在全部三个处理中均显著提高。这表明促进生长的效应可能源于土壤物理结构的改善,而非
Table 3表3
Average extractable (0.05 M Ca(NO3)2) concentrations and standard errors in the four different growth media (n=6). The “control” was a silt loam soil. All units are in mg kg−1. In a row, values with the same superscripted letter are not significantly different.
4种生长介质中可提取态(0.05 M Ca(NO3)2)元素的平均浓度及标准误(n=6)。“对照”为粉砂壤土。单位均为mg kg−1。同一行中上标字母相同者表示差异不显著。
| Control对照 | T1 (biosolids)T1 (生物固体) | T2 (biosolids+biochar)T2 (生物固体+生物炭) | T3 (biochar)T3 (生物炭) | |
|---|---|---|---|---|
| P | 0.54 (0.09)a | 0.74 (0.10)a,b | 1.00 (0.09)b | 0.77 (0.17)a,b |
| K | 15 (1.9)a | 16 (3.8)a | 22 (4.9)a | 25 (4.1)a |
| S | 8.6 (1.7)a | 10 (1.2)a | 35 (7.8)b | 26 (9.5)a,b |
| Mg | 14 (1.4)a | 15 (1.3)a,b | 18 (0.9)a,b | 18 (1.3)b |
| Fe | 0.44 (0.11)a | 0.45 (0.08)a | 0.47 (0.10)a | 0.82 (0.38)a |
| B | 0.11 (0.01)a | 0.12 (0.01)a | 0.15 (0.01)a,b | 0.17 (0.02)b |
| Mn | 3.8 (0.4)a | 4.0 (0.4)a | 3.6 (0.4)a | 3.6 (0.8)a |
| Cu | 0.021 (0.004)a | 0.032 (0.004)a | 0.053 (0.004)b | 0.021 (0.002)a |
| Zn | 0.14 (0.02)a | 0.61 (0.14)b | 1.05 (0.08)c | 0.13 (0.03)a |
| Na | 42 (5.1)a | 49 (3.6)a,b | 59 (1.2)b | 57 (3.0)b |
| Cd | 0.0015 (0.0002)a | 0.0031 (0.0004)b | 0.0042 (0.0002)c | 0.0017 (0.0001)a |
Average aboveground (unless otherwise indicated) dry biomass (g) and standard errors in the treatments (n=5). The “control” plants were grown in an un-amended was a silt loam soil. In a row, values with the same superscripted letter are not significantly different.
各处理中植物地上部(另有说明者除外)平均干生物量(g)及标准误(n=5)。“对照”植物种植于未改良的粉砂壤土中。同一行中上标字母相同者表示差异不显著。
| Control对照 | T1 (biosolids)T1(生物固体) | T2 (biosolids+biochar)T2(生物固体+生物炭) | T3 (biochar)T3(生物炭) | |
|---|---|---|---|---|
| Radisha | 2.7 (0.2)a | 3.9 (0.6)a,b | 4.3 (0.5)b | 3.9 (0.5)a,b |
| Lettuce | 3.0 (1.9)a | 2.8 (0.4)a | 4.3 (0.5)a | 3.8 (1.9)a |
| Spinach | 4.8 (1.7)a | 3.4 (0.9)a | – | 2.9 (0.9)a |
| Courgette | 15 (1.4)a | 11 (1.3)b | 16 (0.6)a,b | 13 (0.6)a,b |
| Beetroota | 4.9 (1.3)a | 10.4 (0.6)b | 9.4 (0.4)b | 9.4 (1.1)b |
| Tomato | 17 (0.8)a | 16 (2.6)a | 17 (2.0)a | 16 (2.6)a |
| Carrota | 3.1 (0.6)a | 6.6 (1.7)a,b | 7.6 (1.6)b | 5.4 (0.7)a,b |
| Leek | 7.4 (1.5)a | 6.2 (1.7)a | 8.2 (0.5)a | 6.2 (0.8)a |
| Oniona | 1.2 (0.3)a | 1.9 (0.4)a | 4.4 (0.8)b | 1.0 (0.4)a |
| Corn | 80 (9.5)a | 80 (4.9)a | 77 (8.7)a | 90 (4.2)a |
| Broccoli | 24 (5.9)a | 28 (2.1)a | 22 (5.6)a | 28 (4.7)a |
a Includes belowground edible portion.
a 包括地下可食部分。
addition of plant nutrients, which we ensured were sufficient in all treatments.
植物养分的添加,因为我们已确保所有处理中养分均充足。
3.4. Effect of the treatments on Zn biofortification3.4. 各处理对Zn生物强化的影响
Table 5 shows the effect of the treatments on the Zn concentrations in the edible portions of the plants. There was no significant increase in the Zn concentrations in onions, broccoli, and corn. In contrast, all other species showed a significant increase in the Zn concentration of their edible portions in one or both biosolids (T1 and T2) treatments. The biochar treatment (T3) resulted in a significant increase in the Zn concentrations of the radish bulb.表5列出了各处理对植物可食部分Zn浓度的影响。洋葱、西兰花和玉米的Zn浓度无显著增加。相反,其他所有物种可食部分的Zn浓度在一个或两个生物固体处理(T1和T2)中均显著增加。生物炭处理(T3)使萝卜肉质根的Zn浓度显著增加。
3.5. Fresh weight Zn concentrations in biofortified vegetables3.5. 生物强化蔬菜中的鲜重Zn浓度
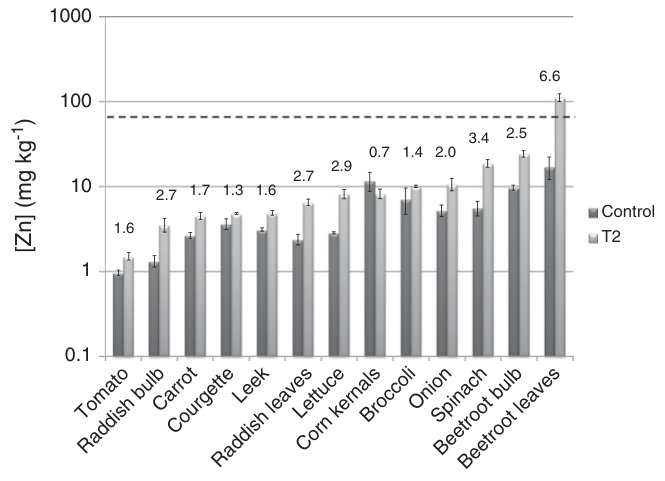
Fig. 1 shows the Zn concentrations of the control and the biosolids+biochar treatment (T2) on a fresh weight (i.e. as eaten) basis. Fig. 1 also indicates the biofortification coefficient, defined here as the treatment/control concentration coefficient. The leafy portions of the plants, namely beetroot leaves, spinach lettuce and radish leaves had the highest biofortification coefficients whereas the reproductive structures of the plants, namely tomato (full berry), courgette (swollen ovary), corn (whole culm) and broccoli (buds before flowering) had the lowest biofortification coefficients. This is consistent with the observation that Zn is primarily transported in the xylem and therefore tends to accumulate in the leaves which are the major water sink (Broadley et al., 2007).图1显示了对照和生物固体+生物炭处理(T2)中以鲜重(即食用状态)计的Zn浓度。图1还标出了生物强化系数,此处定义为处理/对照浓度之比。植物的叶部,即甜菜根叶、菠菜、生菜和萝卜叶,生物强化系数最高;而植物的生殖结构,即番茄(整个浆果)、西葫芦(膨大子房)、玉米(整个秆)和西兰花(开花前花蕾),生物强化系数最低。这与Zn主要经木质部运输、因而倾向于在作为主要水分汇的叶片中积累的观点一致(Broadley et al., 2007)。
Table 5表5
Average Zn concentrations and standard errors in the edible portions of the plants (n= 5). The “control” plants were grown in an un-amended was a silt loam soil. All units are in mg kg−1 on a dry matter basis. In a row, values with the same superscripted letter are not significantly different.
植物可食部分的平均Zn浓度及标准误(n= 5)。“对照”植物种植于未改良的粉砂壤土中。单位均为mg kg−1(以干物质计)。同一行中上标字母相同者表示差异不显著。
| Control对照 | T1 (biosolids)T1 (生物固体) | T2 (biosolids+biochar)T2 (生物固体+生物炭) | T3 (biochar)T3 (生物炭) | |
|---|---|---|---|---|
| Leek | 15 (1)a | 20 (5)a | 30 (3)b | 20 (2)a |
| Tomato | 17 (1)a | 23 (1)b | 26 (2)b | 16 (1)a |
| Carrot | 30 (3)a,b | 68 (13)c | 50 (5)b,c | 25 (1)a |
| Radish bulb | 33 (1)a | 111 (6)b | 84 (5)c | 54 (11)d |
| Onion | 34 (6)a | 61 (24)a | 67 (12)a | 44 (7)a |
| Lettuce | 45 (3)a | 62 (31)a | 156 (17)b | 52 (17)a |
| Radish leaves | 54 (7)a | 191 (20)b | 140 (17)c | 56 (11)a |
| Broccoli | 55 (7)a,b | 73 (17)a,b | 88 (2)a | 51 (7)b |
| Courgette | 55 (3)a | 83 (2)b | 84 (2)b | 54 (2)a |
| Corn kernels | 57 (15)a | 48 (4)a | 40 (5)a | 54 (10)a |
| Beetroot bulbs | 69 (6)a | 215 (21)b | 178 (11)b | 35 (4)a |
| Spinach | 77 (13)a | 177 (61)b | – | 48 (7)a |
| Beetroot leaves | 180 (25)a | 1178 (90)b | 1200 (74)b | 201 (8)a |
The plants with the highest Zn concentrations, which coincidentally had the highest biofortification coefficients, were the chenopods beetroot and spinach. A single 160 g serving of biofortified beetroot bulbs or spinach leaves could provide around half of the recommended daily intake of Zn of 11 mg.
Zn浓度最高的植物恰好也具有最高的生物强化系数,即藜科植物甜菜根和菠菜。一份160 g的生物强化甜菜根肉质根或菠菜叶可提供约一半的Zn每日推荐摄入量(11 mg)。
3.6. Fresh weight concentrations of heavy metals in the plants3.6. 植物中重金属的鲜重浓度
The maximum fresh weight concentrations of Cu and Pb in any of the plants were 1.27 and 0.046 mg kg−1, respectively (Tables S2 and S3, Supplementary data). Both of these values occurred in the T1 beetroot treatments. These are well below the maximum permitted concentrations (fresh weight) of 73 and 0.3 mg kg−1 for Cu and Pb, respectively that are prescribed by the World Health Organisation (Bigdeli and Seilsepour, 2008). The Pb concentrations in most plants were below detection limits (b0.01 mg kg−1).
所有植物中Cu和Pb的最高鲜重浓度分别为1.27和0.046 mg kg−1(表S2和S3,补充数据),均出现在T1处理的甜菜根中。这些数值远低于世界卫生组织规定的Cu和Pb最高允许浓度(鲜重)73和0.3 mg kg−1(Bigdeli and Seilsepour, 2008)。大多数植物中的Pb浓度低于检出限(<0.01 mg kg−1)。
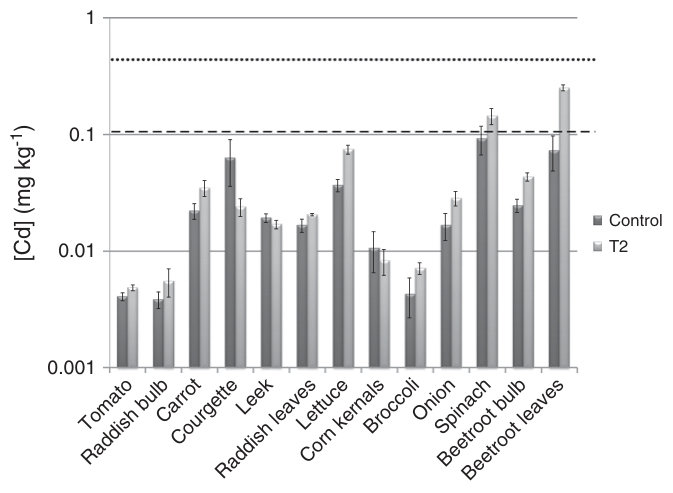
Fresh weight Cd concentrations were significantly increased in the T1 treatments of beetroot, radish, onion and carrots, whereas only beetroot was significantly increased in the T2 treatment (Table 6). This indicates that the biochar may have slightly decreased the Cd uptake by some species. On a fresh weight basis, the Cd concentrations in the biofortified leaves of spinach and beetroot (Fig. 2) exceeded the World Health Organisation's limit for Cd in vegetables of 0.1 mg kg−1 (Bigdeli and Seilsepour, 2008). However, the amount of Cd in a 160 g portion of plant tissue was still well below the tolerable daily intake of 0.06 mg of Cd (WHO, 2007).
T1处理显著提高了甜菜根、萝卜、洋葱和胡萝卜的鲜重Cd浓度,而在T2处理中仅甜菜根显著提高(表6)。这表明生物炭可能略微降低了某些物种对Cd的吸收。以鲜重计,生物强化菠菜和甜菜根叶片中的Cd浓度(图2)超过了世界卫生组织规定的蔬菜Cd限值0.1 mg kg−1(Bigdeli and Seilsepour, 2008)。然而,160 g植物组织中的Cd含量仍远低于Cd每日耐受摄入量0.06 mg(WHO, 2007)。
Average Cd concentrations and standard errors in the edible portions of the plants (n= 5). The “control” plants were grown in an un-amended was a silt loam soil. All units are in mg kg−1 on a dry matter basis. In a row, values with the same superscripted letter are not significantly different.
植物可食部分的平均Cd浓度及标准误(n= 5)。“对照”植物种植于未改良的粉砂壤土中。单位均为mg kg−1(以干物质计)。同一行中上标字母相同者表示差异不显著。
| Control对照 | T1 (biosolids)T1 (生物固体) | T2 (biosolids+biochar)T2 (生物固体+生物炭) | T3 (biochar)T3 (生物炭) | |
|---|---|---|---|---|
| Leek | 0.10 (0.00)a | 0.09 (0.02)a | 0.10 (0.01)a | 0.07 (0.02)a |
| Tomato | 0.07 (0.00)a | 0.09 (0.01)a | 0.09 (0.01)a | 0.07 (0.01)a |
| Carrot | 0.26 (0.05)a | 0.64 (0.13)b | 0.39 (0.03)a | 0.20 (0.03)a |
| Radish bulb | 0.10 (0.01)a | 0.13 (0.01)a | 0.14 (0.02)a | 0.11 (0.01)a |
| Onion | 0.11 (0.03)a | 0.36 (0.14)b | 0.18 (0.03)a,b | 0.18 (0.01)a,b |
| Lettuce | 0.60 (0.09)a | 0.75 (0.03)a | 1.46 (0.13)b | 0.78 (0.10)a,b |
| Radish leaves | 0.38 (0.04)a | 0.50 (0.03)b | 0.45 (0.02)a,b | 0.41 (0.03)a,b |
| Broccoli | 0.03 (0.01)a,b | 0.05 (0.02)a,b | 0.07 (0.01)a | 0.02 (0.00)b |
| Courgette | 0.96 (0.40)a | 1.68 (1.16)a | 0.43 (0.08)a | 0.87 (0.57)a |
| Corn kernels | 0.05 (0.02)a | 0.05 (0.01)a | 0.04 (0.01)a | 0.05 (0.01)a |
| Beetroot bulbs | 0.18 (0.02)a | 0.36 (0.05)b | 0.33 (0.03)b | 0.12 (0.01)a |
| Spinach | 1.30 (0.32)a | 1.42 (0.45)a | – | 0.78 (0.14)a |
| Beetroot leaves | 0.78 (0.12)a | 3.41 (0.40)b | 2.77 (0.06)b | 1.04 (0.11)a |
4Discussion讨论
The Zn concentration in the edible portions of tomatoes, carrots, radish (bulbs and leaves), courgette and beetroot (bulbs and leaves) were either not significantly different or significantly less in the T2 treatment compared to the T1 treatment. This indicates that the biochar may have the effect of slightly reducing the Zn uptake in some species. Nevertheless, the field application of the high rates of biosolids required for biofortification may be unacceptable unless their potential for nitrate leaching has been mitigated, for example by adding biochar.
与T1处理相比,T2处理中番茄、胡萝卜、萝卜(肉质根和叶)、西葫芦和甜菜根(肉质根和叶)可食部分的Zn浓度无显著差异或显著降低。这表明生物炭可能会略微降低某些物种对Zn的吸收。尽管如此,生物强化所需的高量生物固体在田间施用可能难以被接受,除非其硝酸盐淋溶风险已得到缓解,例如通过添加生物炭。
The high Cd uptake was surprising given that the total concentration of Cd in the soil was well below even conservative threshold values (Provoost et al., 2006). When consumed, the high Zn concentrations in the leaves of the chenopods may reduce the effective toxicity of Cd by stimulating the production of metallothioneins in the liver (Klaassen et al., 1999).
鉴于土壤中Cd的全量浓度远低于即便是保守的阈值(Provoost et al., 2006),Cd的高吸收量出乎意料。食用时,藜科植物叶片中的高Zn浓度可能通过刺激肝脏中金属硫蛋白的产生而降低Cd的实际毒性(Klaassen et al., 1999)。
We used a relatively acidic soil (pH=5.6) in these experiments. It is likely that the biofortification coefficient would be reduced at higher pH values, where the solubility of Zn2+ is reduced (Robinson et al., 2009). Simply increasing the Zn concentration in vegetables may not necessarily improve human Zn nutrition. Other compounds present in the plants, such as oxalates, phytates, tannins and fibres reduce Zn uptake by the gut (White and Broadley, 2005). Cooking or other pre-processing of the vegetables before consumption may result in changes in the Zn concentration and changes in the human bioavailability of the Zn.
本试验使用的是相对酸性的土壤(pH=5.6)。在较高pH条件下,Zn2+溶解度降低,生物强化系数可能随之下降(Robinson et al., 2009)。单纯提高蔬菜中的Zn浓度未必能改善人体Zn营养状况。植物中存在的其他化合物,如草酸盐、植酸盐、单宁和纤维,会降低肠道对Zn的吸收(White and Broadley, 2005)。蔬菜食用前的烹饪或其他预处理可能改变Zn浓度及其对人体的生物有效性。
Our experiments tested a single cultivar of each species. It is well known that genetic variation between vegetable cultivars can result in significant differences in Zn and Cd uptake (Crews and Davies, 1985; McLaughlin et al., 1994). Alexander et al. (2006) reported no significant differences in Zn uptake between five cultivars of lettuce, onion, spinach and carrot. Carrot and spinach had significant differences in Cd uptake. Clearly, our results are therefore not applicable to all cultivars of the crop species tested.
本试验每个物种仅测试了一个品种。众所周知,蔬菜品种间的遗传差异可导致Zn和Cd吸收的显著差异(Crews and Davies, 1985; McLaughlin et al., 1994)。Alexander et al.(2006)报道,生菜、洋葱、菠菜和胡萝卜的5个品种间Zn吸收无显著差异,而胡萝卜和菠菜的Cd吸收存在显著差异。因此,本研究结果显然并不适用于所测作物物种的所有品种。
We did not monitor the concentrations of other organic contaminants, such as triclosan or estrogens, which may have been present in the biosolids. It is possible that the risk of such pollutions is reduced when the biosolids is combined with biochar because of sorption by the latter (Beesley et al., 2011). Similarly, the risk of human infection with pathogens from the biosolids needs to be eliminated. Here again the role of the biochar in the mixture is unknown. Heat or chemical pre-treatment of the biosolids may be necessary although this could greatly increase the cost of the operation.
我们未监测生物固体中可能存在的其他有机污染物(如三氯生或雌激素)的浓度。由于生物炭的吸附作用,生物固体与生物炭混合施用时此类污染的风险可能降低(Beesley et al., 2011)。同样,必须消除生物固体中病原体导致人体感染的风险,而混合物中生物炭在这方面的作用尚不清楚。可能需要对生物固体进行热处理或化学预处理,但这会大幅增加运行成本。
5Conclusions结论
Adding a combination of biosolids and biochar to an acidic soil increased the total and soluble Zn concentrations, improved plant growth and resulted in increased Zn uptake by most plants. The increase in Zn uptake is highly species dependent. Biofortified beetroot has bulb and leaf Zn concentrations that are manifold higher than those present in staple crops. However, it is unclear whether this Zn is in a form that is bioavailable to humans. Adding biosolids and biochar to soil may be an effective means of disposing of waste materials, while improving soil fertility, increasing soil carbon and potentially alleviating Zn deficiencies in humans or animals. Future work should focus on testing the performance of these amendments in other soil types, particularly those with high pHs. The role of biochar in reducing some other problems associated with biosolids such as pathogens and organic contaminants should also be investigated.
向酸性土壤中添加生物固体与生物炭的组合提高了土壤全Zn和可溶性Zn浓度,促进了植物生长,并使大多数植物的Zn吸收增加。Zn吸收的增加高度依赖于物种。生物强化甜菜根的肉质根和叶片Zn浓度比主粮作物高出数倍。然而,这些Zn是否以人体可利用的形态存在尚不清楚。向土壤中添加生物固体和生物炭可能是处置废弃物的有效途径,同时可改善土壤肥力、增加土壤碳,并有望缓解人类或动物的缺Zn问题。今后的研究应重点检验这些改良剂在其他土壤类型(尤其是高pH土壤)中的效果,并探讨生物炭在减轻生物固体相关的其他问题(如病原体和有机污染物)中的作用。
Acknowledgements致谢
We thank the Environmental Science and Research (ESR) and the Foundation for Research, Science and Technology (FRST), for their funding on this project of ‘Closing the loop — rebuilding our soils with biowastes’. We also thank Kate Henry for helping with the experimental setup.
感谢Environmental Science and Research(ESR)和Foundation for Research, Science and Technology(FRST)对“Closing the loop — rebuilding our soils with biowastes”项目的资助。同时感谢Kate Henry协助搭建试验。
Appendix A. Supplementary data附录A. 补充数据
Supplementary data to this article can be found online at http:// dx.doi.org/10.1016/j.scitotenv.2012.10.027.
本文补充数据可在线获取:http:// dx.doi.org/10.1016/j.scitotenv.2012.10.027。
References参考文献
Alexander PD, Alloway BJ, Dourado AM. Genotypic variations in the accumulation of Cd, Cu, Pb and Zn exhibited by six commonly grown vegetables. Environ Pollut 2006;144:736–45.
Balik J, Tlustos P, Pavlikova D, Szakova J, Blahnik R, Kaewrahun S. The effect of sewage sludge on zinc content in soil and plants. Rostl Vyroba 1998;44:457–62.
Beesley L, Marmiroli M. The immobilisation and retention of soluble arsenic, cadmium and zinc by biochar. Environ Pollut 2011;159:474–80.
Beesley L, Moreno-Jimenez E, Gomez-Eyles JL, Harris E, Robinson B, Sizmur T. A review of biochars' potential role in the remediation, revegetation and restoration of contaminated soils. Environ Pollut 2011;159:3269–82.
Bigdeli M, Seilsepour M. Investigation of metals accumulation in some vegetables irrigated with waste water in Shahre Rey-Iran and toxicological implications. Am Eurasian J Agric Environ Sci 2008;4:86–92.
Black A, McLaren RG, Reichman SM, Speir TW, Condron LM. Examining the integrity of soil metal bioavailability assays in the presence of organic amendments to metal-spiked soils. Soil Use Manag 2012;28:89-100.
Bradley J. New Zealand. In: LeBlanc RJ, Matthews P, Richard RP, editors. Global Atlas of excreta, wastewater sludge, and biosolids management: moving forward the sustainable and welcome uses of a global resource. United Nations Human Settlements Programme (UN-HABITAT): Nairobi; 2008. p. 447–54.
Broadley MR, White PJ, Hammond JP, Zelko I, Lux A. Zinc in plants. New Phytol 2007;173:677–702.
Cakmak I. Enrichment of cereal grains with zinc: agronomic or genetic biofortification? Plant Soil 2008;302:1-17.
Cao X, Ma L, Liang Y, Gao B, Harris W. Simultaneous Immobilization of lead and atrazine in contaminated soils using dairy-manure biochar. Environ Sci Technol 2011;45: 4884–9.
Chan KY, Van Zwieten L, Meszaros I, Downie A, Joseph S. Agronomic values of greenwaste biochar as a soil amendment. Aust J Soil Res 2007;45:629–34.
Chaney RL. 20 years of land application research.1. BioCycle 1990;31:54–9.
Clough TJ, Bertram JE, Ray JL, Condron LM, O'Callaghan M, Sherlock RR, et al. Unweathered wood biochar impact on nitrous oxide emissions from a bovine-urine-amended pasture soil. Soil Sci Soc Am J 2010;74:852–60.
Crews HM, Davies BE. Heavy-metal uptake from contaminated soils by 6 varieties of lettuce (Lactuca-sativa L). J Agric Sci 1985;105:591–5.
Dong X, Ma LQ, Li Y. Characteristics and mechanisms of hexavalent chromium removal by biochar from sugar beet tailing. J Hazard Mater 2011;190:909–15.
Dudas MJ, Pawluk S. Trace elements in sewage sludges and metal uptake by plants grown on sludge-amended soil. Can J Soil Sci 1975;55:239–43.
Earle J. The gymnosperm database. http://www.conifers.org/pi/pin/radiata.htm. 2010.
Gan W, He Y, Zhang X, Zhang S, Lin Y. Effects and mechanisms of straw biochar on remediation contaminated soil in electroplating factory. J Ecol Rural Environ 2012;28:305–9.
Gibbs T. Guidelines for the safe application of biosolids to land in New Zealand. Wellington N.Z.: New Zealand Water & Wastes Association; Ministry for the Environment; 2003. p. vi. 177.
Gomez-Eyles JL, Sizmur T, Collins CD, Hodson ME. Effects of biochar and the earthworm Eisenia fetida on the bioavailability of polycyclic aromatic hydrocarbons and potentially toxic elements. Environ Pollut 2011;159:616–22.
Ho E. Zinc deficiency, DNA damage and cancer risk. J Nutr Biochem 2004;15:572–8.
Hotz C, Brown KH. International Zinc Nutrition Consultative Group (IZiNCG) technical document #1. Assessment of the risk of zinc deficiency in populations and options for its control. Food Nutr Bull 2004;25:S94-S203.
Karami N, Clemente R, Moreno-Jimenez E, Lepp NW, Beesley L. Efficiency of green waste compost and biochar soil amendments for reducing lead and copper mobility and uptake to ryegrass. J Hazard Mater 2011;191:41–8.
Kemp A, Hemkes OJ. Effect of sewage sludge on the contents of cadmium, lead, zinc and copper in soil and crop. Bedrijfsontwikkeling 1976;7:825–32.
Klaassen CD, Liu J, Choudhuri S. Metallothionein: an intracellular protein to protect against cadmium toxicity. Annu Rev Pharmacol Toxicol 1999;39:267–94.
Knowles OA, Robinson BH, Contangelo A, Clucas L. Biochar for the mitigation of nitrate leaching from soil amended with biosolids. Sci Total Environ 2011;409:3206–10.
Krogmann U, Boyles LS, Bamka WJ, Chaiprapat S, Martel CJ. Biosolids and sludge management. Water Environ Res 1999;71:692–714.
McLaughlin MJ, Williams CMJ, McKay A, Kirkham R, Gunton J, Jackson KJ, et al. Effect of cultivar on uptake of cadmium by potato-tubers. Aust J Agric Res 1994;45:1483–95.
Provoost J, Cornelis C, Swartjes F. Comparison of soil clean-up standards for trace elements between countries: why do they differ? J Soils Sediments 2006;6:173–81. Robinson BH, Banuelos G, Conesa HM, Evangelou MWH, Schulin R. The phytomanagement of trace elements in soil. Crit Rev Plant Sci 2009;28:240–66.
Singh BP, Agrawal M. Potential benefits and risks of land application of sewage sludge. Waste Manag 2008;28:347–58.
Smith SR. A critical review of the bioavailability and impacts of heavy metals in municipal solid waste composts compared to sewage sludge. Environ Int 2009;35:142–56.
Taghizadeh-Toosi A, Clough TJ, Condron LM, Sherlock RR, Anderson CR, Cragie RA. Biochar incorporation into pasture soil suppresses in situ N2O emissions from ruminant urine patches. J Environ Qual 2011;40:468–76.
Uchimiya M, Chang S, Klasson KT. Screening biochars for heavy metal retention in soil: role of oxygen functional groups. J Hazard Mater 2011a;190:432–41.
Uchimiya M, Wartelle LH, Klasson KT, Fortier CA, Lima IM. Influence of pyrolysis temperature on biochar property and function as a heavy metal sorbent in soil. J Agric Food Chem 2011b;59:2501–10.
Weggler-Beaton K, Graham RD, McLaughlin MJ. The influence of low rates of air-dried biosolids on yield and phosphorus and zinc nutrition of wheat (Triticum durum) and barley (Hordeum vulgare). Aust J Soil Res 2003;41:293–308.
Wells N, Whitton JS. Trace element content of Auckland sewage sludge and its influence on soil and plant composition. In: Aggett J, Kjellstrom T, Crowe D, editors. Proceedings of the second New Zealand seminar on trace elements and health; 1979. p. 98-106.
White PJ, Broadley MR. Biofortifying crops with essential mineral elements. Trends Plant Sci 2005;10:586–93.
WHO. Health risks of heavy metals from long range trans-boundary air pollution. Joint WHO/Convention Task Force on the Health Aspects of Air Pollution; 2007.