Received: 21 September 2020 Revised: 16 February 2021 Accepted article published: 11 March 2021 Published online in Wiley Online Library: 27 March 2021 (wileyonlinelibrary.com) DOI 10.1002/jsfa.11209
Furong Li,a,b,c Xu Wang,a,b Fuhua Wang,a,b Dian Wen,a,b Zhichao Wu,a,b Yingqiong Du,a,b Ruiying Du,a,b Brett H Robinsonc* and Peihua Zhaoa,b
1Abstract摘要
BACKGROUND: Most countries set regulatory values for the total trace element (TE) concentrations in soil, although there is growing interest in using a risk-based approach to evaluate the bioavailable TE using dilute salt extractants or other soil parameters, including pH and organic carbon. The present study compares the current regulatory system (based on total TEs and pH) and a risk-based approach using 0.01 mol L–1 CaCl2 to estimate the bioavailable fraction.
背景:大多数国家针对土壤中微量元素(TE)的全量设定了监管限值,但利用稀盐提取剂或其他土壤参数(包括pH和有机碳)评估生物有效态TE的风险评估方法日益受到关注。本研究比较了现行监管体系(基于TE全量和pH)与以0.01 mol L–1 CaCl2估算生物有效组分的风险评估方法。
RESULTS: In total, 150 paired samples of Chinese flowering cabbages (Brassica parachinensis) and their growth soils were collected, and the total and extractable concentrations of chromium (Cr), cadmium (Cd), lead (Pb), nickel (Ni), copper (Cu), zinc (Zn), arsenic (As) and mercury (Hg), as well as soil pH and organic matter content, were measured. No more than 3.33% of the edible parts exceeded Chinese food safety standards, even when growing in soils exceeding the current regulatory thresholds by over 50%. The total soil Cd (1.5 mg kg−1), as well as the extractable concentrations of Cd (0.1 mg kg−1), Ni (0.03 mg kg−1) and Zn (0.1 mg kg−1), are the key factors affecting the TE concentrations in B. parachinensis.
结果:共采集150对菜心(Brassica parachinensis)及其生长土壤样品,测定了铬(Cr)、镉(Cd)、铅(Pb)、镍(Ni)、铜(Cu)、锌(Zn)、砷(As)和汞(Hg)的全量及可提取态含量,以及土壤pH和有机质含量。即使生长在超过现行监管阈值50%以上的土壤中,可食部分超过中国食品安全标准的比例也不超过3.33%。土壤全Cd(1.5 mg kg−1)以及可提取态Cd(0.1 mg kg−1)、Ni(0.03 mg kg−1)和Zn(0.1 mg kg−1)是影响B. parachinensis中TE含量的关键因素。
CONCLUSION: Our findings suggest that the current soil regulatory guidelines for safe production of B. parachinensis are overly strict and conservative. A risk-based approach based on the extractable TE concentrations would provide a better indication for plant uptake of soil TEs and avoid the waste of farmlands that can still produce safe vegetables. Future research should focus on providing crop-specific available TE concentration guidelines to promote effective utilization of farmlands. © 2021 Society of Chemical Industry
结论:研究结果表明,现行针对B. parachinensis安全生产的土壤监管标准过于严格和保守。基于可提取态TE含量的风险评估方法能更好地指示植物对土壤TE的吸收,并避免浪费仍可生产安全蔬菜的农田。未来研究应着重制定针对特定作物的有效态TE含量标准,以促进农田的有效利用。© 2021 Society of Chemical Industry
Supporting information may be found in the online version of this article.
支撑信息见本文在线版本。
Keywords: heavy metal; bioavailable; extraction; safe production; micronutrient; security threshold
关键词:重金属;生物有效性;提取;安全生产;微量营养素;安全阈值
2INTRODUCTION引言
Even at very low concentrations, trace elements (TEs) can profoundly affect life both positively and negatively.1 Arsenic (As), cadmium (Cd), mercury (Hg) and lead (Pb) are non-essential elements for human metabolism are listed in the top 20 hazardous substances by the US Environmental Protection Agency and the Agency for Toxic Substances and Disease Registry.2,3 Some heavy metals, such as zinc (Zn), chromium (Cr), copper (Cu) and nickel (Ni), are not only essential micronutrients, but also toxins that cause health hazards depending on their concentrations in the diet.4,5 Zn deficiency affects human health worldwide, especially in developing countries.6 In China, the rate of Zn deficiency is 3.9% for children aged 3–5 years.7 There are various pathways for human exposure to TEs and the consumption of vegetables grown in TE-contaminated soil comprises one of the major pathways.8 Therefore, the scientific assessment of TE uptake and accumulation characteristics of vegetables from the soil is necessary for the safe production of crops and evaluation of soil quality.9,10
即使在极低浓度下,微量元素(TE)也会对生命产生深刻的正面或负面影响。1砷(As)、镉(Cd)、汞(Hg)和铅(Pb)是人体代谢的非必需元素,被美国环境保护署和有毒物质与疾病登记署列入前20种有害物质。2,3部分重金属,如锌(Zn)、铬(Cr)、铜(Cu)和镍(Ni),不仅是必需的微量营养素,同时也是毒素,其是否危害健康取决于膳食中的含量。4,5锌缺乏影响着全世界人类的健康,在发展中国家尤为突出。6在中国,3–5岁儿童的锌缺乏率为3.9%。7人体暴露于TE的途径多种多样,食用生长在TE污染土壤中的蔬菜是主要途径之一。8因此,科学评估蔬菜从土壤中吸收和累积TE的特征,对于作物安全生产和土壤质量评价十分必要。9,10
As China has rapidly transitioned from a traditionally agricultural-based economy to an industrial and technologybased economy over the last 30 years, increasing contaminant levels are threatening agricultural soil, especially in South China where there is also increasing soil acidification.11 This combination could heighten the risk of TE accumulation in food and subsequently endanger human health.3,12 The TEs in crops mainly originate from the plant uptake of TEs from the soil, and so it is necessary to set scientific soil regulatory values to ensure the effective use of agricultural soil and food safety.13,14 Although most countries have regulatory values for the total soil TE concentrations,15,16 there is increasing interest in using a risk-based approach considering ‘bioavailable’ TE.10,17 There are weak correlations between total soil TE concentrations and plant TE concentrations because the TE uptake of plants from soil also depends on the plant variety and the available soil pool, which is affected by several soil properties, such as pH, organic matter content and cation exchange capacity.18,19 Measuring the extractable TE concentration in soil may provide a more reliable prediction of TE accumulation in crops.20
过去30年间,中国已从传统农业经济迅速转型为工业和技术型经济,不断升高的污染物水平正威胁着农业土壤,尤其是在土壤酸化同样日益加剧的华南地区。11二者叠加可能加大TE在食物中累积的风险,进而危害人体健康。3,12作物中的TE主要来源于植物对土壤TE的吸收,因此有必要制定科学的土壤监管限值,以确保农业土壤的有效利用和食品安全。13,14尽管大多数国家针对土壤TE全量设定了监管限值,15,16但考虑“生物有效态”TE的风险评估方法日益受到关注。10,17土壤TE全量与植物TE含量之间的相关性较弱,因为植物从土壤中吸收TE还取决于植物品种和土壤有效态库,而后者受pH、有机质含量和阳离子交换量等多种土壤性质的影响。18,19测定土壤中可提取态TE含量可能对作物TE累积提供更可靠的预测。20
* Correspondence to: B H Robinson, School of Physical and Chemical Science, University of Canterbury, Christchurch 8041, New Zealand. E-mail: brett. robinson@canterbury.ac.nz
a Institute of Quality Standard and Monitoring Technology for Agro-Products of Guangdong Academy of Agricultural Sciences, Guangzhou, China
a 广东省农业科学院农产品公共监测中心,中国广州
b Key Laboratory of Testing and Evaluation for Agro-product Safety and Quality, Ministry of Agriculture and Rural Affairs, Guangzhou, China
b 农业农村部农产品质量安全检测与评价重点实验室,中国广州
c School of Physical and Chemical Sciences, University of Canterbury, Christchurch, New Zealand
c 坎特伯雷大学物理与化学科学学院,新西兰基督城
Chinese flowering cabbage (Brassica parachinensis L.) is an important vegetable in China that is cultivated year-round and exported worldwide.21,22 B. parachinensis has a higher bioaccumulation coefficient for Cd than other vegetables.23,24 The Zn concentration in the dry matter of cabbage exceeds 50 mg kg−1,25 which is higher than that in cereal crops by approximately 20 mg kg−1.26 Moreover, many Brassica species accumulate elevated concentrations of Ni, Pb and Cu,27 which indicates that B. parachinensis is a sensitive indicator of TE contamination in soil.
菜心(Brassica parachinensis L.)是中国重要的蔬菜,全年种植并出口世界各地。21,22与其他蔬菜相比,B. parachinensis对Cd具有更高的生物累积系数。23,24白菜干物质中的Zn含量超过50 mg kg−1,25比谷类作物高约20 mg kg−1。26此外,许多Brassica属植物会累积较高浓度的Ni、Pb和Cu,27这表明B. parachinensis是土壤TE污染的敏感指示植物。
In the present study, we hypothesized that a risk-based approach using a diluted salt to extract soil would provide a more robust assessment of TE uptake by B. parachinensis than the threshold for the total soil TE concentrations. We aimed to compare the current regulatory system based on total TE concentration and pH with a risk-based approach using a diluted neutral salt (0.01 mol L–1 CaCl2) to estimate a bioavailable fraction, as suggested previously.28,29 Because some TEs are both toxic and essential micronutrients for humans, the results of this study will provide a scientific basis for the safe utilization of Chinese farmland soil and for developing the nutritional value of B. parachinensis.
本研究假设:与基于土壤TE全量的阈值相比,采用稀盐溶液提取土壤的风险评估方法能更稳健地评估B. parachinensis对TE的吸收。研究旨在比较基于TE全量和pH的现行监管体系与前人所建议的、采用稀中性盐(0.01 mol L–1 CaCl2)估算生物有效组分的风险评估方法。28,29由于某些TE对人体而言既有毒性又是必需的微量营养素,本研究结果将为中国农田土壤的安全利用以及开发B. parachinensis的营养价值提供科学依据。
3MATERIALS AND METHODS材料与方法
Soil and vegetable sampling土壤与蔬菜采样
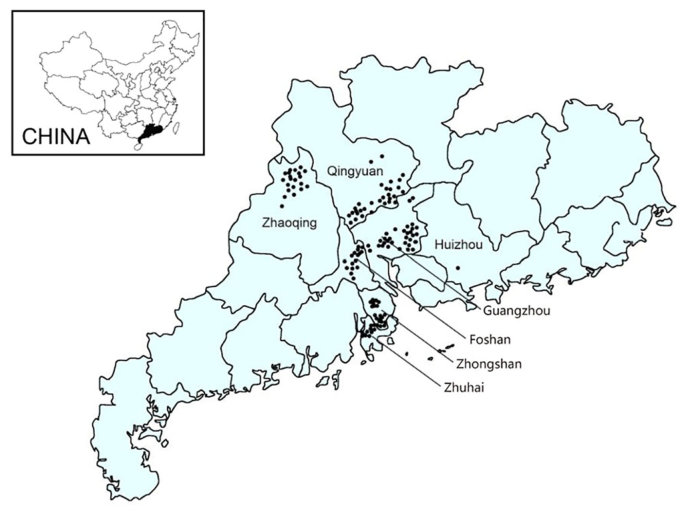
Soil and vegetable samples were collected from the main production areas of B. parachinensis in several cities (Foshan, Huizhou, Guangzhou, Qingyuan, Zhaoqing, Zhongshan and Zhuhai) of Guangdong Province, South China (Fig. 1). These selected soils represented a range of TE concentrations, including sites suspected to be contaminated by their proximity to industry and areas with a history of sewage sludge application. Overall, 150 pairs of B. parachinensis samples and their corresponding growth soils were collected. At each sampling site with an area of 100–500 m2, approximately 20 individual B. parachinensis plants were randomly sampled by removing the entire plant as a whole and then dividing it into the shoot and root. The corresponding soil was collected at a depth of 0–20 cm under the plant samples and mixed thoroughly.30 All samples were stored in sealed polyethylene bags and transferred to the laboratory.17
土壤和蔬菜样品采自华南广东省若干城市(佛山、惠州、广州、清远、肇庆、中山和珠海)的B. parachinensis主产区(图1)。所选土壤涵盖一定范围的TE含量,包括因临近工业而疑似受污染的地点以及有污水污泥施用历史的区域。共采集150对B. parachinensis样品及其对应的生长土壤。在每个面积为100–500 m2的采样点,随机采集约20株B. parachinensis,将整株植物拔出,再分为地上部和根部。在植物样品下方0–20 cm深度采集对应土壤并充分混匀。30所有样品均装入密封聚乙烯袋中运回实验室。17
Soil analysis土壤分析
The soil samples were air-dried at room temperature after removing stones and plant debris. Then, they were ground with a mortar and a pestle and passed through 2 mm (for pH and extractable TE analysis) and 0.149 mm (for organic matter and total TE concentration analysis) nylon screens.31 The pH was measured using a soil suspension with soil water ratio of 1:2.5 and a glass pH electrode.32 The soil organic matter content was determined by the Walkley Black method.5 The total Cr, Cd, Pb, Ni, Cu and Zn concentrations were determined by inductively coupled plasma mass spectrometry (ICP-MS) (Agilent 7700x ICPMS; Agilent Technologies, Santa Clara, CA, USA) based on the methodology from our previous work.33 This was performed after acid digestion of 0.2 g soil for 4.5 h using a mixture of concentrated HNO3 + H- ClO4 + HF (6.4 + 1.6 + 4 mL) in a covered Teflon crucible with a temperature-controlled graphite digester (DigiBlock ED54; Lab- Tech, Shanghai, China) with the temperature gradually increased to 120 °C for 0.5 h, 150 °C for 0.5 h and 210 °C for 2.5 h. For the total As and Hg concentrations, 0.25 g of soil was added to colorimetric tubes with stoppers and digested with a mixture of concentrated HCl:HNO3:H2O (3:1:4, 10 mL) in a water bath (100 °C) for 2 h and then subjected to atomic fluorescence spectrometry (AFS) (AFS-9130, Jitian Instruments Co. Ltd, Beijing, China).9
土壤样品剔除石块和植物残体后于室温下风干,然后用研钵和研杵研磨,分别过2 mm(用于pH和可提取态TE分析)和0.149 mm(用于有机质和TE全量分析)尼龙筛。31采用土水比1:2.5的土壤悬浊液和玻璃pH电极测定pH。32土壤有机质含量采用Walkley-Black法测定。5Cr、Cd、Pb、Ni、Cu和Zn全量参照本课题组前期工作的方法,33采用电感耦合等离子体质谱法(ICP-MS)(Agilent 7700x ICPMS;Agilent Technologies, Santa Clara, CA, USA)测定。测定前,取0.2 g土壤置于加盖的Teflon坩埚中,加入浓HNO3 + HClO4 + HF混合酸(6.4 + 1.6 + 4 mL),在控温石墨消解仪(DigiBlock ED54;LabTech, Shanghai, China)中消解4.5 h,温度逐步升至120 °C保持0.5 h、150 °C保持0.5 h及210 °C保持2.5 h。As和Hg全量的测定:取0.25 g土壤置于具塞比色管中,加入浓HCl:HNO3:H2O混合液(3:1:4,10 mL),于水浴(100 °C)中消解2 h,然后采用原子荧光光谱法(AFS)(AFS-9130,北京吉天仪器有限公司,中国北京)测定。9
The available concentrations of Cr, Cd, Pb, Ni, Cu, Zn, As and Hg were determined by 10.0 g of soil with 100 mL of 0.01 mol L–1 CaCl2 in centrifuge tubes.34 Samples were placed on a horizontal shaker revolving at 180 times min−1 for 120 min in a room at a constant temperature of 20 ± 2 °C. After centrifugation at 1000 × g for 10 min, the supernatant was filtered through 0.45-μm microporous barrel-type filters with Luer lock syringes and then diluted five times with 2% HNO3 before analysis by ICP-MS.
Cr、Cd、Pb、Ni、Cu、Zn、As和Hg的有效态含量测定方法为:在离心管中以100 mL 0.01 mol L–1 CaCl2提取10.0 g土壤。34样品置于恒温(20 ± 2 °C)室内的水平振荡器上,以180次 min−1振荡120 min。以1000 × g离心10 min后,上清液经带Luer锁口注射器的0.45 μm筒式微孔滤膜过滤,再用2% HNO3稀释5倍,然后采用ICP-MS分析。
Plant analysis植物分析
The vegetable samples were rinsed with tap and distilled water, and then divided into the edible parts (shoots) and roots to be homogenized with a blender (HR1848; Philips, Dongguan, China). After weighing, subsamples were digested with a mixture of HNO3:HClO4 (4:1, v/v) at 160 °C.10 The Cr, Cd, Pb, Ni, Cu and Zn concentrations were subsequently measured by graphite furnace atomic absorption spectrometry (GFAAS; Zeenit 600; Analytik Jena AG, Jena, Germany), whereas the As and Hg concentrations were determined by AFS.35
蔬菜样品经自来水和蒸馏水冲洗后,分为可食部分(地上部)和根部,用搅拌机(HR1848;Philips,中国东莞)匀浆。称重后,取子样品以HNO3:HClO4(4:1,v/v)混合酸于160 °C下消解。10随后采用石墨炉原子吸收光谱法(GFAAS;Zeenit 600;Analytik Jena AG, Jena, Germany)测定Cr、Cd、Pb、Ni、Cu和Zn含量,As和Hg含量则采用AFS测定。35
Quality control/assurance质量控制与保证
To ensure accuracy, the calibration curves were kept within the linear concentration range based on six working standard solutions (WAKO Pure Chemical Industries Ltd, Osaka, Japan), with regression coefficient (r2) > 0.999.35 Both blanks and standard reference materials (GSB-5 for vegetable samples, GSS-7 for soil samples, from the National Center for Standard Reference Materials of China, Guangzhou, China) were included for quality assurance and quality control.10 Reproducibility was tested by re-analyzing 5% of the samples, and recovery was 90–107%. The limits of detection for Cr, Cd, Pb, Ni, Cu, Zn, As and Hg were 0.05, 0.002, 0.02, 0.2, 0.05, 0.5, 0.002 and 0.001 mg kg−1, respectively. The limits of quantity were 0.2, 0.005, 0.005, 0.5, 0.2, 2.0, 0.005 and 0.003 mg kg−1, respectively.
为确保准确性,基于6个工作标准溶液(WAKO Pure Chemical Industries Ltd, Osaka, Japan)使校准曲线保持在线性浓度范围内,回归系数(r2)> 0.999。35质量保证与质量控制中同时加入空白样和标准参考物质(蔬菜样品用GSB-5,土壤样品用GSS-7,均来自中国国家标准物质中心,中国广州)。10通过重复分析5%的样品检验重现性,回收率为90–107%。Cr、Cd、Pb、Ni、Cu、Zn、As和Hg的检出限分别为0.05、0.002、0.02、0.2、0.05、0.5、0.002和0.001 mg kg−1,定量限分别为0.2、0.005、0.005、0.5、0.2、2.0、0.005和0.003 mg kg−1。
Statistical analysis统计分析
The soil TE concentrations were measured using dry matter in accordance with the methodology of the Soil Environmental Quality-Risk Control Standard for Soil Contamination of Agricultural Land.36 In vegetables, it was measured using fresh matter, according to the National Food Safety Standard (FSS)- Contaminant Limit in Food set by the Chinese Ministry of Health.37 All data were processed using Excel 2016 (Microsoft Corp., Redmond, WA, USA). Data were tested for normality and log-normally distributed data were log-transformed prior to statistical analyses. Differences between means were determined using analysis of variance (ANOVA) with a post-hoc Fisher's test. p < 0.05 was considered statistically significant. Statistical analyses were performed using SPSS, version 19.0 (IBM Corp., Armonk, NY, USA).
土壤TE含量按照《土壤环境质量 农用地土壤污染风险管控标准》的方法以干重计。36蔬菜中TE含量按照中国卫生部发布的《食品安全国家标准 食品中污染物限量》(FSS)以鲜重计。37所有数据均使用Excel 2016(Microsoft Corp., Redmond, WA, USA)处理。对数据进行正态性检验,对数正态分布的数据在统计分析前进行对数转换。均值间差异采用方差分析(ANOVA)及Fisher事后检验确定,以p < 0.05为具有统计学显著性。统计分析采用SPSS 19.0(IBM Corp., Armonk, NY, USA)进行。
4RESULTS AND DISCUSSION结果与讨论
TE concentrations in soils and plants土壤和植物中的TE含量
The soil As, Cd, Cr, Cu, Hg, Ni, Pb and Zn concentrations are listed in Table 1. Soil had a mean pH value of 5.90 and soil organic matter content of 27.29 g kg−1, which represents the typical characteristics of acidic soil in South China. The coefficient variations of the total TE concentrations in the soil for all eight TEs were over 44%, with the concentrations for most of the eight TEs ranging from low to moderately polluted levels according to the Chinese soil thresholds.36 Therefore, soil selection was suitable for determining the validity of the Chinese soil regulations for the safe production of vegetables.18 Note that these concentrations were not representative of soils throughout the region because we specifically chose soils with elevated TE concentrations. There were significant positive correlations between most of the total soil concentrations of the eight TEs (see Supporting information, Table S1). This suggested that a single factor, such as industrial activity, was the most important determinant of the total soil TE concentrations.38 standards for specific vegetables in China. Therefore, developing crop-specific soil guidelines for different types of crops is necessary in future research.
土壤As、Cd、Cr、Cu、Hg、Ni、Pb和Zn含量列于表1。土壤pH均值为5.90,有机质含量为27.29 g kg−1,代表了华南酸性土壤的典型特征。土壤中8种TE全量的变异系数均超过44%,根据中国土壤阈值,8种TE中大多数的含量处于低度至中度污染水平。36因此,所选土壤适合用于检验中国土壤法规对蔬菜安全生产的有效性。18需要指出的是,由于本研究专门选取了TE含量较高的土壤,这些含量并不代表整个区域的土壤状况。8种TE的土壤全量之间大多呈显著正相关(见支撑信息表S1),表明工业活动等单一因素是决定土壤TE全量的最重要因素。38针对中国特定蔬菜的标准。因此,未来研究有必要针对不同类型作物制定特定作物的土壤标准。
Table 2 shows the TE concentrations in different parts of B. parachinensis and the percentage exceeding the Chinese FSS,37 indicating that most vegetable samples posed no health threat even when grown in soils with elevated TE concentrations. Few samples exceeded FSS, including 2% for Cr, 3.33% for Cd and 1.33% for Pb. Thus, the current soil regulatory guidelines for B. parachinensis production are conservative because most plants growing in soils exceeding the guideline values had TE concentrations below FSS.18 Table 2 also shows the root TE concentrations of B. parachinensis, which were much higher than those of the shoots. Although the roots of this vegetable are not routinely consumed, the results suggests that root vegetables such as radish, potato and carrot may contain higher TE concentrations.39,40 Presently, there are no specialized soil environmental quality表2列出了B. parachinensis不同部位的TE含量及超过中国FSS的比例,37表明即使生长在TE含量较高的土壤中,大多数蔬菜样品也不构成健康威胁。超过FSS的样品很少,其中Cr为2%、Cd为3.33%、Pb为1.33%。因此,现行B. parachinensis生产的土壤监管标准较为保守,因为大多数生长在超过标准值土壤中的植物,其TE含量均低于FSS。18表2还列出了B. parachinensis根部的TE含量,远高于地上部。尽管该蔬菜的根部通常不被食用,但结果表明,萝卜、马铃薯和胡萝卜等根类蔬菜可能含有较高的TE含量。39,40目前,尚无专门的土壤环境质量
| Element元素 | Total soil TEs土壤TE全量 | Coefficient variation (%)变异系数(%) | Soil thresholda土壤阈值a | Percentage exceeding soil threshold (%)超过 土壤阈值比例(%) | Extractable soil TEs土壤可提取态TE |
|---|---|---|---|---|---|
| Cr | 60.99 (10.08–333.13) | 61.03 | 150/150/200/250 | 0.67 | 0.01 (0–1.08) |
| Cd | 0.46 (0.06–5.69) | 132.75 | 0.3/0.3/0.3/0.6 | 54.67 | 0.03 (0–0.79) |
| Pb | 59.47 (20.30–406.03) | 63.03 | 70/90/120/170 | 11.33 | 0.01 (0–0.34) |
| Ni | 23.21 (5.57–49.29) | 61.23 | 60/70/100/190 | 0 | 0.11 (0–2.51) |
| Cu | 37.56 (7.88–99.29) | 52.95 | 50/50/100/100 | 24.67 | 0.05 (0–0.44) |
| Zn | 120.61 (42.03–357.21) | 44.17 | 200/200/250/300 | 5.33 | 0.89 (0–12.97) |
| As | 14.32 (1.90–45.37) | 58.35 | 40/40/30/25 | 4.00 | 0.02 (0–0.18) |
| Hg | 0.44 (0.05–11.76) | 251.56 | 1.3/1.8/2.4/3.4 | 4.67 | 0 |
a The first value is at pH ≤ 5.5, the second value is 5.5 < pH ≤ 6.5, the third value is at 6.5 < pH ≤ 7.5 and the fourth value is at pH > 7.5.
a 第一个值对应pH ≤ 5.5,第二个值对应5.5 < pH ≤ 6.5,第三个值对应6.5 < pH ≤ 7.5,第四个值对应pH > 7.5。
| Element元素 | Edible parts可食部分 | FSS | Percentage exceeding FSS (%)超过FSS比例(%) | Roots根系 |
|---|---|---|---|---|
| Cr | 0.13 (0.03–1.23) | 0.5 | 2.00 | 0.47 (0–5.85) |
| Cd | 0.05 (0.004–1.03) | 0.2 | 3.33 | 0.06 (0.004–1.06) |
| Pb | 0.08 (0.02–0.43) | 0.3 | 1.33 | 0.29 (0–3.35) |
| Ni | 0.08 (0.02–0.50) | NA | NA | 0.30 (0–3.87) |
| Cu | 0.49 (0.19–0.98) | NA | NA | 0.52 (0.05–2.01) |
| Zn | 3.64 (1.35–10.57) | NA | NA | 6.41 (1.69–33.06) |
| As | 0.01 (0.003–0.06) | 0.5 | 0 | 0.07 (0–0.71) |
| Hg | 0.001 (0–0.02) | 0.01 | 0 | 0.001 (0–0.01) |
NA, no data for analysis.
NA:无分析数据。
Plant uptake capacity of different TEs植物对不同TE的吸收能力
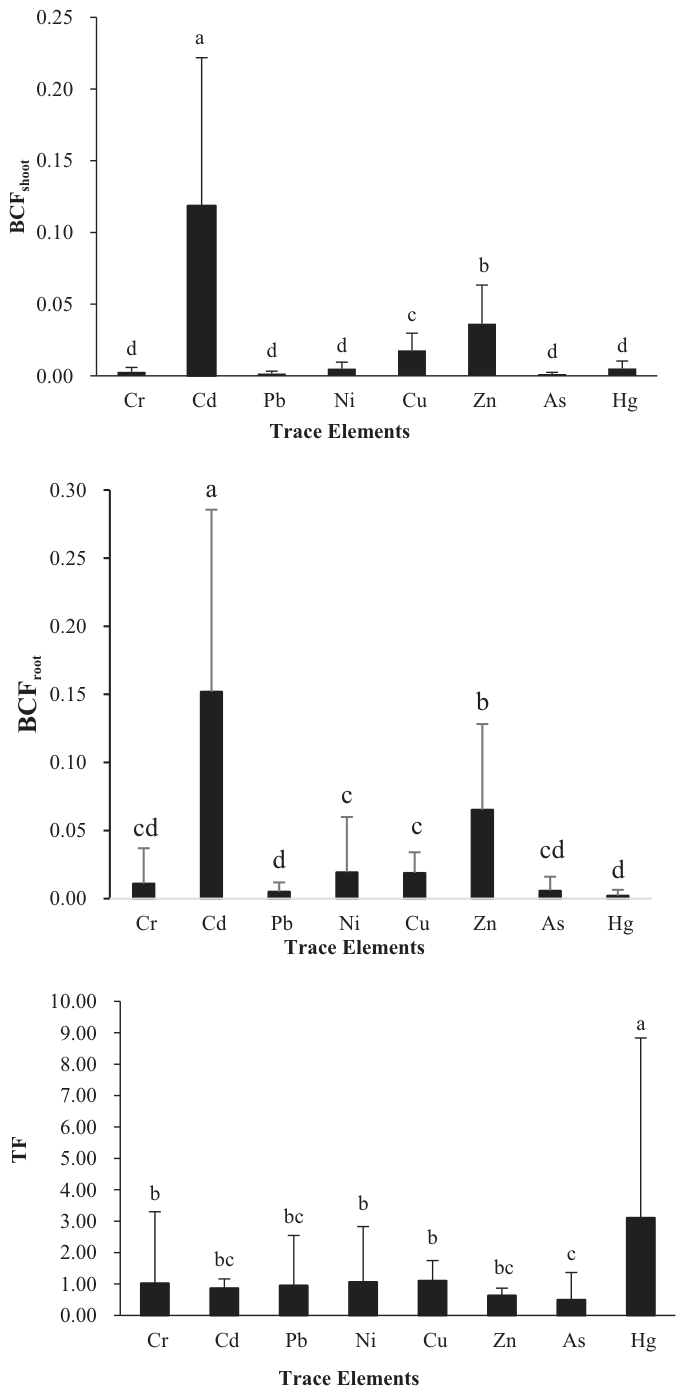
Among the many soil–plant transfer indices used to evaluate the environmental safety risks of soil TEs, the bioconcentration factor (BCF) and transfer coefficient (TF) are two of the most essential.11,14 BCF is the ratio of TE concentration in different parts of the plant to that in the soil, and it determines the degree of plant TE uptake from the soil.3,9 TF is the ratio of TE in the aboveground part to that in the underground part, which is an important indicator for measuring the distribution and transportation of TEs in plants.17 Higher values of BCF and TE indicate the greater potential of plants to transfer TEs from the soil to the food chain.17 The TE uptake capacity of B. parachinensis demonstrates obvious differences (Fig. 2). Generally, the uptake capacity of the shoots of B. parachinensis was Cd > Zn > Cu > Hg > Ni > Cr > Pb > As. The BCFshoot (0.119) of Cd was significantly higher than that of other TEs, followed by Zn (0.036) and Cu (0.018). For BCFroot, the order of the eight TEs was Cd > Zn > Ni = Cu > Cr > As > Pb > Hg. The BCFroot (0.152) of Cd was significantly higher than that of other TEs, followed by Zn (0.065), Ni (0.019) and Cu (0.019). TEs had different transfer rates from belowground to aboveground plant parts, in the order Hg > Cu > Ni > Cr > Pb > Cd > Zn > As. The TF values of Hg, Cu, Ni and Cr were over 1, with that of Hg being the largest (3.105). Even at extremely low concentrations, long-term exposure of Hg can cause serious health problems for humans.41,42 Therefore, it is necessary to avoid planting leafy vegetables including B. parachinensis in Hg-contaminated soil.
在用于评价土壤TE环境安全风险的众多土壤–植物转移指数中,生物富集系数(BCF)和转运系数(TF)是最基本的两个指标。11,14BCF是植物不同部位TE含量与土壤TE含量之比,决定了植物从土壤中吸收TE的程度。3,9TF是地上部与地下部TE含量之比,是衡量TE在植物体内分布和运输的重要指标。17BCF和TF值越高,表明植物将TE从土壤转移至食物链的潜力越大。17B. parachinensis对不同TE的吸收能力存在明显差异(图2)。总体而言,B. parachinensis地上部的吸收能力依次为Cd > Zn > Cu > Hg > Ni > Cr > Pb > As。Cd的BCFshoot(0.119)显著高于其他TE,其次为Zn(0.036)和Cu(0.018)。8种TE的BCFroot依次为Cd > Zn > Ni = Cu > Cr > As > Pb > Hg。Cd的BCFroot(0.152)显著高于其他TE,其次为Zn(0.065)、Ni(0.019)和Cu(0.019)。不同TE从地下部向地上部的转运速率不同,依次为Hg > Cu > Ni > Cr > Pb > Cd > Zn > As。Hg、Cu、Ni和Cr的TF值均大于1,其中Hg最大(3.105)。即使浓度极低,长期暴露于Hg也会对人体造成严重的健康问题。41,42因此,有必要避免在Hg污染土壤中种植包括B. parachinensis在内的叶菜类蔬菜。
Compared with other elements, Cd was more easily absorbed by the shoots and roots of B. parachinensis, whereas As was less easily accumulated in the shoots. This was consistent with the finding of Chang et al.23 that Cd had a high transfer capacity from soil into vegetables, with a BCF value approximately 30 times that of Hg and 50 times that of Cr, Pb and As. The mobility of Cd in the soil and its bioaccumulation in the food chain surpass those of all other heavy metals, especially for vegetables grown in acidic soils of South China, which are prone to Cd accumulation.20,43,44 This may be caused by competition between Cd2+ and Ca2+ because Ca2+ has an ionic radii and valance more similar to Cd2+ than to other TEs.23,45 The BCF and TF of Zn and Cu in B. parachinensis were relatively greater than those of most other TEs. The higher uptake of essential metals such as Cu, Zn and Ni observed in other vegetables may be a result of specific uptake transporters that maintain their growth.46 Li et al.47 compared the Zn concentrations of several leaf vegetables and found that B. parachinensis took up more Zn (3.3 mg kg−1) than other vegetables. Both Zn and Cu are essential elements for human health, although they may be toxic when their concentrations exceed safe limits.48 Although, generally, there is little risk of dietary copper deficiency in healthy people, there are numerous factors that increase the risk of copper deficiency.4 Additionally, approximately 0.45 million children under 5 years of age die of Zn deficiency and over 2 billion people suffer from it.49 Because dietary diversification is one of the common approaches to alleviate micronutrient deficiency,4,50 the incluision of B. parachinensis grown in biofortified soil in the diet may be a potential resource for ameliorating Zn and Cu deficiency.
与其他元素相比,Cd更易被B. parachinensis的地上部和根部吸收,而As在地上部较难累积。这与Chang et al.23的研究结果一致,即Cd从土壤向蔬菜的转移能力较强,其BCF值约为Hg的30倍、Cr、Pb和As的50倍。Cd在土壤中的迁移性及其在食物链中的生物累积超过其他所有重金属,尤其是对于华南酸性土壤中种植的蔬菜,其易于累积Cd。20,43,44这可能是由于Cd2+与Ca2+之间的竞争所致,因为与其他TE相比,Ca2+的离子半径和化合价与Cd2+更为相近。23,45B. parachinensis中Zn和Cu的BCF和TF相对高于大多数其他TE。在其他蔬菜中观察到的对Cu、Zn和Ni等必需金属的较高吸收,可能源于维持其生长的特异性吸收转运蛋白。46Li et al.47比较了几种叶菜的Zn含量,发现B. parachinensis吸收的Zn(3.3 mg kg−1)多于其他蔬菜。Zn和Cu均为人体健康必需元素,但其含量超过安全限值时可能产生毒性。48尽管健康人群膳食铜缺乏的风险通常较小,但仍有众多因素会增加铜缺乏的风险。4此外,约45万名5岁以下儿童死于锌缺乏,超过20亿人受其影响。49由于膳食多样化是缓解微量营养素缺乏的常用途径之一,4,50在膳食中纳入生长在生物强化土壤中的B. parachinensis可能是改善锌和铜缺乏的潜在资源。
Plant TE uptake as a function of the total soil TE concentrations植物TE吸收与土壤TE全量的关系
The correlations between the soil and shoot TE concentrations are shown in Table 3. There were significant positive correlations between the total concentrations in soil and shoots for Cr, Cd, Ni and As, whereas no significant correlations existed for Pb, Cu, Zn and Hg. Although the total soil TE is the most important source for vegetable absorption, there are other TE sources that influence TE accumulation in leafy vegetables, such as the application of pesticides and chemical fertilizers (e.g. Cu and Zn) and atmospheric deposition (e.g. Pb and Hg).11,51 Additionally, the processes of TE uptake accumulation, and redistribution in vegetables are dependent on plant cultivars and the bioavailable fraction of soil TE, which are notably affected by several soil properties, especially pH, organic carbon content, clay content and soil redox potential.52,53 calculated threshold values of the total soil Cd concentrations were 2.42 mg kg−1 and 1.94 mg kg−1 for leafy vegetables and B. chinensis in Guangdong Province, respectively.10,30 Xiao et al.18 proposed a threshold value of 0.84 mg kg−1 for B. chinensis with 31 paired soil–vegetable samples in Zhejiang Province, South China. Considering different soil pH levels (pH < 5.0, 5.5 ≤ pH ≤6.5, 6.5 < pH ≤7.5, pH > 7.5), Hu et al.17 computed the threshold values of the total soil Cd concentrations for leafy vegetables as 0.32, 0.48, 1.56 and 2.64 mg kg−1, respectively. Most of the proposed threshold values were much higher than the current Chinese threshold values for total Cd in agricultural soil (0.3 mg kg−1 for pH ≤7.5 and 0.6 mg kg−1 for pH > 7.5).36 This suggests that the current Cd soil threshold values might be too strict for the safe production of leafy vegetables, which may result in large amounts of soil that could produce safe vegetables being considered as contaminated and excluded from agricultural production.18 It also indicates that further studies focusing on different crops and agricultural regions are necessary to provide accurate and rigorous soil TE regulation for vegetable cultivation.
土壤与地上部TE含量之间的相关性见表3。Cr、Cd、Ni和As的土壤全量与地上部含量之间呈显著正相关,而Pb、Cu、Zn和Hg则无显著相关性。尽管土壤TE全量是蔬菜吸收的最重要来源,但仍有其他TE来源影响叶菜类蔬菜中TE的累积,如农药和化肥的施用(如Cu和Zn)以及大气沉降(如Pb和Hg)。11,51此外,蔬菜中TE的吸收、累积和再分配过程取决于植物品种和土壤TE的生物有效组分,而后者明显受多种土壤性质的影响,尤其是pH、有机碳含量、黏粒含量和土壤氧化还原电位。52,53计算得出广东省叶菜类蔬菜和B. chinensis的土壤全Cd阈值分别为2.42 mg kg−1和1.94 mg kg−1。10,30Xiao et al.18基于华南浙江省31对土壤–蔬菜样品,提出B. chinensis的阈值为0.84 mg kg−1。Hu et al.17考虑不同土壤pH水平(pH < 5.0、5.5 ≤ pH ≤6.5、6.5 < pH ≤7.5、pH > 7.5),计算得出叶菜类蔬菜的土壤全Cd阈值分别为0.32、0.48、1.56和2.64 mg kg−1。大多数所提出的阈值远高于中国现行农业土壤全Cd阈值(pH ≤7.5时为0.3 mg kg−1,pH > 7.5时为0.6 mg kg−1)。36这表明,现行土壤Cd阈值对于叶菜类蔬菜安全生产而言可能过于严格,可能导致大量本可生产安全蔬菜的土壤被视为污染土壤而被排除在农业生产之外。18这也表明,有必要针对不同作物和农业区域开展进一步研究,以便为蔬菜种植提供准确而严谨的土壤TE监管。
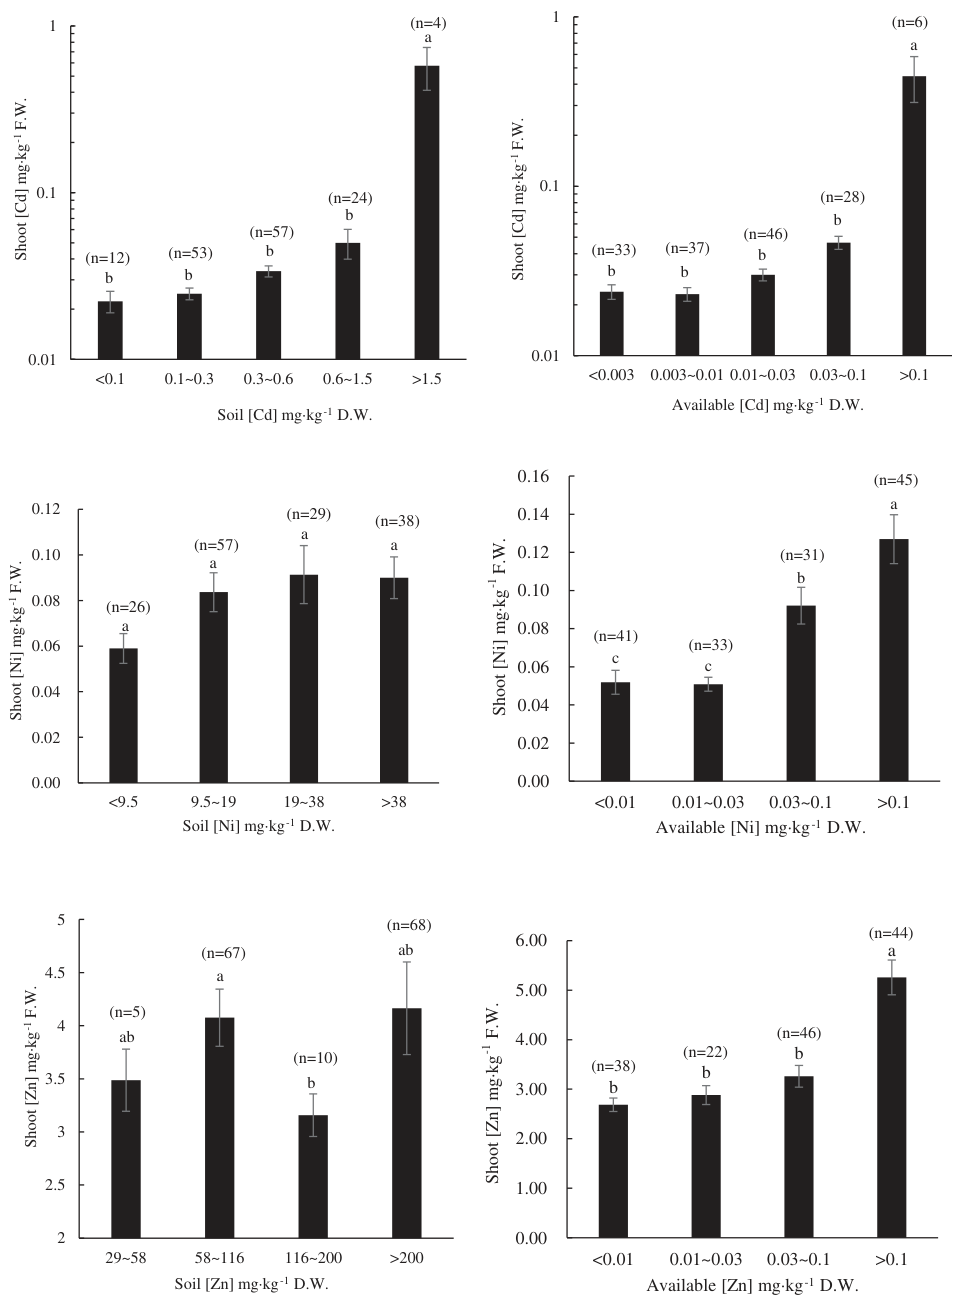
Figure 3 shows the shoot TE concentrations with increasing concentration bands in the soil. The total TE concentration bands were divided into the soil background concentration at 3–4 times the Chinese regulatory thresholds. For Cd, plant concentration was significantly increased in the highest soil concentration band (>1.5 mg kg−1), whereas the other TEs showed no significant differences with respect to their shoot concentrations among the different total soil concentration bands. Based on the multiple linear regression analysis and curve estimation of Cd concentrations for 276 and 170 paired soil–vegetable samples excluding pH, the图3显示了地上部TE含量随土壤含量区间升高的变化。TE全量区间从土壤背景值划分至中国监管阈值的3–4倍。对于Cd,在土壤最高含量区间(>1.5 mg kg−1)中植物含量显著升高,而其他TE的地上部含量在不同土壤全量区间之间无显著差异。基于对276对和170对土壤–蔬菜样品Cd含量进行的不含pH的多元线性回归分析和曲线估计,
Plant TE uptake as a function of the extractable soil TE concentrations植物TE吸收与土壤可提取态TE含量的关系
The correlations between the plant TE concentrations and the CaCl2-extractable concentrations in soil are shown in Table 3. For Cr, Pb, Cu and As, there were no significant correlations. To a small extent, this may be related to the multiple sources of TEs taken up by plants other from agricultural soil,51,54 along with the influence of physiological, anatomical and biochemical factors of different cropcultivars.3,55 ForHg,theconcentrationswerebelowthedetection limit (< 0.002 mg kg−1). Significantly positive correlations were obtained for Cd, Ni and Zn, and their correlation coefficients for extractable concentrations were much greater than those for thetotal concentrations, indicatingthat the extractableconcentrations provided a better indication of plant uptake for Cd, Ni and Zn. Similar observations were made by Yang et al.53 for the correlationsof CaCl2-Cd insoiland Cd invegetablesandSun et al.30 forthe correlations of DTPA-Cd in soil and Cd in vegetables.
植物TE含量与土壤CaCl2可提取态含量之间的相关性见表3。Cr、Pb、Cu和As无显著相关性。这在一定程度上可能与植物吸收的TE除农业土壤外还有多种来源有关,51,54也与不同作物品种的生理、解剖和生化因素的影响有关。3,55Hg的含量低于检出限(< 0.002 mg kg−1)。Cd、Ni和Zn呈显著正相关,且其可提取态含量的相关系数远大于全量的相关系数,表明对于Cd、Ni和Zn,可提取态含量能更好地指示植物吸收。Yang et al.53在土壤CaCl2-Cd与蔬菜Cd的相关性研究中,以及Sun et al.30在土壤DTPA-Cd与蔬菜Cd的相关性研究中均有类似发现。
Dividing the extractable TE concentrations into bands based on the distribution ranges and sample numbers showed significant differences in plant uptake for Cd, Ni and Zn (Fig. 3). The other elements without significant differences for their TE concentrations in shoots among the different total soil or extractable TE concentration bands were not shown in the figures. Plant uptake was significantly increased for CaCl2-extractable Cd (> 0.1 mg kg−1), Ni (> 0.03 mg kg−1) and Zn (> 0.1 mg kg−1), which are the thresholds affecting TE concentrations in B. parachinensis. The proposed extractable soil Cd thresholds with DTPA extraction were calculated as 0.13–0.37 mg kg−1 for different leafy vegetables in Zhejiang Province18 and as 1.08 mg kg−1 for leafy vegetables30 and 1.43 mg kg−1 for B. chinensis10 in Guangdong Province. Although the established soil quality TE thresholds for most countries are derived from the total TE concentrations with or without involving pH,16,44 some countries such as Japan, Switzerland and Germany use the extractable TE concentrations.10,56 The soil thresholds based on the available TEs are generally more reliable for food safety than those based on the total TEs.31,43 Because CaCl2 (0.01 mol L–1) simulates the ionic strength of the soil solution and is widely used to extract the readily bioavailable TEs from soil,57 the CaCl2-extractable TE threshold is considered as a good indicator of soil TE bioavailability, especially for Pb and Cd.31,58 The most important thing to set guidelines for CaCl2-extractable TEs of agricultural soil in future is development of robust extraction and detection methods.
根据分布范围和样本数量将可提取态TE含量划分为若干区间,结果显示Cd、Ni和Zn的植物吸收存在显著差异(图3)。其余在不同土壤全量或可提取态含量区间之间地上部TE含量无显著差异的元素未在图中列出。当CaCl2可提取态Cd(> 0.1 mg kg−1)、Ni(> 0.03 mg kg−1)和Zn(> 0.1 mg kg−1)超过上述值时,植物吸收显著增加,这些值即为影响B. parachinensis中TE含量的阈值。采用DTPA提取计算得出的土壤可提取态Cd阈值,浙江省不同叶菜类蔬菜为0.13–0.37 mg kg−1,18广东省叶菜类蔬菜为1.08 mg kg−1,30B. chinensis为1.43 mg kg−1。10尽管大多数国家既定的土壤质量TE阈值来源于TE全量(考虑或不考虑pH),16,44但日本、瑞士和德国等一些国家采用可提取态TE含量。10,56基于有效态TE的土壤阈值通常比基于TE全量的阈值对食品安全更为可靠。31,43由于CaCl2(0.01 mol L–1)可模拟土壤溶液的离子强度,且被广泛用于提取土壤中易生物有效的TE,57CaCl2可提取态TE阈值被认为是土壤TE生物有效性的良好指标,尤其对于Pb和Cd。31,58未来制定农业土壤CaCl2可提取态TE标准,最重要的是建立稳健的提取和检测方法。
| Element元素 | Total soil TE土壤TE全量 | Extractable soil TE土壤可提取态TE |
|---|---|---|
| Cr | 0.22 | 0.01NS |
| Cd | 0.52 | 0.59 |
| Pb | 0.03NS | 0.03NS |
| Ni | 0.16* | 0.63 |
| Cu | 0.08NS | 0.01NS |
| Zn | −0.12NS | 0.49 |
| As | 0.24 | 0.09NS |
| Hg | 0.16NS | NA |
Statistical significance: *p < 0.05 and **p < 0.01. NS, no significant correlation. NA, no data for analysis.
统计显著性:*p < 0.05,**p < 0.01。NS:无显著相关性。NA:无分析数据。
Correlation analysis of soil TE concentrations, soil pH and organic matter content土壤TE含量、土壤pH与有机质含量的相关性分析
There were significant positive correlations 0.22 < r2 < 0.44 between the total and extractable elements for Cr, Cd, Pb, Ni, Cu and As (Table 4), which indicates that the extractable concentrations were likely influenced by the total concentrations. Most total TEs demonstrated no correlation or a weak positive correlation with soil pH. However, most of the CaCl2-extractable TEs were significantly negatively correlated with soil pH, especially Cd, Ni and Zn. Soil pH is commonly considered a major factor in extractable soil TE concentrations and vegetable TE accumulation because it controls metal speciation, solubility and mobility in the soil metal pool, and a low soil pH usually facilitates TE bioavailability.9,54 Taking the total TE concentrations as the soil thresholds, soil pH significantly contributed to the regression model fit for Cd transfer in soil-crop systems.28,59 The total soil TEs should be combined with soil pH to be reasonably predictive of TE concentrations in aboveground plant tissue. As the pH effect is already accounted for when using the CaCl2 extractable TEs to predict plant TE accumulation,31 pH has no added value for calculating soil CaCl2-extractable TE thresholds for B. parachinensis production, which would improve the accuracy and convenience of the soil environmental quality guideline.30,60
Cr、Cd、Pb、Ni、Cu和As的全量与可提取态之间呈显著正相关(0.22 < r2 < 0.44)(表4),表明可提取态含量可能受全量影响。大多数TE全量与土壤pH无相关性或呈弱正相关。然而,大多数CaCl2可提取态TE与土壤pH呈显著负相关,尤其是Cd、Ni和Zn。土壤pH通常被认为是影响土壤可提取态TE含量和蔬菜TE累积的主要因素,因为其控制着土壤金属库中金属的形态、溶解度和迁移性,而低pH通常会提高TE的生物有效性。9,54以TE全量作为土壤阈值时,土壤pH对土壤–作物系统中Cd转移的回归模型拟合有显著贡献。28,59土壤TE全量应与土壤pH相结合,才能合理预测植物地上部组织中的TE含量。由于采用CaCl2可提取态TE预测植物TE累积时已考虑了pH的影响,31因此在计算B. parachinensis生产的土壤CaCl2可提取态TE阈值时,pH并无额外价值,这将提高土壤环境质量标准的准确性和便利性。30,60
| Element元素 | Total-extractable TE全量–可提取态TE | Total TE–pHTE全量–pH | Total TE–organic matterTE全量–有机质 | Extractable TE–pH可提取态TE–pH | Extractable TE–organic matter可提取态TE–有机质 |
|---|---|---|---|---|---|
| Cr | 0.44 | 0.17* | 0.10NS | −0.06NS | 0.00NS |
| Cd | 0.38 | 0.17* | 0.10NS | −0.71 | −0.24 |
| Pb | 0.35 | 0.09NS | 0.41 | −0.31* | 0.10NS |
| Ni | 0.22 | 0.09NS | 0.09NS | −0.64 | −0.16NS |
| Cu | 0.44 | 0.11NS | 0.16* | −0.25 | 0.26 |
| Zn | −0.07NS | 0.32 | 0.29 | −0.78 | −0.05NS |
| As | 0.41 | 0.03NS | 0.12NS | −0.14NS | 0.29 |
| Hg | NA | 0.08NS | 0.42 | NA | NA |
Statistical significance: *p < 0.05 and **p < 0.01. NS, no significant correlation. NA, no data for analysis.
统计显著性:*p < 0.05,**p < 0.01。NS:无显著相关性。NA:无分析数据。
Soil organic matter content is another important parameter that affects the TE availability and mobility in soil crop systems. Sometimes, the impaction depends on other soil traits, TE types, and crop cultivars.43,61 In the present study, soil organic matter was positively correlated with the total soil Pb, Cu, Zn and Hg concentrations, whereas there were weak and inconsistent correlations between soil organic matter and extractable TE concentrations. TEs bind to soil organic matter, both as complexes in soil solution and organic matter associated with the soil matrix.62 TEs that are complexed by organic matter, either in the soil matrix or soil solution, are less available for plant uptake.54,59 Therefore, in terms of plant uptake, the effect of the higher TE concentrations in the organic matter-rich soils were likely offset by a reduction in plant-availability caused by the organic matter itself.
土壤有机质含量是影响土壤–作物系统中TE有效性和迁移性的另一重要参数,其影响有时取决于其他土壤性质、TE种类和作物品种。43,61本研究中,土壤有机质与土壤Pb、Cu、Zn和Hg全量呈正相关,而与可提取态TE含量之间的相关性较弱且不一致。TE与土壤有机质结合,既可在土壤溶液中形成络合物,也可与土壤基质中的有机质结合。62无论在土壤基质还是土壤溶液中,被有机质络合的TE均较难被植物吸收。54,59因此,就植物吸收而言,富含有机质土壤中较高TE含量的影响很可能被有机质本身导致的植物有效性降低所抵消。
5CONCLUSIONS结论
In general, the current soil TE regulatory guidelines for the safe production of B. parachinensis are conservative and provide decent food chain protection. After comparing the correlation coefficients for the shoot TE concentrations and the total soil and extractable TE concentrations, we suggest that the extractable TE concentrations would provide a better indication of plant uptake than the total concentrations, especially for Cd, Ni and Zn. Dividing the 150 paired vegetable–soil samples into several bands according to the different total and extractable soil TE concentration values, plant concentration was significantly increased only above the highest band value for total soil Cd (1.5 mg kg−1), and the extractable Cd (0.1 mg kg−1), Ni (0.03 mg kg−1) and Zn (0.1 mg kg−1), which would be the thresholds affecting the TE concentration in B. parachinensis. To promote effective soil use for ensuring the safe production of vegetables in China, future research could focus on providing crop-specific guidelines for individual vegetables and developing effective detection methods for soil quality thresholds based on the available TE concentrations. Additionally, as a result of the relatively greater BCF for Zn and TF for Cu, B. parachinensis may be a potential resource of Zn and Cu in the human diet. The present study provides important insights into soil quality measurement and vegetable TE uptake, and indicates that a plant-specific risk analysis accounting for variations in soil factors could be more useful in providing an effective risk-based approach for the safe production of vegetables and the management of TE-contaminated soils.
总体而言,现行针对B. parachinensis安全生产的土壤TE监管标准较为保守,能为食物链提供良好的保护。通过比较地上部TE含量与土壤全量及可提取态TE含量的相关系数,我们认为可提取态TE含量比全量能更好地指示植物吸收,尤其是对于Cd、Ni和Zn。根据不同的土壤TE全量和可提取态含量将150对蔬菜–土壤样品划分为若干区间,仅当土壤全Cd(1.5 mg kg−1)以及可提取态Cd(0.1 mg kg−1)、Ni(0.03 mg kg−1)和Zn(0.1 mg kg−1)超过最高区间值时植物含量才显著升高,这些值即为影响B. parachinensis中TE含量的阈值。为促进土壤的有效利用、确保中国蔬菜的安全生产,未来研究可着重针对单一蔬菜制定特定作物标准,并开发基于有效态TE含量的土壤质量阈值的有效检测方法。此外,由于Zn的BCF和Cu的TF相对较高,B. parachinensis可能成为人类膳食中Zn和Cu的潜在来源。本研究为土壤质量评价和蔬菜TE吸收提供了重要见解,并表明考虑土壤因子变异的植物特异性风险分析,可能更有助于为蔬菜安全生产和TE污染土壤管理提供有效的风险评估方法。
6ACKNOWLEDGEMENTS致谢
This work was supported by the National Natural Science Foundation of China Youth Fund (No. 31800432), the National Key R&D Program of China (No. 2019YFC1605602), the National Overseas Study for Senior Research Scholar, Visiting Scholar and Postdoctoral Program (CSC No. 201808440042), and the Science and Technology Major Project of Guangxi (grant number AA20161002).
本研究得到国家自然科学基金青年基金(No. 31800432)、国家重点研发计划(No. 2019YFC1605602)、国家留学基金高级研究学者、访问学者、博士后项目(CSC No. 201808440042)以及广西科技重大专项(项目编号AA20161002)的资助。
7SUPPORTING INFORMATION支持信息
Supporting information may be found in the online version of this article.
支撑信息见本文在线版本。
8REFERENCES参考文献
1 Fraga CG, Relevance, essentiality and toxicity of trace elements in human health. Mol Aspects Med 26:235–244 (2005).
2 ATSDR T, ATSDR (Agency for Toxic Substances and Disease Registry). PreparedbyClementInternationalCorpundercontract205,88–0608.2017.
3 Setia R, Dhaliwal SS, Singh R, Kumar V, Taneja S, Kukal SS et al., Phytoavailability and human risk assessment of heavy metals in soils and food crops around Sutlej river, India. Chemosphere 263:128321 (2021).
4 Prohaska JR, Impact of copper deficiency in humans. Ann N Y Acad Sci 1314:1–5 (2014).
5 Pandit P, Mangala P, Saini A, Bangotra P, Kumar V, Mehra R et al., Radiological and pollution risk assessments of terrestrial radionuclides and heavy metals in a mineralized zone of the siwalik region (India). Chemosphere 254:126857 (2020).
6 Zhang CM, Zhao WY, Gao AX, Su TT, Wang YK, Zhang YQ et al., How could agronomic biofortification of rice be an alternative strategy with higher cost-effectiveness for human iron and zinc deficiency in China? Food Nutr Bull 39:246–259 (2018).
7 Bi Y, Yang ZY, Pang XH, Duan YF, Lai JQ, Jiang S, Wang J, Zhang HM, The phenomenon of zinc deficiency among children in China aged 3–5 years old. Proceedings of the Nutrition Society, eds Dr Janice E. Drew Rowett, Institute of Nutrition and Health, University of Aberdeen, UK. Cambridge University Press. 10 June 2020.
8 Huang Y, Wang L, Wang W, Li T, He Z and Yang X, Current status of agricultural soil pollution by heavy metals in China: a meta-analysis. Sci Total Environ 651:3034–3042 (2019).
9 Wu ST, Zheng YW, Li XB, Han YX, Qu MH, Ni ZL et al., Risk assessment and prediction for toxic heavy metals in chestnut and growth soil from China. J Sci Food Agric 99:4114–4122 (2019).
10 Li FR, Wen D, Wang FH, Sun FF, Wang X, Du YQ et al., Derivation of soil Pb/cd/as thresholds for safety of vegetable planting: a case study for pakchoi in Guangdong Province, China. J Integr Agric 18:179–189 (2019).
11 Qin GW, Niu ZD, Yu JD, Li ZH, Ma JY and Xiang P, Soil heavy metal pollution and food safety in China: effect, sources and removing technology. Chemosphere 267:129205 (2021).
12 Zeng LP, Zhou F, Zhang XC, Qin JH and Li HS, Distribution of heavy metals in soils and vegetables and health risk assessment in the vicinity of three contaminated sites in Guangdong Province, China. Hum Ecol Risk Assess 24:1901–1915 (2018).
13 Chen SB, Wang M, Li SS, Zhao ZQ and Wen-di E, Overview on current criteria for heavy metals and its hint for the revision of soil environmental quality standards in China. J Integr Agric 17:765–774 (2018).
14 Rai PK, Lee SS, Zhang M, Tsang YF and Kim KH, Heavy metals in food crops: health risks, fate, mechanisms, and management. Environ Int 125:365–385 (2019).
15 Moreno JL, Bastida F, Ros M, Hernández T and García C, Soil organic carbon buffers heavy metal contamination on semiarid soils: effects of different metal threshold levels on soil microbial activity. Eur J Soil Biol 45:220–228 (2009).
16 Jennings AA, Analysis of worldwide regulatory guidance values for the most commonly regulated elemental surface soil contamination. J Environ Manage 118:72–95 (2013).
17 Hu WY, Huang B, Borggaard OK, Ye M, Tian K, Zhang HD et al., Soil threshold values for cadmium based on paired soil-vegetable content analyses of greenhouse vegetable production systems in China: implications for safe food production. Environ Pollut 241: 922–929 (2018).
18 Xiao WD, Ye XZ, Zhang Q, Chen D, Hu J and Gao N, Evaluation of cadmium transfer from soil to leafy vegetables: influencing factors, transfer models, and indication of soil threshold contents. Ecotoxicol Environ Saf 164:355–362 (2018).
19 Wu JH, Song QM, Zhou JY, Wu YX, Liu XW, Liu JJ et al., Cadmium threshold for acidic and multi-metal contaminated soil according to Oryza sativa L. cadmium accumulation: influential factors and prediction model. Ecotoxicol Environ Saf 208:111420 (2021).
20 Wang P, Chen H, Kopittke PM and Zhao FJ, Cadmium contamination in agricultural soils of China and the impact on food safety. Environ Pollut 249:1038–1048 (2019).
21 Akram W, Ahmad A, Guo JX, Yasin NA, Akbar M, Luo WL et al., Occurrence of head rot disease caused by Fusarium verticillioides on Chinese flowering cabbage (Brassica rapa L subsp. parachinensis) in China. Crop Protect 134:105180 (2020).
22 Zhao HM, Du H, Xiang L, Chen YL, Lu LA, Li YW et al., Variations in phthalate ester (PAE) accumulation and their formation mechanism in Chinese flowering cabbage (Brassica parachinensis L.) cultivars grown on PAE-contaminated soils. Environ Pollut 206:95–103 (2015).
23 Chang CY, Yu HY, Chen JJ, Li FB, Zhang HH and Liu CP, Accumulation of heavy metals in leaf vegetables from agricultural soils and
associated potential health risks in the Pearl River Delta, South China. Environ Monit Assess 186:1547–1560 (2014).
24 Li Q, Cai S, Mo C, Chu B, Peng LH and Yang FB, Toxic effects of heavy metals and their accumulation in vegetables grown in a saline soil. Ecotoxicol Environ Saf 73:84–88 (2010).
25 Zu YQ, Li Y, Bock L, Schvartz C and Colinet G, Soil effects on the cd and Zn contents of Chinese cabbage in Yunnan Province, China. Arch Agron Soil Sci 56:107–117 (2010).
26 Wissuwa M, Ismail AM and Graham RD, Rice grain zinc concentrations as affected by genotype, native soil-zinc availability, and zinc fertilization. Plant and Soil 306:37–48 (2008).
27 Mourato M, Moreira I, Leitão I, Pinto F, Sales J and Martins L, Effect of heavy metals in plants of the genus Brassica. Int J Mol Sci 16: 17975–17998 (2015).
28 Zhang MK, Liu ZY and Wang H, Use of single extraction methods to predict bioavailability of heavy metals in polluted soils to rice. Commun Soil Sci Plant Anal 41:820–831 (2010).
29 Dai YC, Nasir M, Zhang YL, Wu HM, Guo HH and Lv JL, Comparison of DGT with traditional methods for assessing cadmium bioavailability to Brassica chinensis in different soils. Sci Rep 14206:1–9 (2017).
30 Sun FF, Wang FH, Wang X, He W, Wen D, Wang QF et al., Soil threshold values of total and available cadmium for vegetable growing based on field data in Guangdong Province, South China. J Sci Food Agric 93:1967–1973 (2013).
31 Tian K, Xing Z, Liu GM, Wang HF, Jia MM, Hu WY et al., Cadmium phytoavailability under greenhouse vegetable production system measured by diffusive gradients in thin films (DGT) and its implications for the soil threshold. Environ Pollut 241:412–421 (2018).
32 Huang CQ, Zhao W, Liu F, Tan WF and Koopal LK, Environmental significance of mineral weathering and pedogenesis of loess on the southernmost loess plateau, China. Geoderma 163:219–226 (2011).
33 Wen D, Yan D, Zhao PH, Li L and Du RY, Fast determination of 14 elements in China soil pollution survey with high throughput full digestion method by ICPMS. Environ Chem 37:1432–1435 (2018).
34 Kandziora-Ciupa M, Ciepal R and Nadgórska-Socha A, Assessment of heavy metals contamination and enzymatic activity in pine forest soils under different levels of anthropogenic stress. Pol J Environ Stud 25:1045–1051 (2016).
35 Hu YA, Liu XP, Bai JM, Shih KM, Zeng EY and Cheng HF, Assessing heavy metal pollution in the surface soils of a region that had undergone three decades of intense industrialization and urbanization. Environ Sci Pollut Res 20:6150–6159 (2013).
36 National Environmental Protection Agency of China, 2018. Soil environmental quality: Risk control standard for soil contamination of agricultural land (GB 15618–2018).
37 National Health Agency of China, 2017. Maximum Levels of Contaminants in Foods (GB 2762–2017).
38 Wang YT and Björn LO, Heavy metal pollution in Guangdong Province, China, and the strategies to manage the situation. Front Environ Sci 2:9 (2014).
39 Wang Y, Shen H, Zhu XW, Li C, Zhang W, Xie Y et al., Transport, ultrastructural localization, and distribution of chemical forms of lead in radish (Raphanus sativus L.). Front Plant Sci 6:1–13 (2015).
40 Liang H, Wu WL, Zhang YH, Zhou SJ, Long CY, Wen J et al., Levels, temporal trend and health risk assessment of five heavy metals in fresh vegetables marketed in Guangdong Province of China during 2014–2017. Food Control 92:107–120 (2018).
41 Genchi G, Sinicropi MS, Carocci A, Lauria G and Catalano A, Mercury exposure and heart diseases. Int J Environ Res Public Health 14:733 (2017).
42 KhanamR, Kumar A, Nayak AK, Shahid M, Tripathi R, Vijayakumar S et al., Metal(loid)s (as, hg, se, Pb and cd) in paddy soil: bioavailability and potential risk to human health. Sci Total Environ 699:134330 (2020).
43 Rafiq MT, Aziz R, Yang X, Xiao W, Stoffella PJ, Saghir A et al., Phytoavailability of cadmium (cd) to Pak Choi (Brassica chinensis L.) grown in
Chinese soils: a model to evaluate the impact of soil cd pollution on potential dietary toxicity. PLoS One 9:1–9 (2014).
44 Yang Y, Chen WP, Wang ME and Peng C, Regional accumulation characteristics of cadmium in vegetables: influencing factors, transfer model and indication of soil threshold content. Environ Pollut 219: 1036–1043 (2016).
45 Kim YY, Yang YY and Lee Y, Pb and cd uptake in rice roots. Physiol Plant 116:368–372 (2002).
46 Fu XZ, Zhou X, Xing F, Ling LL and Peng LZ, Genome-wide identification, cloning and functional analysis of the zinc/iron-regulated transporter-like protein ZIP gene family in trifoliate orange (Poncirus trifoliata L. Raf.). Front Plant Sci 19:588–589 (2017).
47 Li QS, Chen Y, Fu HB, Cui ZH, Shi L, Wang LL et al., Health risk of heavy metals in food crops grown on reclaimed tidal flat soil in the Pearl River estuary, China. J Hazard Mater 227–228:148–154 (2012).
48 Kisa D, Öztürk L, Doker S and Gökçe İ, Expression analysis of metallothioneins and mineral contents in tomato (Lycopersicon esculentum) under heavy metal stress. J Sci Food Agric 97:1916–1923 (2017). 49 Stein AJ, Global impacts of human mineral malnutrition. Plant Soil 335: 133–154 (2010).
50 Yuan L, Wu LH, Yang CL and Lv Q, Effects of iron and zinc foliar applications on rice plants and their grain accumulation and grain nutritional quality. J Sci Food Agric 93:254–261 (2013).
51 Li X, Zhang J, Gong Y, Liu Q, Yang S, Ma J et al., Status of copper accumulation in agricultural soils across China (1985–2016). Chemosphere 244:125516 (2020).
52 Chen HY, Yuan XY, Li TY, Hu S, Ji JF and Wang C, Characteristics of heavy metal transfer and their influencing factors in different soil– crop systems of the industrialization region, China. Ecotoxicol Environ Saf 126:193–201 (2016).
53 Yang Y, Chen WP, Wang ME, Li YL and Peng C, Evaluating the potential health risk of toxic trace elements in vegetables: accounting for variations in soil factors. Sci Total Environ 584–585:942–949 (2017).
54 Zhang S, Song J, Cheng YW, Christie P, Long J and Liu LF, Derivation of reliable empirical models describing lead transfer from metalpolluted soils to radish (Raphanus sativa L.): determining factors and soil criteria. Sci Total Environ 613–614:72–80 (2018).
55 DingCF,LiXG,ZhangTL,MaYBandWangXX,Phytotoxicityandaccumulationofchromiumincarrotplantsandthederivationofsoilthresholds for Chinese soils. Ecotoxicol Environ Saf 108:179–186 (2014). 56 Smolders E, Oorts K, Sprang PV, Schoeters I, Janssen CR, McGrath SP et al., Toxicity of trace metals in soil as affected by soil type and aging after contamination: using calibrated bioavailability models to set ecological soil standards. Environ Toxicol Chem 28: 1633–1642 (2009). 57 Xu QT and Zhang MK, Source identification and exchangeability of heavy metals accumulated in vegetable soils in the coastal plain of eastern Zhejiang province, China. Ecotoxicol Environ Saf 142: 410–416 (2017).
58 Peng M, Zhao C, Ma H, Yang Z, Yang K, Liu F et al., Heavy metal and Pb isotopic compositions of soil and maize from a major agricultural area in Northeast China: contamination assessment and source apportionment. J Geochem Explorat 208:106403 (2020).
59 Song NN, Wang FL, Ma YB and Tang SR, Using DGT to assess cadmium bioavailability to ryegrass as influenced by soil properties. Pedosphere 25:825–833 (2015).
60 Ding CF, Ma YB, Li XG, Zhang TL and Wang XG, Derivation of soil thresholds for lead applying species sensitivity distribution: a case study for root vegetables. J Hazard Mater 303:21–27 (2016).
61 Liu P, Ptacek CJ and Blowes DW, Mercury complexation with dissolved organic matter released from thirty-six types of biochar. Bull Environ Contam Toxicol 103:1–6 (2018).
62 Robinson BH, Bañuelos G, Conesa HM, Evangelou MWH and Schulin R, The phytomanagement of trace elements in soil. Crit Rev Plant Sci 28:240–266 (2009).