Contents lists available at ScienceDirect journal homepage: www.elsevier.com/locate/geoderma
Soil hydrothermal modeling in a dry alpine agricultural zone: The effect of soil airflow
Jiaxin Wang a,c, Xiaodong Gao a,b,c,*, Xining Zhao a,b,c, Hua Wan a,c, Yijian Zeng d, Lianyu Yu d, Brett Robinson e, Yanqing Zhou a,c, Kadambot H.M. Siddique f, Pute Wu a,c
a College of Water Resources and Architectural Engineering, Northwest A&F University, Yangling 712100, China b Institute of Soil and Water Conservation, Northwest A&F University, Yangling 712100, China c Institute of Water-saving Agriculture in Arid Areas of China, Northwest A&F University, Yangling 712100, China d Faculty of Geo-information and Earth Observation (ITC), University of Twente, Enschede, Netherlands e Department of Soil and Physical Sciences, Lincoln University, Lincoln 7647, Christchurch, New Zealand f The UWA Institute of Agriculture, The University of Western Australia, Crawley WA 6009, Australia
a 西北农林科技大学水利与建筑工程学院,杨凌 712100,中国 b 西北农林科技大学水土保持研究所,杨凌 712100,中国 c 西北农林科技大学中国旱区节水农业研究院,杨凌 712100,中国 d 特文特大学地理信息科学与地球观测学院(ITC),恩斯赫德,荷兰 e 林肯大学土壤与物理科学系,林肯 7647,基督城,新西兰 f 西澳大学农业研究所,Crawley WA 6009,澳大利亚
A R T I C L E I N F O A B S T R A C T Handling Editor: Morgan Cristine Acquiring soil hydrothermal information using process-based models is important for agricultural management in dry alpine regions where in situ data collection is difficult. However, few modeling studies have considered the Keywords: soil airflow transport mechanism for arid regions especially, the presence of dry airflow in soil can affect water Hydrothermal dynamics and heat transport. Here, we adopt an airflow-coupling hydrological model, Simultaneous Transfer of Energy, Soil airflow Mass, and Momentum in Unsaturated Soil (STEMMUS), to simulate soil hydrothermal processes and evapo- Arid agricultural region Tibetan Plateau transpiration dynamics in a dry farmland on the Tibetan Plateau (TP). The effect of airflow on the simulations was carefully assessed. Our results suggested that STEMMUS can reliably capture daily observations—the average values for the index of agreement (d) in the 20–100 cm soil profile were 0.94 for soil temperature, 0.83 for soil moisture, 0.72 for soil evaporation and 0.83 for crop evapotranspiration, respectively, during the validation period. The impacts of considering airflow transport occurred when water inputs reached 22.8 mm, showing a positive relationship with increasing precipitation/irrigation. Incorporating airflow in the model showed minor differences but basically improved the modeling precision for soil moisture (reduction in root mean squared error (RMSE) values ranging from 0 to 95.9%), evapotranspiration (reduction in RMSE values ranging from 0 to 97.8%) and evaporation (reduction in RMSE values ranging from 0 to 99.3%) following rainfall/irrigation events. These findings provide sights into the role of airflow in the complex soil physical processes, and highlight that rainfall/irrigation inputs are a major factor affecting simulations when airflow is considered.
文章信息 摘要 责任编辑:Morgan Cristine 关键词:水热动态;土壤气流;干旱农业区;青藏高原。在难以开展原位数据采集的干旱高寒地区,利用基于过程的模型获取土壤水热信息对农业管理具有重要意义。然而,很少有模拟研究考虑土壤气流运移机制,尤其是在干旱地区,土壤中干空气流的存在会影响水分与热量的运移。本研究采用耦合气流的水文模型——非饱和土壤能量、质量与动量同步传输模型(STEMMUS),模拟了青藏高原(TP)一块旱作农田的土壤水热过程及蒸散动态,并细致评估了气流对模拟结果的影响。结果表明,STEMMUS能够可靠地捕捉逐日观测值:验证期内,20–100 cm土壤剖面土壤温度、土壤水分、土壤蒸发和作物蒸散的一致性指数(d)平均值分别为0.94、0.83、0.72和0.83。当水分输入达到22.8 mm时,考虑气流运移的影响开始显现,且随降水/灌溉量增加呈正相关关系。在降雨/灌溉事件之后,模型中纳入气流虽差异较小,但总体上提高了土壤水分(均方根误差(RMSE)降低0~95.9%)、蒸散(RMSE降低0~97.8%)和蒸发(RMSE降低0~99.3%)的模拟精度。上述结果有助于深入认识气流在复杂土壤物理过程中的作用,并表明在考虑气流时,降雨/灌溉输入是影响模拟结果的主要因素。
1Introduction引言
The Tibetan Plateau (TP), also known as the third pole of the earth (Qiu, 2008), plays a principal role in Asian hydrological cycles (Pan et al., 2018; Ding et al., 2019). In past decades, the subsistence of TP inhabitants has largely relied on farming and animal husbandry. However, due to extensive grassland degradation reported on the TP (Harris, 2010; Yao et al., 2016; Liu et al., 2018a; Liu et al., 2018b; Ren et al., 2019), which was partly caused by overgrazing (Miehe et al., 2019), a need to promote alpine agriculture has been prioritized to enable development while avoiding ecological deterioration (Zhang et al., 2013; d’Alpoim Guedes et al., 2013; d’Alpoim Guedes et al., 2015; d’Alpoim Guedes, 2018; Wang et al., 2020). Nevertheless, a major problem is that part of the agricultural land on the TP is located in arid and semiarid zones, where soil water availability and soil temperature are key variables controlling agricultural productivity (Wang et al., 2020). Understanding spatiotemporal variation of these fundamental hydrothermal properties (i.e., soil moisture, soil temperature and evapotranspiration) plays an important role in ensuring local agricultural productivity.
青藏高原(TP)又被称为地球“第三极”(Qiu, 2008),在亚洲水文循环中发挥着重要作用(Pan et al., 2018; Ding et al., 2019)。过去数十年间,青藏高原居民的生计在很大程度上依赖于农耕与畜牧业。然而,据报道青藏高原草地退化广泛(Harris, 2010; Yao et al., 2016; Liu et al., 2018a; Liu et al., 2018b; Ren et al., 2019),其部分原因在于过度放牧(Miehe et al., 2019),因此发展高寒农业已被列为优先事项,以期在避免生态恶化的同时促进发展(Zhang et al., 2013; d’Alpoim Guedes et al., 2013; d’Alpoim Guedes et al., 2015; d’Alpoim Guedes, 2018; Wang et al., 2020)。但一个主要问题是,青藏高原部分农业用地位于干旱和半干旱区,土壤水分有效性和土壤温度是控制该区农业生产力的关键变量(Wang et al., 2020)。认识这些基本水热特性(即土壤水分、土壤温度和蒸散)的时空变化,对保障当地农业生产力具有重要作用。
Modeling can be a better choice over in situ observations for understanding soil hydrothermal dynamics in the TP agricultural regions, considering the high costs of equipment transportation and labor and the high risk of decreased oxygen in the air. Models of relevant processes are generally established based on validated physical equations, such as Richards’ equation (de Rooij, 2010), which has been applied commonly to describe soil water flow transport (Massari et al., 2014; Weber et al., 2017; Ahmad et al., 2018; Liu et al., 2018; Hu et al., 2019; Sadeghi et al., 2019), and many models now popularly used are developed based on this equation, such as the HYDRUS model (Simˇ ůnek and van Genuchten, 2008) and Simultaneous Heat and Water (SHAW) model (Flerchinger and Saxton, 1989). So far, sophisticated characteristics have been incorporated into these models, for examples, crop water use, soil layer features, or surface coverage (Hou et al., 2018; Di Prima et al., 2019; Kacimov et al., 2019; Kader et al., 2019). However, although several studies had endeavored to explain the necessity of airflow in soil moisture modeling (Schrefler and Zhan, 1993; Parlange et al., 1998; Zeng et al., 2011a), little attention has been paid to the effect of soil dry airflow on modeling results.
考虑到设备运输和人工成本高昂以及空气含氧量低带来的高风险,在青藏高原农业区,模型模拟相较于原位观测是认识土壤水热动态的更好选择。相关过程模型通常基于经过验证的物理方程建立,例如Richards方程(de Rooij, 2010),该方程已被广泛用于描述土壤水分运移(Massari et al., 2014; Weber et al., 2017; Ahmad et al., 2018; Liu et al., 2018; Hu et al., 2019; Sadeghi et al., 2019),目前许多常用模型均基于该方程开发,如HYDRUS模型(Simˇ ůnek and van Genuchten, 2008)和水热同步(SHAW)模型(Flerchinger and Saxton, 1989)。迄今为止,这些模型已纳入了较为复杂的特征,例如作物用水、土层特征或地表覆盖(Hou et al., 2018; Di Prima et al., 2019; Kacimov et al., 2019; Kader et al., 2019)。然而,尽管已有若干研究尝试阐明在土壤水分模拟中考虑气流的必要性(Schrefler and Zhan, 1993; Parlange et al., 1998; Zeng et al., 2011a),但土壤干空气流对模拟结果的影响仍很少受到关注。
* Corresponding author at: Institute of Soil and Water Conservation, Northwest A&F University, Yangling 712100, China. E-mail address: gao_xiaodong@nwafu.edu.cn (X. Gao).
https://doi.org/10.1016/j.geoderma.2021.115354 Received 23 February 2021; Received in revised form 12 July 2021; Accepted 17 July 2021 Available online 28 July 2021 0016-7061/© 2021 Elsevier B.V. All rights reserved.
https://doi.org/10.1016/j.geoderma.2021.115354 收稿日期:2021年2月23日;修回日期:2021年7月12日;录用日期:2021年7月17日;在线发表日期:2021年7月28日 0016-7061/© 2021 Elsevier B.V. 保留所有权利。
The impact of airflow induced by atmospheric pressure variation on soil - atmosphere gas exchange has been a topic of discussion since Buckingham (1904) described air movement in soil in response to atmospheric pressure. This might be particularly important in arid regions because soil gas fluxes (vapor/dry air) account for a relatively higher proportion of soil porosity than liquid water flow in the vadose (unsaturated) zone, and previous studies have suggested that soil vapor transport is partly driven by the soil - air pressure gradient (Olivella and Gens 2000; Zeng et al., 2011a). Numerous experiments have shown that vapor flow plays an important role in mass and energy transfers in dry soils (Milly, 1982; Scanlon and Milly, 1994; Cahill and Parlange, 1998; Grifoll et al., 2005; Saito et al., 2006; Bittelli et al., 2008; Zeng et al., 2009, 2011a; Zeng et al., 2011b; Garcia Gonzalez et al., 2012; Zeng and Su, 2013), but the magnitude of vapor flow calculated by existing mechanisms is underestimated (Parlange et al., 1998; Zeng et al., 2011a; Zeng et al., 2011b). Considering the coupling of dry airflow may be the key to solving this problem (Schrefler and Zhan, 1993; Parlange et al., 1998; Zeng et al., 2011a). Zeng et al. (2011a) conducted a short-term experiment in the Badain Jaran Desert to investigate the impact of soil dry airflow on soil evaporative flux; the results indicated the advective vapor transfer was weakened if the airflow was neglected, leading to an underestimation error of 33–53%, and the authors suggested more analysis should be conducted with a wider range of soil wetness, soil materials and weather conditions (Zeng et al., 2011b). However, the impact of soil dry airflow on modeling are not fully understood (i.e., its impact on soil heat or water movement), even though there are an increasing number of studies showing the possible need to account for the effects of airflow on soil water and heat transport (Touma and Vauclin, 1986; Schrefler and Zhan, 1993; Prunty and Bell, 2007; Wicky and Hauck, 2017; Yamasaki et al., 2017; Yu et al., 2018; Gao et al., 2020).
自Buckingham(1904)描述了土壤中空气随大气压力变化而运动以来,由大气压力变化引起的气流对土壤–大气气体交换的影响一直是讨论的话题。这在干旱地区可能尤为重要,因为在包气带(非饱和带)中,土壤气体通量(水汽/干空气)所占土壤孔隙的比例相对高于液态水流,且已有研究表明土壤水汽运移部分受土壤–空气压力梯度驱动(Olivella and Gens 2000; Zeng et al., 2011a)。大量试验表明,水汽流在干燥土壤的质量与能量传输中发挥着重要作用(Milly, 1982; Scanlon and Milly, 1994; Cahill and Parlange, 1998; Grifoll et al., 2005; Saito et al., 2006; Bittelli et al., 2008; Zeng et al., 2009, 2011a; Zeng et al., 2011b; Garcia Gonzalez et al., 2012; Zeng and Su, 2013),但由现有机制计算得到的水汽流量级被低估(Parlange et al., 1998; Zeng et al., 2011a; Zeng et al., 2011b)。考虑干空气流的耦合可能是解决这一问题的关键(Schrefler and Zhan, 1993; Parlange et al., 1998; Zeng et al., 2011a)。Zeng et al.(2011a)在巴丹吉林沙漠开展了短期试验,研究土壤干空气流对土壤蒸发通量的影响;结果表明,若忽略气流,平流水汽传输会被削弱,导致33–53%的低估误差,作者建议应在更宽的土壤湿度、土壤材料和天气条件范围内开展更多分析(Zeng et al., 2011b)。然而,尽管越来越多的研究表明可能需要考虑气流对土壤水热运移的影响(Touma and Vauclin, 1986; Schrefler and Zhan, 1993; Prunty and Bell, 2007; Wicky and Hauck, 2017; Yamasaki et al., 2017; Yu et al., 2018; Gao et al., 2020),土壤干空气流对模拟的影响(即其对土壤热量或水分运动的影响)仍未得到充分认识。
In most soil heat and mass balance modeling studies, airflow is implicitly treated as an inert gas. Nevertheless, this assumption is not always valid as soil air can cause convective heat transfer (Wicky and Hauck, 2017), and influence soil water flow in some cases; for instance, inducing liquid/vapor water flow accumulating to the freezing front in frozen soil (Yu et al., 2018). Besides, heavy rainfall or irrigation often entraps air in the soil, which retards infiltration (Linden and Dixon, 1975) and therefore affects the wetting front (Wang et al., 1998; Zeng et al., 2011a; Yang et al., 2021). Thus, it is necessary to compare soil heat and mass transport modeling results considering the soil air flux transport mechanism.
在大多数土壤热量与质量平衡模拟研究中,气流被隐含地视为惰性气体。然而,这一假设并非总是成立,因为土壤空气可引起对流换热(Wicky and Hauck, 2017),并在某些情况下影响土壤水分运动,例如在冻土中诱发液态/气态水流向冻结锋面聚集(Yu et al., 2018)。此外,强降雨或灌溉常使空气被封闭于土壤中,从而阻滞入渗(Linden and Dixon, 1975),进而影响湿润锋(Wang et al., 1998; Zeng et al., 2011a; Yang et al., 2021)。因此,有必要比较考虑土壤空气通量运移机制时的土壤热量与质量运移模拟结果。
The Simultaneous Transfer of Energy, Mass and Momentum in Unsaturated Soil (STEMMUS) model simulates one-dimensional unsaturated soil hydrothermal transport and crop evapotranspiration dynamics using MATLAB code (Zeng et al., 2011a; Zeng et al., 2011b; Zeng and Su, 2013; Yu et al., 2016); however, it is still in development so its application remains limited. The advantage of STEMMUS is that it considers soil airflow transport mechanism and regards soil airflow as a single phase in soil water and heat transport. The STEMMUS model has not been tested in dry alpine agricultural lands.
非饱和土壤能量、质量与动量同步传输(STEMMUS)模型采用MATLAB代码模拟一维非饱和土壤水热运移及作物蒸散动态(Zeng et al., 2011a; Zeng et al., 2011b; Zeng and Su, 2013; Yu et al., 2016);但该模型仍在开发中,其应用仍较有限。STEMMUS的优势在于考虑了土壤气流运移机制,并将土壤气流视为土壤水热运移中的单独一相。STEMMUS模型尚未在干旱高寒农业用地中得到检验。
According to the census, the northeastern TP has the largest Lycium barbarum L. (also known as Tibetan or Himalayan goji, or Chinese wolfberry) planting area in China (45,000 hm2in 2018). The Lycium barbarum L. industry is one of the most important ecological and inhabitants’ livelihood projects, but its growth is limited by water shortage. To provide support for the local agricultural administration, we conducted a numerical simulation in a dry irrigated farmland of the Qaidam Basin, in soils with high gravel and sand contents (Wang et al., 2020) and a thick vadose zone, which we expected to be suitable for adopting an airflow-coupled soil hydrothermal process simulation. The study aimed to: (i) evaluate the performance of the airflow-coupled model for simulating soil moisture, temperature, surface evaporation, and evapotranspiration in dry alpine agricultural land, and (ii) quantify the impacts of incorporating the airflow transport mechanism on soil moisture, temperature, surface evaporation, and evapotranspiration transport.
据统计,青藏高原东北部是中国Lycium barbarum L.(又称西藏或喜马拉雅枸杞,或宁夏枸杞)种植面积最大的地区(2018年为45,000 hm2)。Lycium barbarum L.产业是最重要的生态与民生工程之一,但其发展受到水资源短缺的限制。为给当地农业管理部门提供支撑,我们在柴达木盆地的一块干旱灌溉农田开展了数值模拟,该地土壤砾石和砂粒含量高(Wang et al., 2020)且包气带深厚,预计适合采用耦合气流的土壤水热过程模拟。本研究旨在:(i)评估耦合气流模型在干旱高寒农业用地中模拟土壤水分、温度、地表蒸发和蒸散的性能;(ii)量化纳入气流运移机制对土壤水分、温度、地表蒸发和蒸散运移模拟的影响。
2Materials and methods材料与方法
2.1. Site description2.1. 研究区概况
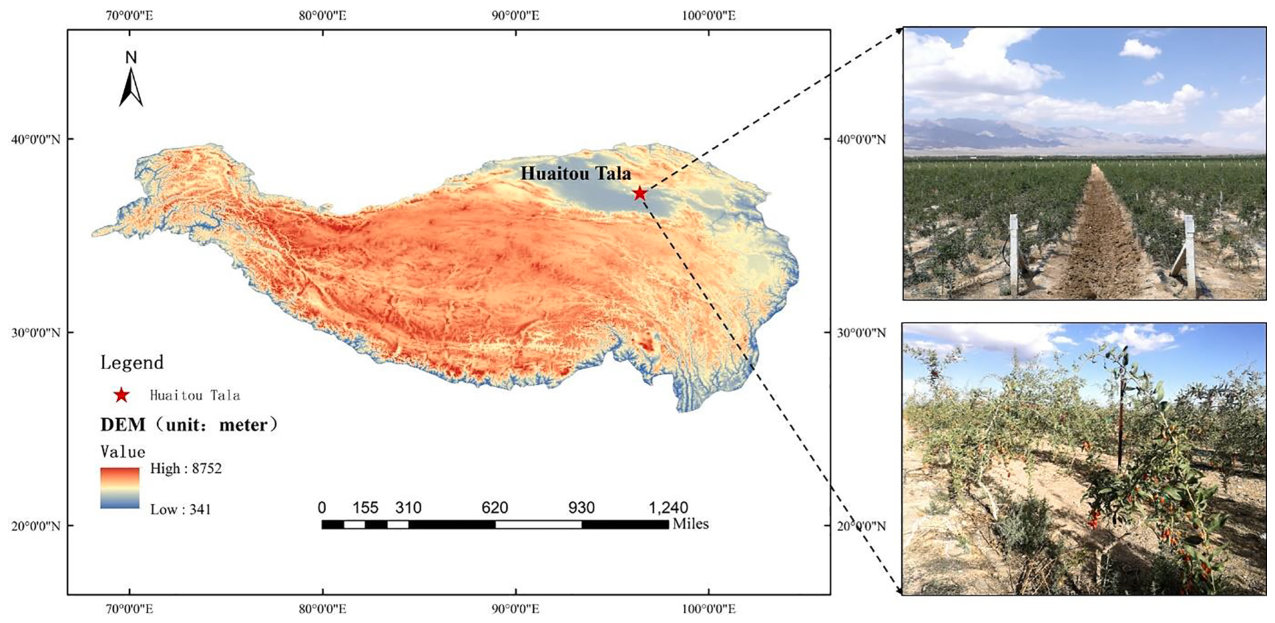
This study was conducted in the Huaitou Tala Irrigation Region (96◦44′ E, 37◦21′ N; 2869 m a. s. l.), a reclaimed area of the Gobi Desert in the northeast of the Qaidam Basin on the TP (Fig. 1). The duration of sunshine is approximately 10 h per day. The average annual precipitation is about 200 mm, concentrated from June to September, and the average annual soil surface temperature (1981–2016) is 4.5 ◦C. The irrigation water comes from nearby reservoirs and wells, and the underground water table exceeded 90 m when surveyed in 2019. The soil at the location is sandy gravel from 0 − 100 cm, comprising about 82% sand (particle diameter 0.02–2 mm), 10% silt (particle diameter 0.002–0.02 mm), and 8% clay (particle diameter < 0.002 mm) (Table 1). Table 1 also shows other physical characteristics of undisturbed soil samples from 0 to 100 cm at this site.
本研究在怀头他拉灌区(96◦44′ E, 37◦21′ N;海拔2869 m)开展,该区为青藏高原柴达木盆地东北部戈壁荒漠的垦区(图1)。日照时数约为每天10 h。多年平均降水量约200 mm,集中于6–9月,多年(1981–2016)平均地表温度为4.5 ◦C。灌溉水来自附近水库和水井,2019年调查时地下水位埋深超过90 m。该地0 − 100 cm土壤为砂砾质,约含82%砂粒(粒径0.02–2 mm)、10%粉粒(粒径0.002–0.02 mm)和8%黏粒(粒径< 0.002 mm)(表1)。表1还列出了该地0–100 cm原状土样的其他物理特性。
The common cultivation practice in this site is unmulched flat planting. In response to China’s poverty alleviation project, and to prevent wind and sand fixation, more than 2,900 ha of local area are planted to Lycium barbarum L. due to its property of drought and cold resistance. This species has become the main local cash crop. Hence this study chose the Lycium barbarum L. as the objective. At the start of the experiment, the plants were four years old, on average, with a mean height of 1 m.
该地常见的栽培方式为无覆膜平作。为响应中国扶贫工程并防风固沙,因Lycium barbarum L.具有抗旱耐寒特性,当地种植面积已超过2,900 ha。该物种已成为当地主要经济作物,因此本研究以Lycium barbarum L.为研究对象。试验开始时,植株平均树龄为4年,平均株高1 m。
2.2. Observations2.2. 观测
This study was conducted from 28 May to 28 September 2018 and 2019 in accordance with Lycium barbarum L. growth period. Before commencing the experiment, undisturbed soil samples were collected to determine soil physical properties. Soil dry bulk density was measured using the ring knife method (Bao, 2000), saturated water content was determined via the oven drying method after saturating the soil samples for 24 h, and saturated hydraulic conductivity was measured via the double-ring infiltration method (Bao, 2000).
本研究依据Lycium barbarum L.的生育期,于2018年和2019年的5月28日至9月28日开展。试验开始前采集原状土样测定土壤物理性质。土壤干容重采用环刀法测定(Bao, 2000),饱和含水量采用土样饱和24 h后烘干法测定,饱和导水率采用双环入渗法测定(Bao, 2000)。
According to Zhang et al. (2016), the depth of the root zone of L. barbarum is about 60 cm. Thus, 5TM soil moisture and temperature sensors (Meter group, USA) were installed to record hourly root- zone soil volumetric water content and temperature at depths of 20, 40, 60, 80, and 100 cm with three replications. The daily evaporation rate (E) was averaged from nine replications measured via micro-lysimeters (20 cm long × 12 cm wide, PVC tubes) at 17:00 every day using a portable electronic balance (0.1 g resolution); changes in the weight of the lysimeters were taken as equivalent to the amount of water evaporated from the soil surface. Evapotranspiration (ET) was averaged from two replications via lysimeter weighting systems (60 cm long × 40 cm wide, 50 g resolution), located adjacent to the field. The variety and tree-age of L. barbarum transplanted into lysimeters were the same as the field plants, with a similar growth status. The taproot length at transplantation was approximately 20 cm. During the growing period, ET was automatically monitored hourly and summed to daily values. The lysimeter system contained a weighing facility, filter layer (filled with stone), and outfall at the bottom of each lysimeter. During the two-year experiment, no seepage was recorded. Hourly air temperature, precipitation, relative humidity, and wind speed at 2 m height were recorded with an automatic weather station (Meter group, USA) placed in the study area.
根据Zhang et al.(2016),L. barbarum根区深度约为60 cm。因此,安装了5TM土壤水分与温度传感器(Meter group,美国),逐时记录20、40、60、80和100 cm深度的根区土壤体积含水量和温度,设3次重复。日蒸发速率(E)取9个重复的平均值,采用微型渗漏计(长20 cm × 宽12 cm,PVC管)于每日17:00用便携式电子天平(精度0.1 g)称量;渗漏计重量变化视为土壤表面的蒸发水量。蒸散(ET)取紧邻田块的2套称重式渗漏计系统(长60 cm × 宽40 cm,精度50 g)的平均值。移栽入渗漏计的L. barbarum品种和树龄与田间植株相同,生长状况相近。移栽时主根长度约20 cm。生育期内ET每小时自动监测一次并累加为日值。渗漏计系统包括称重装置、过滤层(填充石块)以及位于每个渗漏计底部的排水口。两年试验期间均未记录到渗漏。2 m高度的逐时气温、降水、相对湿度和风速由布设于研究区的自动气象站(Meter group,美国)记录。
Soil properties in the 0–100 cm soil layer at the experimental site.
试验站点0–100 cm土层的土壤性质。
| Layer土层 | Sand砂粒 | Silt粉粒 | Clay黏粒 | Bulk density容重 | θs | Ks | cw cacw ca | cq | cc | co |
|---|---|---|---|---|---|---|---|---|---|---|
| cm | % | % | % | g cm−3 | cm3cm−3 | mm min−1 | J g−1 K−1 | |||
| 0–100 | 82 | 10 | 8 | 1.52 | 0.41 | 0.83 | 4.18 1.01 | 0.80 | 0.90 | 1.92 |
Note: cw, ca, cq, cc, co are specific heat capacities for water, air, quartz, clay and organic matter (De Vries, 1963). θs and Ks are saturated water content and saturated hydraulic conductivity, respectively.
注:cw、ca、cq、cc、co分别为水、空气、石英、黏土和有机质的比热容(De Vries, 1963)。θs和Ks分别为饱和含水量和饱和导水率。
For each growing season, plant height was measured with a tape measure and leaf area index (LAI) was measured using an LAI-2200C Plant Canopy Analyzer (Meter Group, USA). Stomatal conductance was measured monthly with an LI-6400 instrument (Meter Group, USA) between 9 and 11 am on sunny days. Daily LAI, plant height and stomatal conductance values were linearly interpolated from the observations and used to calculate crop evapotranspiration (Allen et al., 1998).
在每个生长季,株高用卷尺测量,叶面积指数(LAI)用LAI-2200C植物冠层分析仪(Meter Group,美国)测定。气孔导度每月于晴天上午9–11时用LI-6400仪器(Meter Group,美国)测定一次。逐日LAI、株高和气孔导度由观测值线性插值得到,用于计算作物蒸散(Allen et al., 1998)。
Surface drip irrigation was applied six times a year—about 13.4 (2018) and 25.8 mm (2019) on each occasion—with unitive fertilizer nutrients (content of total nitrogen, water-soluble phosphorus, water-soluble potassium ≥ 20%). No surface runoff occurred during the experiment.
每年进行6次地表滴灌,每次灌水量约为13.4 mm(2018年)和25.8 mm(2019年),并随水施用统一的肥料养分(全氮、水溶性磷、水溶性钾含量 ≥ 20%)。试验期间未发生地表径流。
2.3. Model configuration2.3. 模型配置


where t is time (s), ρL and ρV are densities of liquid water and water vapor (kg m− 3), respectively; θL and θV are volumetric water content and water vapor content (m3m− 3), respectively; z is the vertical space coordinate, positive upwards (m); qL and qV are liquid and vapor fluxes, respectively (kg m− 2s− 1); and S is a sink term representing water uptake by plant roots (kg m− 3s− 1). In addition to the existing mechanisms included in Milly’s model, the effect of thermal liquid flux and the dry air phase (i.e., dispersive water vapor flux and water vapor flux as part of the bulk flow of dry air) are considered in STEMMUS (Zeng et al., 2011a).
式中,t为时间(s);ρL和ρV分别为液态水和水汽的密度(kg m− 3);θL和θV分别为体积含水量和水汽含量(m3m− 3);z为垂直空间坐标,向上为正(m);qL和qV分别为液态水通量和水汽通量(kg m− 2s− 1);S为表示植物根系吸水的汇项(kg m− 3s− 1)。除Milly模型中已有的机制外,STEMMUS还考虑了热致液态水通量和干空气相的作用(即弥散水汽通量以及作为干空气整体流动一部分的水汽通量)(Zeng et al., 2011a)。
Heat transport in unsaturated soil includes heat transfer of solids, liquids, vapor flux, and dry air flux, as well as integral heat wetting (De Vries, 1958). As such, the conservation of heat transfer is expressed as: ∂ ∂θL ∂t [(ρsθscs + ρLθLcL + ρdaθaca + ρvθVcv)(T − Tr) + ρVL0θV ] − ρLW ∂t (2) where ρda and ρs are densities of soil dry air and solid (kg m− 3), respectively; θs and θa are volumetric contents of solid and gas in soil (m3 m− 3), respectively; cs, cL, ca, and cv are specific heat capacities (J g− 1 K− 1) of solids, liquids, air, and vapor, respectively; T is soil temperature (◦C); Tr is a reference temperature (℃); L0is volumetric latent heat of vaporization of liquid water (J kg− 1); W is differential heat of wetting (J kg− 1); λeff is effective thermal conductivity (W m− 1℃–1); and qa is soil dry air flux (kg m− 2s− 1).
非饱和土壤中的热量运移包括固体、液体、水汽通量和干空气通量的热传递以及积分湿润热(De Vries, 1958)。因此,热量传输守恒表示为:∂ ∂θL ∂t [(ρsθscs + ρLθLcL + ρdaθaca + ρvθVcv)(T − Tr) + ρVL0θV ] − ρLW ∂t (2) 式中,ρda和ρs分别为土壤干空气和固体的密度(kg m− 3);θs和θa分别为土壤中固体和气体的体积含量(m3 m− 3);cs、cL、ca,和cv分别为固体、液体、空气和水汽的比热容(J g− 1 K− 1);T为土壤温度(◦C);Tr为参考温度(℃);L0为液态水的体积汽化潜热(J kg− 1);W为微分湿润热(J kg− 1);λeff为有效导热率(W m− 1℃–1);qa为土壤干空气通量(kg m− 2s− 1)。

According to the theory of dry airflow proposed by Thomas and Sansom (1995), dry air flux includes both the bulk flow of dry air and air dissolved in liquid, expressed as:
根据Thomas and Sansom(1995)提出的干空气流理论,干空气通量包括干空气的整体流动和溶解于液体中的空气,表示为:

m layer, 5 cm for the 0.2–0.6 m layer, and 10 cm for the 0.6–1.0 m layer. The temporal step was set at 1 h.
m土层为1.5 cm,0.2–0.6 m土层为5 cm,0.6–1.0 m土层为10 cm。时间步长设为1 h。

where η is porosity, SL is degree of saturation of the soil,Sa is degree of air saturation of the soil, Hc is Henry’s constant (set to 0.02), DV is molecular diffusivity of water vapor in soil (m2s− 1), kg is intrinsic air permeability (m2), μa is air viscosity (set to 1.846 × 10⁵kg m− 1s− 1), Pg is pore-air pressure (Pa), and DVg is gas-phase longitudinal dispersion coefficient (m2s− 1). On the right hand side of Eq. (3), the first and third items are expressions of the diffusive and dispersive components of dry air flux based on Fick’s law, respectively; the second item represents the advective flux of dry air calculated by Darcy’s law; and the fourth represents the amount of air that will dissolve in liquid at mechanical and chemical equilibrium (Henry’s law).
式中,η为孔隙度,SL为土壤饱和度,Sa为土壤空气饱和度,Hc为亨利常数(设为0.02),DV为土壤中水汽的分子扩散系数(m2s− 1),kg为固有透气率(m2),μa为空气黏度(设为1.846 × 10⁵kg m− 1s− 1),Pg为孔隙气压(Pa),DVg为气相纵向弥散系数(m2s− 1)。式(3)右侧第一项和第三项分别为基于菲克定律的干空气通量扩散分量和弥散分量表达式;第二项表示由达西定律计算的干空气平流通量;第四项表示在力学与化学平衡条件下溶解于液体中的空气量(亨利定律)。
The evapotranspiration rate is estimated using the revised Penman- Monteith (P-M) model (Yu et al., 2016):
蒸散速率采用修正的Penman-Monteith(P-M)模型估算(Yu et al., 2016):


where G is soil heat flux density (MJ m− 2d–1); λ is latent heat of vaporization (MJ kg− 1); Δ is the slope of the vapor pressure curve (k Pa ℃–1); γ is the psychrometric constant (k Pa ℃–1); ea and es are actual and saturation vapor pressures (kPa), respectively; Rcnand Rsnare net radiation at the canopy surface and soil surface (MJ m− 2d–1), respectively; cp is specific heat (J kg− 1℃–1) of air; ρa is air density (kg m− 3), ra c and ras are aerodynamic resistances of the canopy surface and bare soil (s m− 1), respectively; rcmin is minimum canopy surface resistance (s m− 1); and rs is soil surface resistance (s m− 1).
式中,G为土壤热通量密度(MJ m− 2d–1);λ为汽化潜热(MJ kg− 1);Δ为饱和水汽压曲线斜率(k Pa ℃–1);γ为干湿表常数(k Pa ℃–1);ea和es分别为实际水汽压和饱和水汽压(kPa);Rcn和Rsn分别为冠层表面和土壤表面的净辐射(MJ m− 2d–1);cp为空气比热(J kg− 1℃–1);ρa为空气密度(kg m− 3);ra c和ras分别为冠层表面和裸土的空气动力学阻力(s m− 1);rcmin为最小冠层表面阻力(s m− 1);rs为土壤表面阻力(s m− 1)。
2.3.2. Constitutive equations2.3.2. 本构方程
The isothermal hydraulic conductivity KLh (m s− 1) is calculated using the van Genuchten-Mualem model (van Genuchten, 1980):
等温导水率KLh(m s− 1)采用van Genuchten-Mualem模型计算(van Genuchten, 1980):


where h is the pressure head (cm), KS is the saturated hydraulic conductivity (m s− 1); θr and θs are the residual and saturated volumetric water contents (m3m− 3), respectively; m is the empirical shape parameter (dimensionless); l is set to 0.5 (dimensionless); and Se is the relative saturation (dimensionless) .
式中,h为压力水头(cm),KS为饱和导水率(m s− 1);θr和θs分别为残余体积含水量和饱和体积含水量(m3m− 3);m为经验形状参数(无量纲);l设为0.5(无量纲);Se为相对饱和度(无量纲)。
Specific heat capacities (J g− 1K− 1) of relevant solids, liquid, air and vapor were obtained from De Vries (1963) (Table 1). Effective thermal conductivity and root water uptake were calculated using the models presented by Chung and Horton (1987) and Feddes et al. (1978), respectively (Table S1). The variable definitions in STEMMUS are shown in Table S2.
相关固体、液体、空气和水汽的比热容(J g− 1K− 1)取自De Vries(1963)(表1)。有效导热率和根系吸水分别采用Chung and Horton(1987)和Feddes et al.(1978)提出的模型计算(表S1)。STEMMUS中的变量定义见表S2。
2.3.3. Model domain2.3.3. 模型区域
Based on the conservation equations for moisture, energy, and dry air, three coupled partial differential equations were solved simultaneously using Galerkin’s finite element method for spatial discretization and a fully implicit backward difference approach for temporal discretization. The model domain was a 3.0 m deep profile, with instrumented observation nodes at 20, 40, 60, 80, and 100 cm depths. There were 38 discretization nodes in the model domain and the spatial discretization size was 1 cm for the top 0.1 m layer, 1.5 cm for the 0.1–0.2
基于水分、能量和干空气守恒方程,采用Galerkin有限元法进行空间离散、全隐式向后差分法进行时间离散,同时求解三个耦合偏微分方程。模型区域为3.0 m深的剖面,仪器观测节点位于20、40、60、80和100 cm深度。模型区域内共有38个离散节点,空间离散步长为:顶部0.1 m土层1 cm,0.1–0.2
2.3.4. Initial and boundary conditions2.3.4. 初始条件与边界条件
Soil moisture and temperature measured at the beginning of each simulation were taken as the initial conditions, and the initial soil air pressure was set as atmospheric pressure, expressed as:
以每次模拟开始时实测的土壤水分和温度作为初始条件,初始土壤空气压力设为大气压,表示为:



where t is time (s), z is the vertical space coordinate, θ(z, t)|t=0and T(z, t)|t=0are the initially measured soil volumetric water content (cm3 cm− 3) and temperature (◦C), respectively, Pg(z, t)|t=0 is the initial soil air pressure set as atmospheric pressure.
式中,t为时间(s),z为垂直空间坐标,θ(z, t)|t=0和T(z, t)|t=0分别为初始实测土壤体积含水量(cm3 cm− 3)和温度(◦C),Pg(z, t)|t=0为设为大气压的初始土壤空气压力。
The upper boundary for water transport was set by atmospheric forcing, compounded with soil evaporation, precipitation and irrigation, expressed as:
水分运移上边界由大气强迫设定,综合考虑土壤蒸发、降水和灌溉,表示为:

where E, P and I are actual evaporation flux (kg m− 2s− 1), and precipitation and irrigation rates (m s− 1), respectively.
式中,E、P和I分别为实际蒸发通量(kg m− 2s− 1)、降水速率和灌溉速率(m s− 1)。
The bottom boundary for water transport was taken as free drainage. The measured upper and bottom soil temperatures were set as corresponding boundary conditions for heat transport. For dry air transport, the measured atmospheric pressure was adopted as the surface upper condition, and the zero soil-air pressure gradient was set as the bottom condition.
水分运移下边界设为自由排水。热量运移以实测的上、下边界土壤温度作为相应边界条件。干空气运移以实测大气压作为地表上边界条件,下边界设为零土壤–空气压力梯度。
To achieve a reasonable tradeoff between computational effort and accuracy of the solution, the prescribed upper limits of independent variables were used to determine a new time step size automatically (Milly, 1982) in the form of:
为在计算量与求解精度之间取得合理平衡,采用预设的自变量变化上限自动确定新的时间步长(Milly, 1982),形式如下:

where maxi denotes maximization over all nodes i is the changes in state variables estimated from the most recent time step, and Xmax, Tmax, Pgmax and hmax are the upper limits of change for volumetric water content, temperature, atmospheric pressure, and matric potential, respectively. If the change exceeds the desired upper limits, the calculation of that time step is erroneous, and the time step will be repeated with a reduced time length.
式中,maxi表示对所有节点取最大值,i为由最近一个时间步估算的状态变量变化量,Xmax、Tmax、Pgmax和hmax分别为体积含水量、温度、大气压和基质势的变化上限。若变化量超过设定上限,则该时间步的计算视为无效,并以缩短的时间步长重新计算。
2.4. Model parameterization2.4. 模型参数化
2.4.1. Soil hydraulic parameters2.4.1. 土壤水力参数
The root zone soil profiles were uniformly divided into five layers to a depth of 1 m. Soil bulk density, saturated water content, and saturated hydraulic conductivity were measured for each of the five layers in the laboratory. The averaged soil bulk density was 1.52 g cm− 3and the saturated hydraulic conductivity was 0.83 mm min− 1(Table 1). The saturated water content was originally measured using the gravimetric method and then transformed to volumetric water content of 0.41 cm3 cm− 3by multiplying bulk density. Initial coefficients of the V-G model were obtained via the pedotransfer function (PTF) presented by Ugbaje and Reuter (2013), and equal to 1.654 (n), 0.034 (α), and 0.05 (θr), respectively. The clay fraction of soils was determined using a Mastersizer 2000 Laser Particle Size Analyzer (Malvern, UK); the 0–100 cm average value was 0.08.
将1 m深度内的根区土壤剖面均匀划分为5层,在实验室分别测定各层的土壤容重、饱和含水量和饱和导水率。平均土壤容重为1.52 g cm− 3,饱和导水率为0.83 mm min− 1(表1)。饱和含水量最初采用重量法测定,再乘以容重换算为体积含水量0.41 cm3 cm− 3。V-G模型的初始系数通过Ugbaje and Reuter(2013)提出的土壤传递函数(PTF)获得,分别为1.654(n)、0.034(α)和0.05(θr)。土壤黏粒含量采用Mastersizer 2000激光粒度分析仪(Malvern,英国)测定,0–100 cm平均值为0.08。
2.4.2. Crop parameters2.4.2. 作物参数
The initial light attenuation coefficient, parameters dependent on soil texture, were cited from Yu et al. (2016), setting to 0.39, 0.68 and 2.0, respectively. Since we did not found the related L. barbarum evapotranspiration parameters before, we determined the crop coefficient at effective full ground cover according to Allen et al. (1998), and set it to 1.1 (for 1 m height fruit tree).
初始光衰减系数以及与土壤质地相关的参数引自Yu et al.(2016),分别设为0.39、0.68和2.0。由于此前未见L. barbarum蒸散相关参数的报道,我们依据Allen et al.(1998)确定了有效全覆盖时的作物系数,并将其设为1.1(适用于1 m高的果树)。
The initial extinction coefficient was assumed at 0.6 according to Yu et al. (2016). While a previous study specifically discussed and derived the dynamic extinction coefficient from measured plant transpiration as a function of LAI (Tahiri et al., 2006), it is convenient to consider it as constant (Allen et al., 1998; Yu et al., 2016). A piecewise linear function, defined in Feddes et al. (1978), was used to describe the response of roots to the soil water pressure head. The input water stress parameters were − 10 cm (H1) for the water potential below which roots start to extract water; − 30 cm (H2) for the water potential below which roots extract water at the maximum possible rate; higher limit − 650 cm (H3H) and lower limit − 800 cm (H3L) for the limiting water potential values below which roots can no longer extract water at the maximum rate; − 5000 cm (H4) for the water potential below which root water uptake ceases. Minimum soil moisture for potential evaporation is used to calculate soil surface resistance (Van De Griend and Owe, 1994) and assumed to be 0.25 cm3cm− 3initially.
根据Yu et al.(2016),初始消光系数设为0.6。虽然已有研究专门探讨并由实测植物蒸腾推导出作为LAI函数的动态消光系数(Tahiri et al., 2006),但将其视为常数更为简便(Allen et al., 1998; Yu et al., 2016)。采用Feddes et al.(1978)定义的分段线性函数描述根系对土壤水压力水头的响应。输入的水分胁迫参数为:根系开始吸水的水势阈值 − 10 cm(H1);根系以最大可能速率吸水的水势阈值 − 30 cm(H2);根系不再能以最大速率吸水的限制水势,其上限为 − 650 cm(H3H)、下限为 − 800 cm(H3L);根系停止吸水的水势阈值 − 5000 cm(H4)。潜在蒸发的最小土壤含水量用于计算土壤表面阻力(Van De Griend and Owe, 1994),初始设为0.25 cm3cm− 3。
2.5. Sensitivity test2.5. 敏感性检验
To identify influential parameters in the airflow - coupled soil moisture simulation, a series of sensitivity tests were executed before modeling by using one - factor - at - a - time (OAT) methodology (Arunrat et al., 2018), expressed as:
为识别耦合气流的土壤水分模拟中的关键参数,建模前采用一次一因子(OAT)法(Arunrat et al., 2018)进行了一系列敏感性检验,表示为:

where Aswci is the sensitivity coefficient of parameter Xi for soil water content; SWCXi is the simulated soil water content obtained by setting all parameters to default values; and SWC1.1Xiand SWC0.9Xiare simulated soil water contents obtained by setting parameter Xi to 110% and 90% of its default value, respectively, and all other parameters to default values. The sensitivity coefficient ranges from 0 (non-sensitivity) to 1 (extremesensitivity), with higher values representing higher sensitivity.
式中,Aswci为参数Xi对土壤含水量的敏感性系数;SWCXi为所有参数取默认值时模拟的土壤含水量;SWC1.1Xi和SWC0.9Xi分别为参数Xi取其默认值的110%和90%、其他参数均取默认值时模拟的土壤含水量。敏感性系数介于0(不敏感)至1(极敏感)之间,数值越大表示敏感性越高。
2.6. Validation test2.6. 验证检验
Data collected in the first year (2018) was used to calibrate the model (Figs. S2, S3, S4), and data collected in the second year was used to assess model performance. The quality of model predictions was certified by calculating the root mean squared error (RMSE) and the index of agreement (d) was adopted as additional supporting information for a better understanding of RMSE.
第一年(2018年)采集的数据用于模型率定(图S2、S3、S4),第二年采集的数据用于评估模型性能。通过计算均方根误差(RMSE)检验模型预测质量,并采用一致性指数(d)作为补充信息,以便更好地理解RMSE。
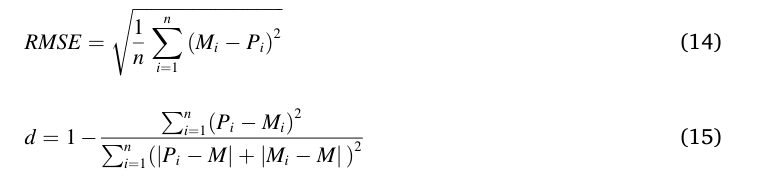
where Pi is a predicted value, Mi is the corresponding measured value, M is the mean measured values, i is the number of measurements, and n is the test dataset size. The d value ranges from 0 to 1. If the evaluated model accurately depicts the datasets, d should be close to 1, while low RMSE values indicate that most predictions are close to the observations.
式中,Pi为预测值,Mi为相应实测值,M为实测值的平均值,i为测定序号,n为检验数据集大小。d值介于0至1之间。若所评估模型能准确描述数据集,d应接近1,而较低的RMSE值表明大多数预测值接近观测值。
3Results结果
3.1. Meteorological variables3.1. 气象变量
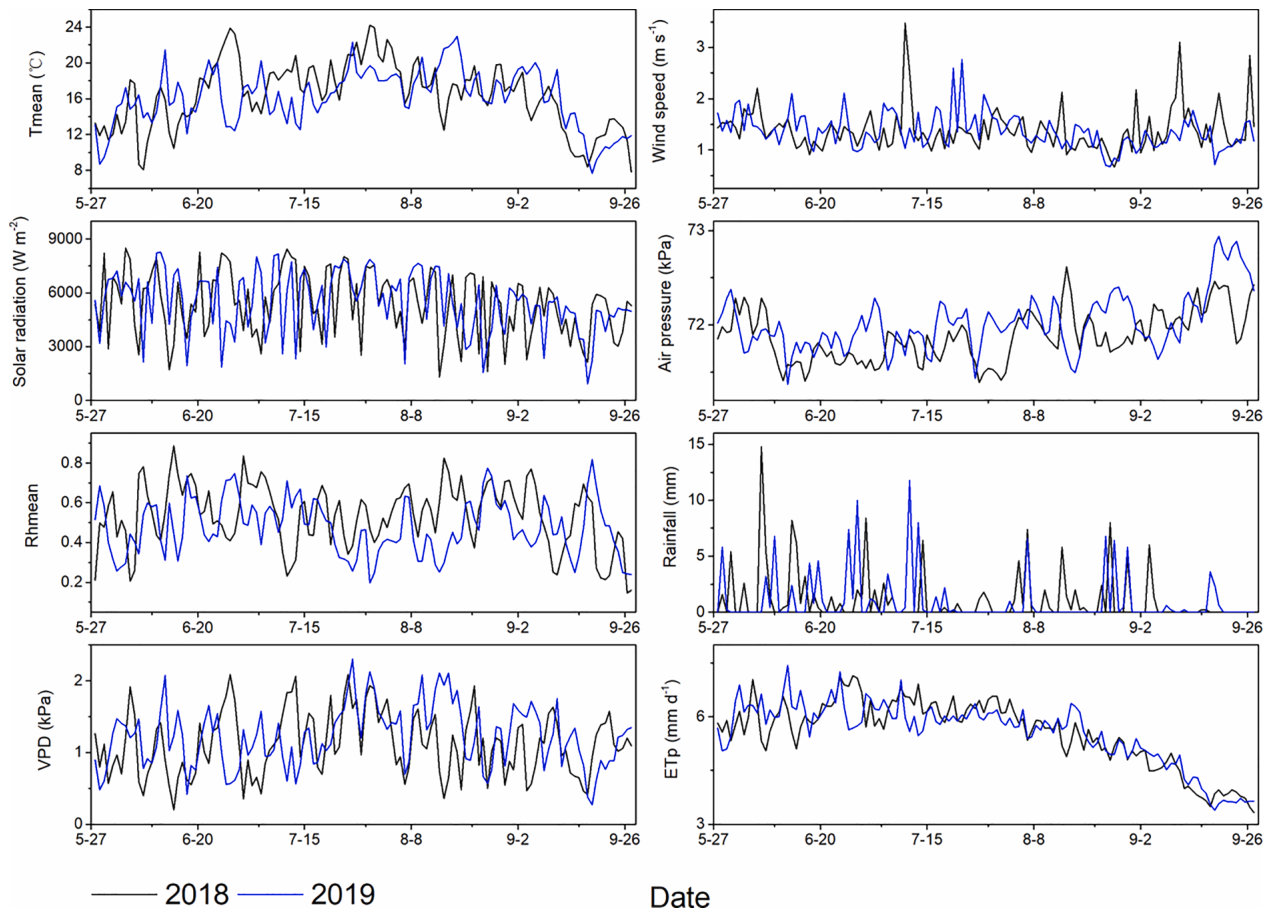
The monitored 2 m height meteorological variables at the experimental site are presented in Fig. 2. The experimental site is in a high altitude area, with a typical continental plateau climate, featuring low air oxygen concentration, low temperature, dry winds, and strong solar radiation. The average air temperature over the two years was 16 ℃, and average air pressure was 72 kPa. The highest daily solar radiation reached 8000 Wh m− 2day− 1, while the recorded precipitation during crop growth period only attained 141 mm and 135 mm, respectively, in 2018 and 2019, mainly concentrated in the vegetative growth stage. Potential evapotranspiration at the experimental site is very high, especially during vegetative growth, often reaching 6 mm d− 1. During crop growth, the vapor pressure deficit (VPD) waved unstably, as the calculated saturation vapor pressure was averaged to 2 kPa while actual local vapor pressure was approximately 0.9 kPa, resulting in strong potential evaporation.
试验站点2 m高度的气象变量监测结果见图2。试验站点位于高海拔地区,属典型的大陆性高原气候,具有空气含氧量低、气温低、风干燥和太阳辐射强的特点。两年平均气温为16 ℃,平均气压为72 kPa。最高日太阳辐射达8000 Wh m− 2day− 1,而2018年和2019年作物生育期内记录的降水量分别仅为141 mm和135 mm,且主要集中在营养生长阶段。试验站点潜在蒸散很高,尤其在营养生长期,常达6 mm d− 1。作物生长期间,饱和水汽压差(VPD)波动不稳,计算的饱和水汽压平均为2 kPa,而当地实际水汽压约为0.9 kPa,导致潜在蒸发强烈。
3.2. Sensitivity analysis3.2. 敏感性分析
We expected that parameters with Aswci values larger than 0.3 would impact simulations. The sensitivity tests showed that varying the parameters in the water flow module generated relatively large differences in modeling results, with four of the nine parameters with Aswci values greater than 0.3, while Ks attained this baseline. In contrast, only two of the 11 crop evapotranspiration module parameters had Aswci values slightly above 0.3 (Table 2). Most of the influential parameters were soil hydraulic parameters. The strongest influential parameter for soil moisture modeling was a V–G equation coefficient (n), with an Aswci value of 0.9. Aswci values for the identified influential parameters were ranked as follows: n > θs> α > η > θmin> H4 > Ks.
我们设定Aswci值大于0.3的参数会对模拟结果产生影响。敏感性检验表明,改变水流模块参数会使模拟结果产生较大差异,9个参数中有4个的Aswci值大于0.3,而Ks恰好达到该基准值。相比之下,作物蒸散模块的11个参数中仅有2个的Aswci值略高于0.3(表2)。大多数关键参数为土壤水力参数。对土壤水分模拟影响最大的参数是V–G方程系数(n),其Aswci值为0.9。所识别关键参数的Aswci值排序如下:n > θs> α > η > θmin> H4 > Ks。
3.3. Modeling performance3.3. 模拟性能
3.3.1. Soil temperature and moisture3.3.1. 土壤温度与水分
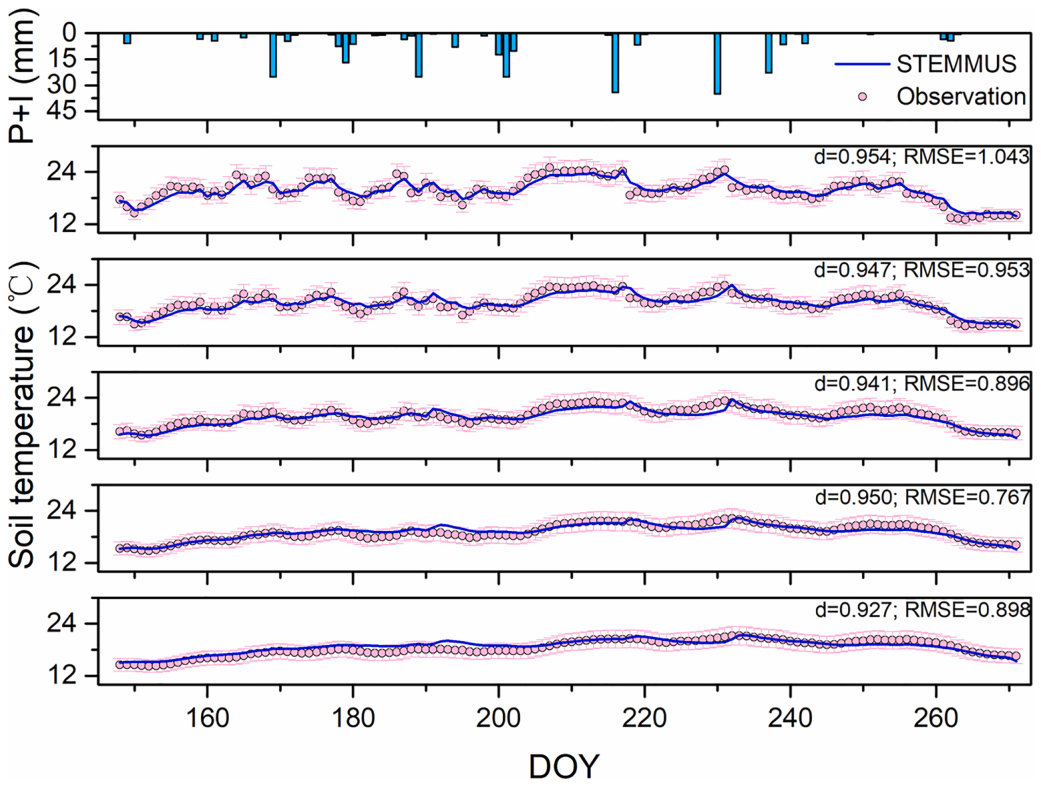
Fig. S2 shows the calibration results of airflow - coupled soil temperature at soil depths of 20, 40, 60, 80, and 100 cm. Due to unexpected destruction, several days’ soil temperature and moisture data were lost (Figs. S2 and S3), but soil temperature of different layers was simulated well in the whole crop growing period, The calculated index of agreement (d) and RMSE ranged from 0.96 to 0.98 and 1.55 ℃ to 2.1 ℃ at 20–100 cm soil profile, respectively. For the validation results (Fig. 3), during the growing season, observed soil temperature variations mainly occurred in shallow soil layers. STEMMUS satisfactorily captured the observations at the monitored depths. The calculated index of agreement (d) and RMSE ranged from 0.93 to 0.95 and 0.77 ℃ to 1.04 ℃ at 20–100 cm soil profile, respectively, with an averaged value of 0.94.图S2为20、40、60、80和100 cm土壤深度耦合气流的土壤温度率定结果。由于意外损坏,部分日期的土壤温度和水分数据缺失(图S2和S3),但整个作物生育期内各层土壤温度均模拟良好,20–100 cm土壤剖面计算的一致性指数(d)和RMSE分别为0.96~0.98和1.55~2.1 ℃。验证结果(图3)表明,生长季内观测到的土壤温度变化主要发生在浅层土壤。STEMMUS较好地捕捉了各监测深度的观测值。20–100 cm土壤剖面计算的一致性指数(d)和RMSE分别为0.93~0.95和0.77~1.04 ℃,d平均值为0.94。
The soil moisture simulations were acceptable for both calibration and validation stages (Figs. S3 and 4), with average values for d in the 20–100 cm soil profile of 0.85 and 0.83, respectively. The moisture dynamics at 20–40 cm soil depths corresponding to rainfall/irrigation events were well - modeled, with values for d and RMSE for validation stage reaching 0.93 and 0.01 cm3cm− 3respectively. However, simulations at 60 cm depth were not as good as in the shallow layers; apparent underestimation was observed under the calibration stage, while at the validation stage, the observations wavered slightly through the whole growing period due to limited water input whereas the simulated values exhibited the more intense responses to rainfall/irrigation and underestimated the observations. At 100 cm, the observations were portrayed well by the simulations, with d andRMSE values reaching 0.96 and 0.01 cm3cm− 3respectively (Fig. 4).
土壤水分模拟在率定期和验证期均可接受(图S3和图4),20–100 cm土壤剖面d平均值分别为0.85和0.83。20–40 cm土壤深度对降雨/灌溉事件的水分动态响应模拟良好,验证期d和RMSE分别达0.93和0.01 cm3cm− 3。然而,60 cm深度的模拟效果不及浅层:率定期存在明显低估;验证期由于水分输入有限,观测值在整个生育期内仅轻微波动,而模拟值对降雨/灌溉的响应更为剧烈,且低估了观测值。在100 cm深度,模拟值较好地再现了观测值,d和RMSE分别达0.96和0.01 cm3cm− 3(图4)。
3.3.2. Evapotranspiration and soil evaporation3.3.2. 蒸散与土壤蒸发
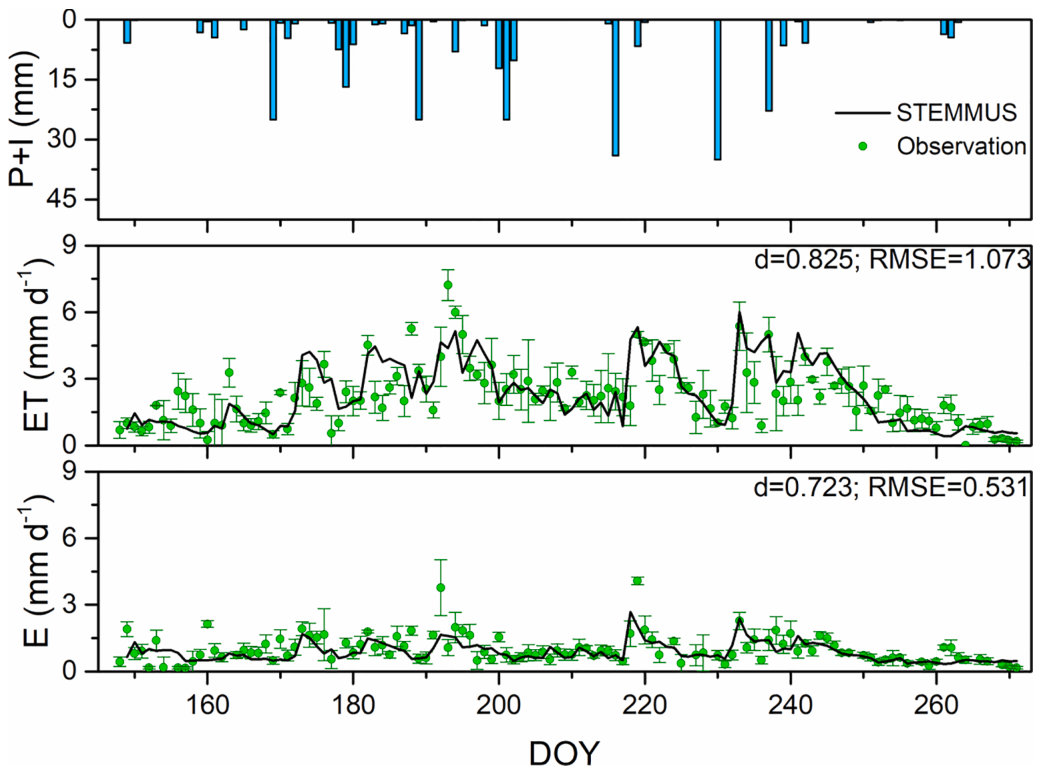
The growth of Lycium barbarum L. begins in late May and ends at the end of September, then enters dormancy. The simulations for daily crop evapotranspiration agreed acceptably with the observations during the whole growing period (Figs. S4 and 5). The d values attained 0.68 and 0.83, and RMSE values attained 0.99 mm d–1and 1.07 mm d–1respectively, for the calibration and validation stages.
Lycium barbarum L.于5月下旬开始生长,9月底结束,随后进入休眠。整个生育期内逐日作物蒸散的模拟值与观测值吻合程度可接受(图S4和图5)。率定期和验证期的d值分别为0.68和0.83,RMSE值分别为0.99 mm d–1和1.07 mm d–1。
The simulations for daily soil evaporation were similar to the results of evapotranspiration. The variations in precipitation/irrigation were well portrayed, with only a few significant modeling errors were found across the entire growing season, with values for d and RMSE reaching 0.72 and 0.53 mm d–1respectively (Fig. 5).
逐日土壤蒸发的模拟结果与蒸散相似。降水/灌溉引起的变化得到较好再现,整个生长季仅出现少数显著模拟误差,d和RMSE分别达0.72和0.53 mm d–1(图5)。
3.4. Impact of soil dry airflow3.4. 土壤干空气流的影响
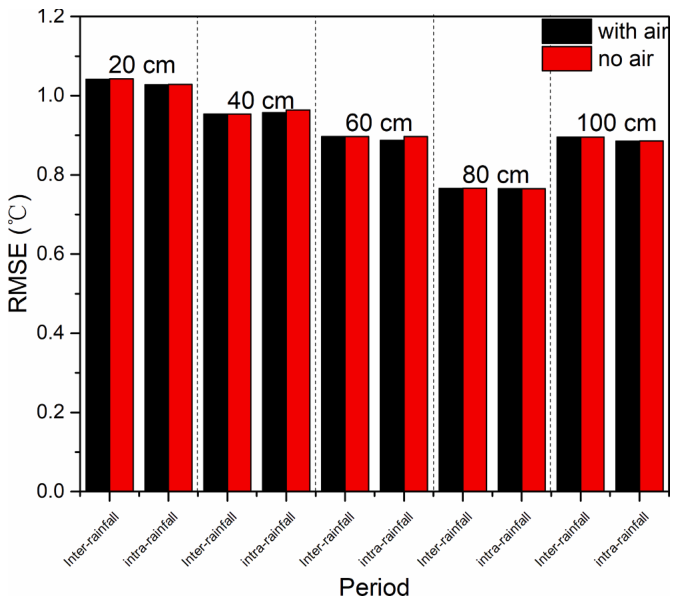
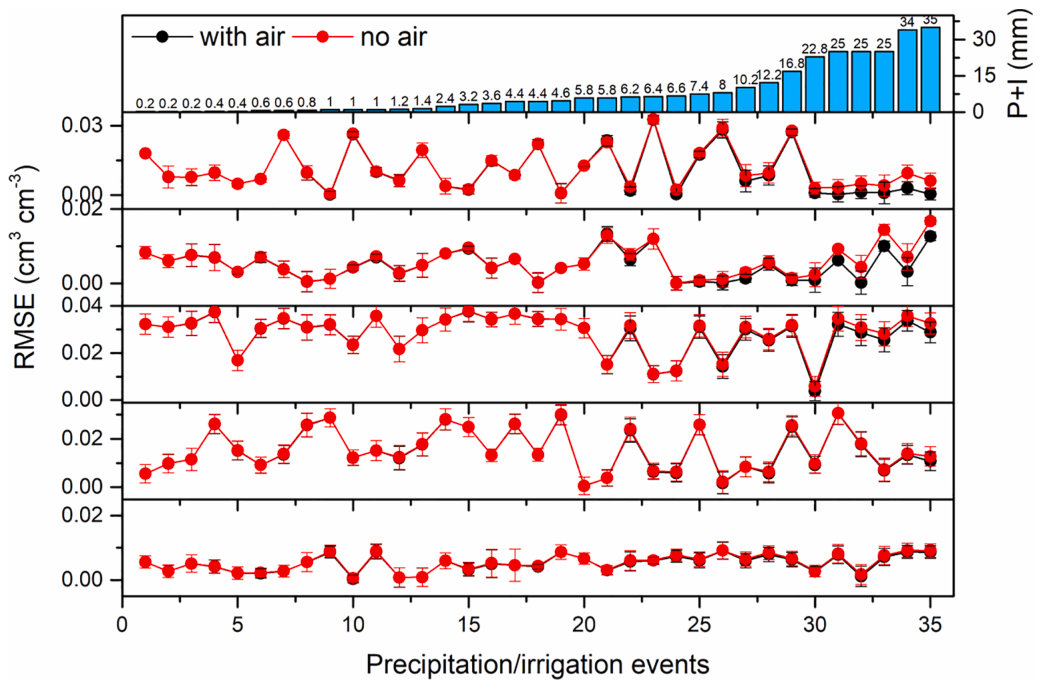
Simulation differences when including the soil airflow mechanism occurred after rainfall or irrigation events, but not significantly (Fig. 6). Considering soil airflow transport immediately elevated the downward water vapor flux and liquid water flux after rainfall or surface irrigation, increasing the soil moisture modeling values and closing the observation gap. We therefore divided the simulated results throughout the whole growing season into periods of non-rainfall/irrigation (inter - rainfall) and rainfall/irrigation (intra - rainfall), and results indicated that irrespective of an inter - or intra - rainfall (or irrigation) period, considering soil airflow transport had little effects on the simulation of soil temperature (Fig. 7). We used RMSE here as it showed clear differences for comparisons. The most apparent difference occurred at 60 cm, where considering soil dry airflow reduced RMSE by 1.1% during the intra-rainfall period.
纳入土壤气流机制所引起的模拟差异出现在降雨或灌溉事件之后,但并不显著(图6)。考虑土壤气流运移后,降雨或地表灌溉后向下的水汽通量和液态水通量随即增大,使土壤水分模拟值升高,缩小了与观测值的差距。因此,我们将整个生长季的模拟结果划分为无降雨/灌溉期(降雨间期)和降雨/灌溉期(降雨期内),结果表明,无论是降雨(或灌溉)间期还是期内,考虑土壤气流运移对土壤温度模拟的影响均很小(图7)。此处采用RMSE,因为其在比较中差异明显。最明显的差异出现在60 cm深度,降雨期内考虑土壤干空气流使RMSE降低了1.1%。
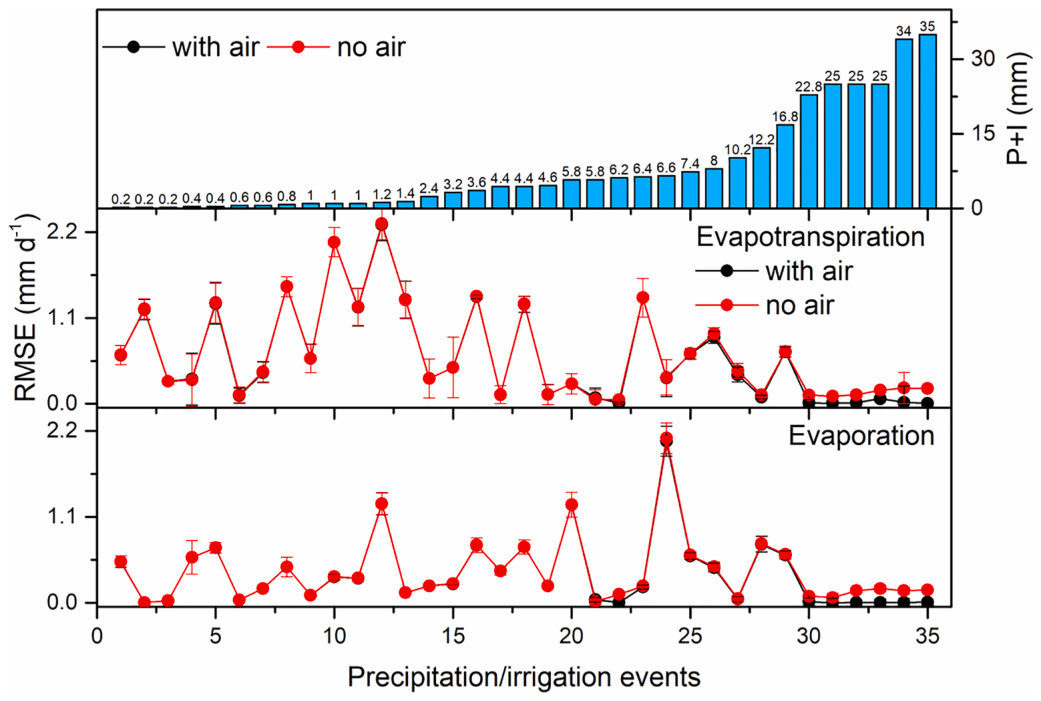
Incorporating airflow successfully improved soil moisture and evapotranspiration modeling precision when the water input from rainfall/irrigation reached 22.8 mm and beyond (Figs. 8 and 9). In comparison with the soil moisture simulations neglecting soil dry airflow, considering airflow reduced RMSE from 0.0% to 92.5% at 20 cm soil depth; beyond that depth, the improvements were less evident, with maximum reductions of 95.9%, 34.5%, 15.5%, and 6.7% at 40, 60, 80, and 100 cm, respectively. The airflow - coupled simulation reduced the evapotranspiration RMSE from 0.0% to 97.8% and evaporation RMSE from 0.0% to 99.3%.
当降雨/灌溉的水分输入达到或超过22.8 mm时,纳入气流有效提高了土壤水分和蒸散的模拟精度(图8和图9)。与忽略土壤干空气流的土壤水分模拟相比,考虑气流使20 cm土壤深度的RMSE降低0.0%~92.5%;在更深层次,改善效果不太明显,40、60、80和100 cm深度的最大降幅分别为95.9%、34.5%、15.5%和6.7%。耦合气流的模拟使蒸散RMSE降低0.0%~97.8%,蒸发RMSE降低0.0%~99.3%。
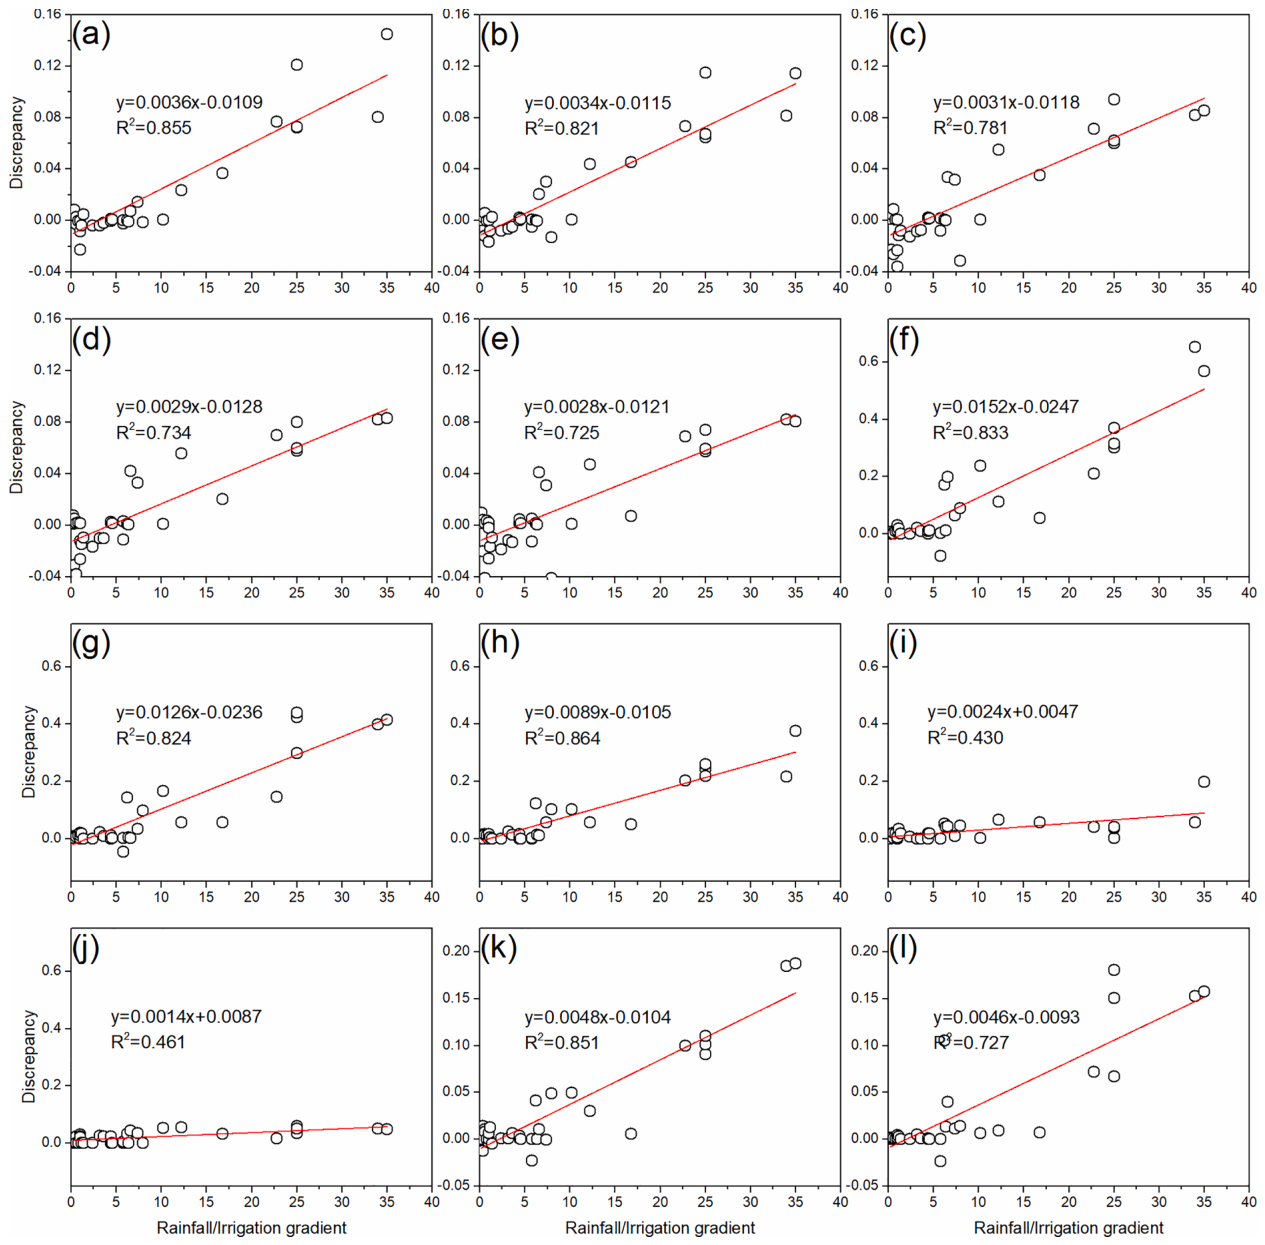
We thereafter integrated all the 35 rainfall/irrigation events during the validation period to compare the magnitude of water input on the airflow-coupled simulation (Fig. 10). For soil temperature, modeling values considering airflow presented the same but negligible increment as rainfall/irrigation amount; of which the increase was limited to 0.1 ◦C at most soil depths. The soil moisture modeling values when considering airflow at shallow soil layers also showed positive relationships with increasing water inputs—a 10 mm increase in rainfall/irrigation increased moisture modeling values by 0.2% at 20 cm soil depth, and the maximum increment reached 0.6%, while the obvious positive relationship between airflow and water inputs gradually weakened with depth. No clear distinctions were evident between the simulations with and without airflow at 100 cm soil depth. Airflow-coupled evapotranspiration and evaporation modeling values also had positive correlations with water inputs, with maximum values all approaching 0.2 mm d–1, when water inputs increased to 30 mm.
随后,我们整合了验证期内全部35次降雨/灌溉事件,比较水分输入量对耦合气流模拟的影响(图10)。对于土壤温度,考虑气流的模拟值随降雨/灌溉量增加呈同步但可忽略的增加,大多数土壤深度的增幅不超过0.1 ◦C。浅层土壤考虑气流的水分模拟值也与水分输入量呈正相关:降雨/灌溉每增加10 mm,20 cm土壤深度的水分模拟值增加0.2%,最大增幅达0.6%,而气流与水分输入之间明显的正相关关系随深度增加逐渐减弱。在100 cm土壤深度,考虑与不考虑气流的模拟之间无明显差别。耦合气流的蒸散和蒸发模拟值也与水分输入呈正相关,当水分输入增至30 mm时,其最大值均接近0.2 mm d–1。
4Discussion讨论
Sensitivity analysis can be used to quickly identify sensitive parameters in modeling results and reduce the time required for calibrating parameters. Our sensitivity tests indicated that relatively influential parameters for airflow-coupled soil moisture prediction included soil hydraulic properties (Ks, θs, n, α, and η) and coefficients of the evapo- transpiration equation (H4 and θmin) (Table 2). These results are
敏感性分析可用于快速识别对模拟结果敏感的参数,缩短参数率定所需时间。本研究敏感性检验表明,对耦合气流的土壤水分预测影响相对较大的参数包括土壤水力特性(Ks、θs、n、α和η)以及蒸散方程系数(H4和θmin)(表2)。这些结果
Sensitivity analysis for STEMMUS.
STEMMUS的敏感性分析。
| No. | Parameter参数 | Symbol符号 | Default value默认 值 | Calibrated value率定 值 | AswciAswci |
|---|---|---|---|---|---|
| Crop | evapotranspiration module | ||||
| 1 | Light attenuation coefficient (/) | ζ | 0.39 | 0.5 | 0.24 |
| 2 | i Parameters dependent on | k | 0.68 | 0.8 | 0.11 |
| 3 | soil texture (/) i | m | 2.0 | 2.3 | 0.23 |
| 4 | Crop coefficient at effective full ground cover (/) i | Kcbmax | 1.10 | 1.25 | 0.11 |
| 5 | Extinction coefficient (/) | τ | 0.6 | 0.8 | 0.11 |
| 6 | i Water stress function | H1 | −10 | −15 | 0.10 |
| 7 | parameters (cm) | H2 | −30 | −35 | 0.12 |
| 8 | H4 | −5000 | −6000 | 0.33 | |
| 9 | H3L | −800 | −600 | 0.24 | |
| 10 | H3H | −650 | −500 | 0.13 | |
| 11 l | Minimum soil moisture for potential evaporation (cm3 cm−3) l | _θ_min | 0.3 | 0.25 | 0.35 |
| Wate l | r flow module | ||||
| l 1 | l Saturation hydraulic conductivity (mm min−1) | Ks | 0.83 | 0.81 | 0.30 |
| 2 | Saturated water content (cm3cm−3) | _θ_s | 0.41 | 0.38 | 0.45 |
| 3 | Residual water content (cm3cm−3) i | _θ_r | 0.05 | 0.04 | 0.18 |
| 4 | Coefficient in V-G model (/) i | n | 1.654 | 1.702 | 0.90 |
| 5 | Coefficient in V-G model (/) | α | 0.034 | 0.004 | 0.44 |
| 6 | Soil porosity (/) | η | 0.43 | 0.45 | 0.39 |
| 7 | The fraction of clay (/) | f | 0.036 | 0.025 | 0.21 |
Note: θs, Ksand η were measured in the laboratory. Other default parameters in the V-G model were obtained via the pedotransfer function (PTF) presented by Ugbaje and Reuter (2013) and the initial parameters of the Feddes equation were obtained from the HYDRUS database (Simˇ ůnek and van Genuchten, 2008).
注:θs、Ks和η在实验室测定。V-G模型的其他默认参数通过Ugbaje and Reuter(2013)提出的土壤传递函数(PTF)获得,Feddes方程的初始参数取自HYDRUS数据库(Simˇ ůnek and van Genuchten, 2008)。
consistent with those of Ren et al. (2016), who also adopted the V-G and Feddes models to portray soil water dynamics. The most influential parameter was a coefficient of the V-G equation, confirming the importance of soil hydraulic functions in soil moisture modeling (Vereecken et al., 2010; Luo et al., 2019).
与Ren et al.(2016)的结果一致,该研究同样采用V-G模型和Feddes模型描述土壤水分动态。影响最大的参数为V-G方程的系数,证实了土壤水力函数在土壤水分模拟中的重要性(Vereecken et al., 2010; Luo et al., 2019)。
To our best knowledge, most simulation studies related to soil hydrothermal processes on the TP have focused on large-scale soil surface moisture retrieval (Bi et al., 2016; Wang et al., 2016; Yang et al., 2016; Zheng et al., 2018), streamflow simulation (Bai et al., 2016), or responses to climate change (Yang et al., 2011; Xue et al., 2014; Fan et al., 2019; Zhang et al., 2019), or the soil freeze - thaw process (Hu et al., 2015; Yu et al., 2018, 2020; Yang and Wang, 2019; Luo et al., 2020). There are no studies on root-zone soil hydrothermal dynamics simulation during crop growth period in dry alpine agricultural regions. The harsh climatic environment of the alpine agricultural region and local coarse-textured soils have posed a challenge for data acquisition. Based on the calibrated parameters in the current study, STEMMUS portrayed soil temperature dynamics well within the vadose zone of alpine agricultural fields under local traditional cultivation practice. The simulated soil temperatures were consistent with the observations (Fig. 3). Including airflow did not exert obvious effects on simulation accuracy but still increased modeling values slightly right after rainfall/irrigation events, which was aligned with a previous report (Zeng et al., 2011a). In addition to parameters (such as airflow equation’s or heat equation’s) or other possible uncertainties (such as the modeling result not converging) which could influence airflow coupled soil heat transfer as a previous study indicated (Martínez et al., 2016). A possible explanation for slight increment was the inclusion of effects of the air pressure gradient retarded water vapor transport which caused more water vapor to be condensed and consequently the release of latent heat, thus causing a temporary rise in the medium temperature (Zeng et al., 2011a). The high air velocity and open column actually provide a path for the air to escape, creating a condition for the air in the soil column to equilibrate quickly with the atmospheric pressure, which minifies the air pressure head gradients and leads to a small advective effect on soil vapor flow (Zeng et al., 2011b), and therefore did not affect the two-phase flow (air–water flow) noteworthily. However, in other cases when the column was sealed (no air escape from the bottom) and the top of the column saturated or close to saturation (Zeng et al., 2011a), the air phase had a more apparent influence on the water phase flow. The relatively higher deviations between simulated and observed soil temperatures at 100 cm depth may be partly attributed to measurement bias associated with the sensors or the coarse-textured soils at the experimental site (Pan et al., 2015). This reflected the limited averaging of biases rather than a limitation of the models per se. Further study is needed to conduct multi-point modeling on the TP (i.e., central and western regions) to evaluate STEMMUS performance on alpine agricultural lands.
据我们所知,青藏高原土壤水热过程的模拟研究大多集中于大尺度地表土壤水分反演(Bi et al., 2016; Wang et al., 2016; Yang et al., 2016; Zheng et al., 2018)、径流模拟(Bai et al., 2016)、对气候变化的响应(Yang et al., 2011; Xue et al., 2014; Fan et al., 2019; Zhang et al., 2019)或土壤冻融过程(Hu et al., 2015; Yu et al., 2018, 2020; Yang and Wang, 2019; Luo et al., 2020)。目前尚无针对干旱高寒农业区作物生育期根区土壤水热动态模拟的研究。高寒农业区严酷的气候环境和当地粗质地土壤给数据获取带来了挑战。基于本研究率定的参数,STEMMUS较好地描述了当地传统栽培方式下高寒农田包气带内的土壤温度动态,土壤温度模拟值与观测值一致(图3)。纳入气流对模拟精度无明显影响,但在降雨/灌溉事件后仍使模拟值略有升高,这与前人报道一致(Zeng et al., 2011a)。除参数(如气流方程或热量方程的参数)或其他可能的不确定性(如模拟结果不收敛)可能影响耦合气流的土壤热传递外(Martínez et al., 2016),轻微升高的一种可能解释是:纳入空气压力梯度的作用阻滞了水汽运移,使更多水汽凝结并释放潜热,从而导致介质温度暂时升高(Zeng et al., 2011a)。较高的空气流速和开放的土柱实际上为空气逸出提供了通道,使土柱内空气能够迅速与大气压达到平衡,从而减小空气压力水头梯度,使其对土壤水汽流的平流作用较小(Zeng et al., 2011b),因而对两相流(气–水流)无显著影响。然而,在土柱密封(底部无空气逸出)且土柱顶部饱和或接近饱和的其他情形下(Zeng et al., 2011a),气相对水相流动的影响更为明显。100 cm深度土壤温度模拟值与观测值偏差相对较大,部分原因可能在于传感器测量偏差或试验站点的粗质地土壤(Pan et al., 2015)。这反映的是偏差平均的局限性,而非模型本身的局限性。今后需在青藏高原(即中部和西部地区)开展多点模拟,以评估STEMMUS在高寒农业用地上的性能。
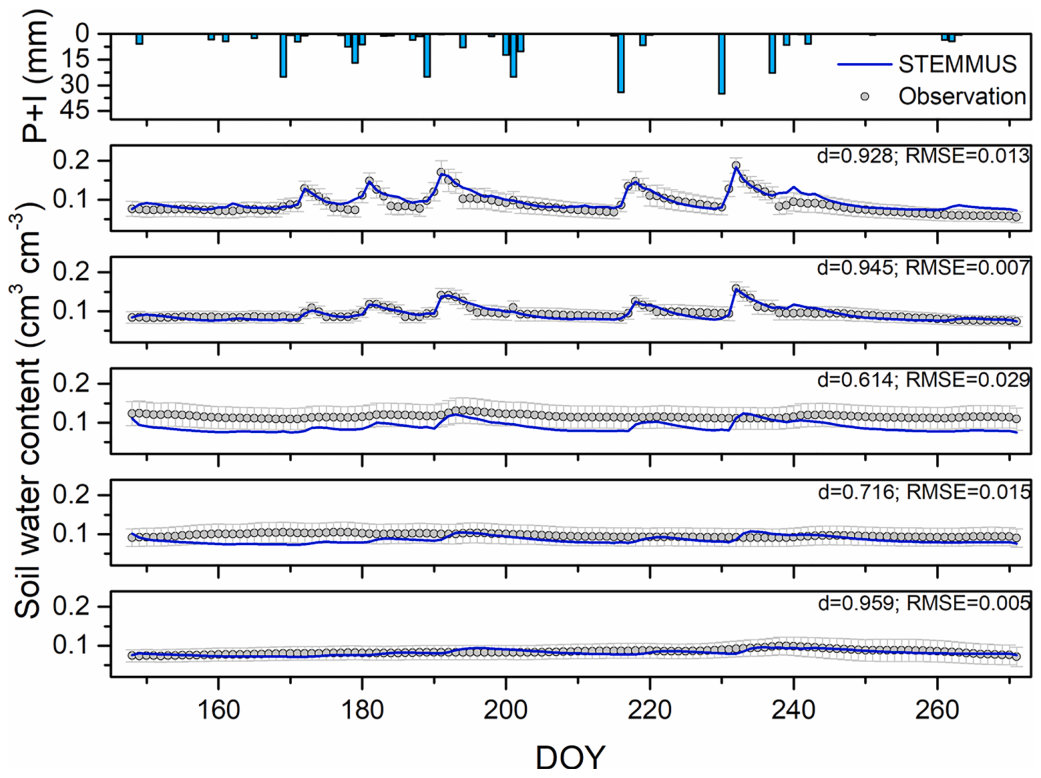
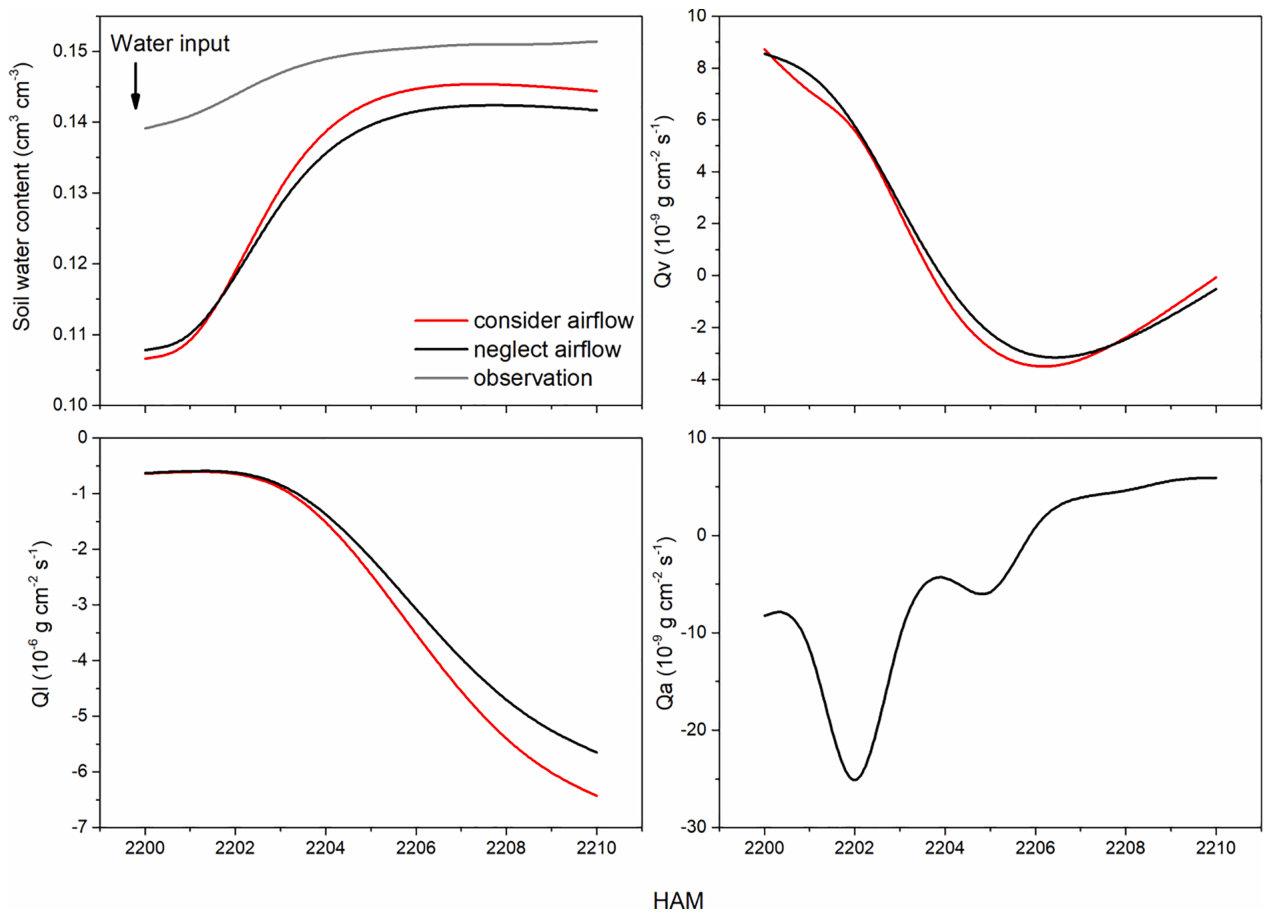
During crop growth, the soil moisture modeling results agreed reasonably well with the observations, and the water dynamics following precipitation/irrigation events were well captured (Fig. 4). However, there were clear discrepancies at 60 and 80 cm soil layers. We concluded three possible reasons: firstly, this may be due to the high gravel and sand contents of the experimental soils, which can cause deviations by using general hydraulic parameter estimations according to several previous studies (Cerda, 2001; Rücknagel et al., 2013; GordilloRivero et al., 2014; Zhao et al., 2018). Secondly, the poor simulation results might be attributed to the assumption of soil profile texture uniformity in the model (Zeng et al., 2011a; Zeng et al., 2011b). As sensitivity analysis suggested (Table 2), modeling results were sensitive to the input soil hydraulic properties, thus neglecting the heterogeneity of the actual soil would inevitably lead to the reduction of simulation accuracy. A further step of model improvement is needed to consider different soil layer’s characteristics. Thirdly, the soil has high contents of gravel and sand, and holes and macro - pores formed by little reptiles and decaying root matter, which could contribute to preferential flow pathways (Geiger and Durnford, 2000), and sensors installed closely to such pathways could lead to observation errors (Ramos et al., 2012; Yu et al., 2016). Incorporating airflow slightly but successfully improved 20–100 cm depth soil moisture modeling accuracy after precipitation or irrigation events happened (Fig. 8). This may be due to the consideration of airflow that retarded the water vapor transport right after precipitation/irrigation events, causing more water vapor to be condensed, and thus indirectly raised the liquid flux, making simulations closer to measurements than neglecting airflow (Fig. 6).
在作物生长期间,土壤水分模拟结果与观测值吻合较好,降水/灌溉事件后的水分动态得到了较好的刻画(图4)。然而,在60 cm和80 cm土层存在明显偏差。我们归纳了三个可能的原因:首先,这可能是由于试验土壤砾石和砂粒含量较高,根据以往多项研究,采用通用的水力参数估算方法会导致偏差(Cerda, 2001; Rücknagel et al., 2013; GordilloRivero et al., 2014; Zhao et al., 2018)。其次,模拟效果不佳可能归因于模型中假定土壤剖面质地均一(Zeng et al., 2011a; Zeng et al., 2011b)。敏感性分析表明(表2),模拟结果对输入的土壤水力性质较为敏感,因此忽略实际土壤的异质性必然导致模拟精度降低。模型需要进一步改进,以考虑不同土层的特性。第三,该土壤砾石和砂粒含量高,且存在由小型爬行动物和腐烂根系形成的孔洞和大孔隙,这些可能形成优先流通道(Geiger and Durnford, 2000),而安装在此类通道附近的传感器可能导致观测误差(Ramos et al., 2012; Yu et al., 2016)。纳入气流后,降水或灌溉事件发生后20–100 cm深度土壤水分的模拟精度得到了小幅但有效的提高(图8)。这可能是由于考虑气流后,降水/灌溉事件发生后水汽传输即刻受到阻滞,使更多水汽凝结,从而间接提高了液态水通量,使模拟值较忽略气流时更接近实测值(图6)。
Crop evapotranspiration is the main method of water consumption in farmland, which binds to crop water use efficiency and yield (Wang et al., 2020). The P–M model is used worldwide to simulate crop evapotranspiration. Yu et al. (2016) embedded the P–M model into STEMMUS and successfully captured observed daily maize evapotranspiration and soil evaporation rates. By calibrating soil and crop parameters, we also obtained the fitting modeling results for Lycium barbarum L. evapotranspiration and soil evaporation (Fig. 5). Errors in evaporation modeling may have been partly due to micro - lysimeter errors as previous studies indicated (Daamen et al., 1993; Kidron and Kronenfeld, 2017), which may arise from exclusion of roots from the lysimeters (Wei et al., 2015). Coupling soil dry airflow successfully improved the modeling precision of evapotranspiration and evaporation following precipitation or irrigation events (Fig. 9), which was attributed to the increase in modeling values, therefore reducing the discrepancies between simulated and observed values.
作物蒸散是农田水分消耗的主要途径,与作物水分利用效率和产量密切相关(Wang et al., 2020)。P–M模型在世界范围内被广泛用于模拟作物蒸散。Yu et al. (2016) 将P–M模型嵌入STEMMUS,成功再现了观测到的玉米日蒸散量和土壤蒸发速率。通过校准土壤和作物参数,我们同样获得了Lycium barbarum L.蒸散和土壤蒸发的良好拟合模拟结果(图5)。如以往研究所指出(Daamen et al., 1993; Kidron and Kronenfeld, 2017),蒸发模拟的误差可能部分源于微型渗漏计的误差,而这可能是由于渗漏计内排除了根系所致(Wei et al., 2015)。耦合土壤干空气流后,降水或灌溉事件后蒸散和蒸发的模拟精度得到有效提高(图9),这归因于模拟值的增加,从而缩小了模拟值与观测值之间的差异。
Vapor flow, which is dependent on soil matric potential and temperature, links soil water and heat transfer processes (Yu et al., 2020), can be significantly impacted by airflow in dry soil (Zeng et al., 2011a), and calls for a clear guidance model (Moldrup et al., 2013). In this study, however, airflow’s impacts on soil water flow was not apparent which was partly ascribed to our open soil column condition, but we found heavy rainfall or irrigation would trigger the modeling differences when we considered soil airflow transport. Simulations when considering airflow had a positive correlation with increasing water inputs (Fig. 10), which might be due to the strong variation in the soil matric potential gradient after significant precipitation/irrigation events, which subsequently affected the soil air pressure gradient at the surface, enhanced the magnitude of vapor flux by driving advective vapor transport (Zeng et al., 2011a), and indirectly increased total water flux. For soil moisture modeling (Fig. 10f - j), airflow behavior became weaker with increasing soil depth, which may be partially attributed to the limited precipitation and irrigation on the study site, which could only support minor water supplement when it came to deeper layers, weakened variations of soil matric potential and therefore airflow’s effects. For evapotranspiration simulations (Fig. 10k), the positive relationships between airflow-coupled modeling values and water input could be partially attributed to the same patterns in evaporation simulations, as it was obtained by summing transpiration and evaporation rates. The enhanced surface evaporative flux simulations after significant precipitation/irrigation events could be partly related to the unstable wind speed at the soil surface, or the increase in soil matric potential in the topsoil layer which changes the soil air pressure gradient at the surface, promotes advective vapor transfer which is an important portion of evaporation, and further enhances the magnitude of soil evaporation flux (Zeng et al., 2011b; 2013).
水汽流取决于土壤基质势和温度,连接着土壤水分与热量传输过程(Yu et al., 2020),在干燥土壤中可受到气流的显著影响(Zeng et al., 2011a),亟需明确的指导模型(Moldrup et al., 2013)。然而,本研究中气流对土壤水分运动的影响并不明显,部分原因在于采用了开放式土柱条件;但我们发现,在考虑土壤气流传输时,强降雨或灌溉会引发模拟结果的差异。考虑气流时的模拟结果与水分输入量的增加呈正相关(图10),这可能是由于显著降水/灌溉事件后土壤基质势梯度变化剧烈,进而影响地表土壤气压梯度,通过驱动对流水汽传输增大了水汽通量(Zeng et al., 2011a),并间接增加了总水分通量。就土壤水分模拟而言(图10f - j),气流作用随土壤深度增加而减弱,这可能部分归因于研究区降水和灌溉有限,到达较深土层时仅能提供少量水分补给,削弱了土壤基质势的变化,从而减弱了气流的影响。就蒸散模拟而言(图10k),耦合气流的模拟值与水分输入之间的正相关关系可部分归因于蒸发模拟中的相同规律,因为蒸散是由蒸腾速率与蒸发速率相加得到的。显著降水/灌溉事件后地表蒸发通量模拟值的增加,可能部分与土壤表面风速不稳定有关,或与表土层土壤基质势升高有关:后者改变了地表土壤气压梯度,促进了作为蒸发重要组成部分的对流水汽传输,进而增大了土壤蒸发通量(Zeng et al., 2011b; 2013)。
5Conclusion结论
This study demonstrated that STEMMUS can reliably describe the soil hydrothermal process and evapotranspiration dynamic in dry alpine agricultural land. Coupling soil dry airflow affected the soil hydrothermal process modeling, and the impact of considering airflow following rainfall/irrigation events was positively correlated with increasing water inputs. Considering airflow did not produce apparent differences but still successfully improved the modeling precision for soil moisture (reduction of RMSE values ranging from 0 to 95.9%), evapotranspiration (reduction of RMSE values ranging from 0 to 97.8%) and evaporation (reduction of RMSE values ranging from 0 to 99.3%) following rainfall/ irrigation events. Our findings offer insight into the role of airflow in the complex soil physical processes in arid agricultural land and highlight that rainfall/irrigation inputs are a major factor affecting simulations when airflow is considered.
本研究表明,STEMMUS能够可靠地描述干旱高寒农田的土壤水热过程和蒸散动态。耦合土壤干空气流影响了土壤水热过程的模拟,降雨/灌溉事件后考虑气流的影响与水分输入量的增加呈正相关。考虑气流并未产生明显差异,但仍有效提高了降雨/灌溉事件后土壤水分(RMSE值降低0~95.9%)、蒸散(RMSE值降低0~97.8%)和蒸发(RMSE值降低0~99.3%)的模拟精度。本研究结果有助于认识气流在干旱农田复杂土壤物理过程中的作用,并强调降雨/灌溉输入是考虑气流时影响模拟结果的主要因素。
Declaration of Competing Interest利益冲突声明
comprehensive model for single ring infiltration data. J. Hydrol. 573, 937–951.
comprehensive model for single ring infiltration data. J. Hydrol. 573, 937–951.
https://doi.org/10.1016/j.jhydrol.2019.03.077.
https://doi.org/10.1016/j.jhydrol.2019.03.077.
The authors declare that they have no known competing financial interests or personal relationships that could have appeared to influence the work reported in this paper.
作者声明,不存在任何可能影响本文所报道工作的已知经济利益冲突或个人关系。
Acknowledgments致谢
Financial and technical support from the National Key Research and Development Program of China (grant no. 2017YFC0403605), the National Natural Science Foundation of China (grant no. 41771316), Natural Science Basic Research Program of Shaanxi (2021JC-19), the Shaanxi Innovative Research Team for Key Science and Technology (grant no. 2017KCT-15), CAS ‘Youth Scholar of West China’ Program (grant no. XAB2018A04), and the ‘111’ Project (grant no. B12007) is gratefully acknowledged.
感谢国家重点研发计划(项目编号2017YFC0403605)、国家自然科学基金(项目编号41771316)、陕西省自然科学基础研究计划(2021JC-19)、陕西省重点科技创新团队(项目编号2017KCT-15)、中国科学院“西部青年学者”项目(项目编号XAB2018A04)以及“111”计划(项目编号B12007)提供的资金和技术支持。
Appendix A. Supplementary data附录A. 补充数据
Supplementary data to this article can be found online at https://doi. org/10.1016/j.geoderma.2021.115354.
本文补充数据可在线获取:https://doi. org/10.1016/j.geoderma.2021.115354。
References参考文献
Ahmad, M., Chakraborty, D., Aggarwal, P., Bhattacharyya, R., Singh, R., 2018. Modelling soil water dynamics and crop water use in a soybean-wheat rotation under chisel tillage in a sandy clay loam soil. Geoderma 327, 13–24. https://doi.org/10.1016/j. geoderma.2018.04.014.
Allen, R.G., Pereira, L.S., Raes, D., Smith, M., 1998. Crop evapotranspiration-Guidelines for computing crop water requirements-FAO Irrigation and drainage paper 56. FAO, Rome, p. 300.
Arunrat, N., Pumijumnong, N., Hatano, R., 2018. Predicting local-scale impact of climate change on rice yield and soil organic carbon sequestration: A case study in Roi Et Province, Northeast Thailand. Agr. Syst. 164, 58–70. https://doi.org/10.1016/j. agsy.2018.04.001.
Bai, P., Liu, X.M., Yang, T.T., Liang, K., Liu, C.M., 2016. Evaluation of streamflow simulation results of land surface models in GLDAS on the Tibetan plateau. J. Geophys. Res-Atmos. 121 (20), 12180–12197. https://doi.org/10.1002/ 2016JD025501.
Bao, S.D., 2000. Soil agrochemical analysis. China Agriculture Press, Beijing.
Bi, H.Y., Ma, J.W., Zheng, W.J., Zeng, J.Y., 2016. Comparison of soil moisture in GLDAS model simulations and in situ observations over the Tibetan Plateau. J. Geophys. Res-Atmos. 121 (6), 2658–2678. https://doi.org/10.1002/2015JD024131. Bittelli, M., Ventura, F., Campbell, G.S., Snyder, R.L., Gallegati, F., Pisa, P.R., 2008. Coupling of heat, water vapor, and liquid water fluxes to compute evaporation in bare soils. J. Hydrol. 362, 191–205. https://doi.org/10.1016/j.jhydrol.2008.08.014.
Buckingham, E., 1904. Contributions to our knowledge of aeration of soils. US Bur. Soils Bulletin, 25, U.S. Gov. Print. Off., Washington, D.C.
Cahill, A., Parlange, M., 1998. On water vapor transport in field soils. Water Resour. Res. 34, 731–739. https://doi.org/10.1029/97WR03756.
Cerda, A., 2001. Effects of rock fragment cover on soil infiltration, interrill runoff and erosion. Eur. J. Soil Sci. 52, 59–68. https://doi.org/10.1046/j.1365- 2389.2001.00354.x.
Chung, S.O., Horton, R., 1987. Soil heat and water flow with a partial surface mulch. Water Resour. Res. 23, 2175–2186. https://doi.org/10.1029/wr023i012p02175.
d’Alpoim Guedes, J., 2018. Did foragers adopt farming? A perspective from the margins of the Tibetan Plateau. Quat. Int. 489, 91–100. https://doi.org/10.1016/j. quaint.2016.12.010.
d’Alpoim Guedes, J.A., Lu, H., Hein, A.M., Schmidt, A.H., 2015. Early evidence for the use of wheat and barley as staple crops on the margins of the Tibetan Plateau. Proc. Natl. Acad. Sci. U. S. A. 112, 5625–5630. https://doi.org/10.1073/ pnas.1423708112.
d’Alpoim Guedes, J., Lu, H., Li, Y., Spengler, R.N., Wu, X., Aldenderfer, M.S., 2013. Moving agriculture onto the Tibetan plateau: the archaeobotanical evidence. Archaeol. Anthrop. Sci. 6, 255–269. https://doi.org/10.1007/s12520-013-0153-4.
Daamen, C., Simmonds, L., Wallace, J., Laryea, K., Sivakumar, M., 1993. Use of microlysimeters to measure evaporation from sandy soils. Agr. Forest Meteorol. 65, 159–173. https://doi.org/10.1016/0168-1923(93)90002-Y.
de Rooij, G.H., 2010. Comments on “Improving the Numerical Simulation of Soil Moisture-Based Richards Equation for Land Models with a Deep or Shallow Water Table”. J. Hydrometeorol. 11, 1044–1050. https://doi.org/10.1175/ 2010jhm1189.1.
De Vries, D.A., 1958. Simultaneous transfer of heat and moisture in porous media. Trans. Am. Geophys. Union 39, 909–916. https://doi.org/10.1029/TR039i005p00909.
De Vries, D.A., 1963. Thermal properties of soils, Physics of Plant Environment. North- Holland Publishing Company, Amsterdam, pp. 210–235.
Di Prima, S., Castellini, M., Abou Najm, M.R., Stewart, R.D., Angulo-Jaramillo, R., Winiarski, T., Lassabatere, L., 2019. Experimental assessment of a new
Ding, J., Wang, T., Piao, S., Smith, P., Zhang, G., Yan, Z., Ren, S., Liu, D., Wang, S., Chen, S., Dai, F., He, J., Li, Y., Liu, Y., Mao, J., Arain, A., Tian, H., Shi, X., Yang, Y., Zeng, N., Zhao, L., 2019. The paleoclimatic footprint in the soil carbon stock of the Tibetan permafrost region. Nat. Commun. 10, 4195. https://doi.org/10.1038/ s41467-019-12214-5.
Fan, K.K., Zhang, Q., Singh, V.P., Sun, P., Song, C.Q., Zhu, X.D., Yu, H.Q., Shen, Z.X., 2019. Spatiotemporal impact of soil moisture on air temperature across the Tibet Plateau. Sci. Total Environ. 649, 1338–1348. https://doi.org/10.1016/j. scitotenv.2018.08.399.
Feddes, R.A., Kowalik, P.J., Zaradny, H., 1978. Simulation of field water use and crop yield. In: Centre for Agricultural Publishing and Documentation. Wageningen, the Netherlands, pp. 194–209.
Flerchinger, G.N., Saxton, K.E., 1989. Simultaneous heat and water model of a freezing snow-residue-soil system. I. Theory and development. T. ASAE 32, 565–571.
Gao, B., Farnsworth, J., Smits, K.M., 2020. Evaporation from undulating soil surfaces under turbulent airflow through numerical and experimental approaches. Vadose Zone J. 19 https://doi.org/10.1002/vzj2.20038.
Garcia Gonzalez, R., Verhoef, A., Luigi Vidale, P., Braud, I., 2012. Incorporation of water vapor transfer in the JULES land surface model: Implications for key soil variables and land surface fluxes. Water Resour. Res. 48 https://doi.org/10.1029/ 2011wr011811.
Geiger, S., Durnford, D., 2000. Infiltration in homogeneous sands and a mechanistic model of unstable flow. Soil Sci. Soc. Am. J. 64 (460–469), 2000. https://doi.org/ 10.2136/sssaj2000.642460x.
GordilloRivero, A.J., GarcíaMoreno, J., Jord´ ´an, A., Zavala, L.M., 2014. Effects of rock fragments on water dynamics in a fire-affected soil. Egu General Assembly Conference.
Grifoll, J., Gasto, J.M., Cohen, Y., 2005. Non-isothermal soil water transport and ´ evaporation. Adv. Water Resour. 28, 1254–1266. https://doi.org/10.1016/j. advwatres.2005.04.008.
Harris, R.B., 2010. Rangeland degradation on the Qinghai-Tibetan plateau: A review of the evidence of its magnitude and causes. J. Arid Environ. 74, 1–12. https://doi.org/ 10.1016/j.jaridenv.2009.06.014.
Hou, L., Hu, B. X., Li, H., Wan, L., 2018. Potential impacts of climate variation on potato field evapotranspiration: Field experiment and numerical simulation of potato water use in an arid site. J. Geophys. Res-Atmos. 123. 10,202-210,214, 10.1029/ 2018jd028841.
Hu, G., Zhao, L., Li, R., Wu, T., Wu, X., Pang, Q., Xiao, Y., Qiao, Y., Shi, J., 2015. Modeling hydrothermal transfer processes in permafrost regions of Qinghai-Tibet Plateau in China. Chin. Geogra. Sci. 25, 713–727. https://doi.org/10.1007/s11769- 015-0733-6.
Hu, W., Wang, Y., Li, H., Huang, M., Hou, M., Li, Z., She, D., Si, B., 2019. Dominant role of climate in determining spatio-temporal distribution of potential groundwater recharge at a regional scale. J. Hydrol. 578, 1–13. https://doi.org/10.1016/j. jhydrol.2019.124042.
Kacimov, A. R., Obnosov, Y. V., Simˇ ůnek, J., 2019. Minimizing evaporation by optimal layering of topsoil: Revisiting Ovsinsky’s smart mulching-tillage technology via Gardner-Warrick’s unsaturated analytical model and HYDRUS. Water Resour. Res. 10.1029/2018wr024025.
Kader, M.A., Nakamura, K., Senge, M., Mojid, M.A., Kawashima, S., 2019. Numerical simulation of water- and heat-flow regimes of mulched soil in rain-fed soybean field in central Japan. Soil Till. Res. 191, 142–155. https://doi.org/10.1016/j. still.2019.04.006.
Kidron, G.J., Kronenfeld, R., 2017. Assessing the effect of micro-lysimeters on NRWI: Do micro-lysimeters adequately represent the water input of natural soil? J. Hydrol. 548, 382–390. https://doi.org/10.1016/j.jhydrol.2017.03.005.
Linden, D.R., Dixon, R.M., 1975. Water table position as affected by soil air pressure. Water Resour. Res. 11 (1), 139–143. https://doi.org/10.1029/WR011I001P00139.
Liu, M., Xu, X., Sun, A., Luo, W., Wang, K., 2018a. Why do karst catchments exhibit higher sensitivity to climate change? Evidence from a modified Budyko model. Adv. Water Resour. 122, 238–250. https://doi.org/10.1016/j.advwatres.2018.10.013.
Liu, S., Zamanian, K., Schleuss, P.M., Zarebanadkouki, M., Kuzyakov, Y., 2018b. Degradation of Tibetan grasslands: Consequences for carbon and nutrient cycles. Agr. Ecosyst. Environ. 252, 93–104. https://doi.org/10.1016/j.agee.2017.10.011.
Luo, D.L., Jin, H.J., Bense, V.F., Jin, X.Y., Li, X.Y., 2020. Hydrothermal processes of near-surface warm permafrost in response to strong precipitation events in the Headwater Area of the Yellow River. Tibetan Plateau. Geoderma 376, 114531. https://doi.org/ 10.1016/j.geoderma.2020.114531.
Luo, Z., Kong, J., Shen, C., Lu, C., Hua, G., Zhao, Z., Zhao, H., Li, L., 2019. Evaluation and application of the modified van Genuchten function for unsaturated porous media. J. Hydrol. 571, 279–287. https://doi.org/10.1016/j.jhydrol.2019.01.051.
Martínez, I., Chervet, A., Weisskopf, P., Sturny, W.G., Rek, J., Keller, T., 2016. Two decades of no-till in the Oberacker long-term field experiment: Part II. Soil porosity and gas transport parameters. Soil Till. Res. 163, 130–140. https://doi.org/10.1016/ j.still.2016.05.020.
Massari, C., Brocca, L., Moramarco, T., Tramblay, Y., Lescot, J.F.D., 2014. Potential of soil moisture observations in flood modelling: Estimating initial conditions and correcting rainfall. Adv. Water Resour. 74, 44–53. https://doi.org/10.1016/j. advwatres.2014.08.004.
Miehe, G., Schleuss, P.M., Seeber, E., Babel, W., Biermann, T., Braendle, M., Chen, F., Coners, H., Foken, T., Gerken, T., Graf, H.F., Guggenberger, G., Hafner, S., Holzapfel, M., Ingrisch, J., Kuzyakov, Y., Lai, Z., Lehnert, L., Leuschner, C., Li, X., Liu, J., Liu, S., Ma, Y., Miehe, S., Mosbrugger, V., Noltie, H.J., Schmidt, J., Spielvogel, S., Unteregelsbacher, S., Wang, Y., Willinghofer, S., Xu, X., Yang, Y.,
Zhang, S., Opgenoorth, L., Wesche, K., 2019. The Kobresia pygmaea ecosystem of the Tibetan highlands - Origin, functioning and degradation of the world’s largest pastoral alpine ecosystem: Kobresia pastures of Tibet. Sci. Total Environ. 648, 754–771. https://doi.org/10.1016/j.scitotenv.2018.08.164.
Milly, P.C.D., 1982. Moisture and heat transport in hysteretic, inhomogeneous porous media: A matric head-based formulation and a numerical model. Water Resour. Res. 18, 489–498. https://doi.org/10.1029/WR018i003p00489.
Moldrup, P., Chamindu, D.T.K., Hamamoto, S., Komatsu, T., Kawamoto, K., Rolston, D. E., de Jonge, L.W., 2013. Structure-dependent water-induced linear reduction model for predicting gas diffusivity and tortuosity in repacked and intact soil. Vadose Zone J. 12, 1–11. https://doi.org/10.2136/vzj2013.01.0026.
Olivella, S., Gens, A., 2000. Vapour transport in low permeability unsaturated soils with capillary effects. Transp. Porous Media 40 (2), 219–241. https://doi.org/10.1023/A: 1006749505937.
Pan, C., Zhu, B., Gao, J., Kang, H., Zhu, T., 2018. Quantitative identification of moisture sources over the Tibetan Plateau and the relationship between thermal forcing and moisture transport. Clim. Dynam. 52, 181–196. https://doi.org/10.1007/s00382- 018-4130-6.
Pan, Y., Lyu, S., Li, S., Gao, Y., Meng, X., Ao, Y., Wang, S., 2015. Simulating the role of gravel in freeze-thaw process on the Qinghai-Tibet Plateau. Theor. Appl. Climatol. 127, 1011–1022. https://doi.org/10.1007/s00704-015-1684-7. Parlange, M., Cahill, A., Nielsen, D., Hopmans, J., Wendroth, O., 1998. Review of heat and water movement in field soils. Soil Till. Res. 47, 5–10. https://doi.org/10.1016/ S0167-1987(98)00066-X. Prunty, L., Bell, J., 2007. Infiltration rate vs. gas composition and pressure in soil columns. Soil Sci. Soc. Am. J. 71, 1473–1475. https://doi.org/10.2136/ sssaj2007.0072N.
Qiu, J., 2008. The third pole. Nature 454, 393–396. https://doi.org/10.1038/454393a.
Ramos, T.B., Simˇ ůnek, J., Gonçalves, M.C., Martins, J.C., Prazeres, A., Pereira, L.S., 2012. Two-dimensional modeling of water and nitrogen fate from sweet sorghum irrigated with fresh and blended saline waters. Agr. Water Manage. 111, 87–104. https://doi. org/10.1016/j.agwat.2012.05.007.
Ren, D., Xu, X., Hao, Y., Huang, G., 2016. Modeling and assessing field irrigation water use in a canal system of Hetao, upper Yellow River basin: Application to maize, sunflower and watermelon. J. Hydrol. 532, 122–139. https://doi.org/10.1016/j. jhydrol.2015.11.040.
Ren, Z., Niu, D., Ma, P., Wang, Y., Fu, H., Elser, J.J., 2019. Cascading influences of grassland degradation on nutrient limitation in a high mountain lake and its inflow streams. Ecology 100, 1–13. https://doi.org/10.1002/ecy.2755.
Rücknagel, J., Gotze, P., Hofmann, B., Christen, O., Marschall, K., 2013. The influence of ¨ soil gravel content on compaction behaviour and pre-compression stress. Geoderma 209–210, 226–232. https://doi.org/10.1016/j.geoderma.2013.05.030.
Sadeghi, M., Tuller, M., Warrick, A.W., Babaeian, E., Parajuli, K., Gohardoust, M.R., Jones, S.B., 2019. An analytical model for estimation of land surface net water flux from near-surface soil moisture observations. J. Hydrol. 570, 26–37. https://doi.org/ 10.1016/j.jhydrol.2018.12.038.
Saito, H., Simˇ ůnek, J., Mohanty, B.P., 2006. Numerical analysis of coupled water, vapor, and heat transport in the vadose zone. Vadose Zone J. 5 https://doi.org/10.2136/ vzj2006.0007.
Scanlon, B., Milly, P., 1994. Water and heat fluxes in desert soils.2. Numerical
simulations. Water Resour. Res. 30, 721–733. https://doi.org/10.1029/93WR03252. Schrefler, B.A., Zhan, X., 1993. A fully coupled model for water flow and airflow in deformable porous media. Water Resour. Res. 29, 155–167. https://doi.org/ 10.1029/92wr01737.
Simˇůnek, J., van Genuchten, M.T., 2008. Modeling nonequilibrium flow and transport processes using HYDRUS. Vadose Zone J. 7 https://doi.org/10.2136/vzj2007.0074. Tahiri, A.Z., Anyoji, H., Yasuda, H., 2006. Fixed and variable light extinction coefficients for estimating plant transpiration and soil evaporation under irrigated maize. Agr. Water Manage. 84, 186–192. https://doi.org/10.1016/j.agwat.2006.02.002.
Thomas, H., Sansom, M., 1995. Fully coupled analysis of heat, moisture, and air transfer in unsaturated soil. J. Eng. Mech-ASCE 121, 392–405. https://doi.org/10.1061/ (ASCE)0733-9399(1995)121:3(392).
Touma, J., Vauclin, M., 1986. Experimental and numerical analysis of two-phase infiltration in a partially saturated soil. Transport Porous Med. 1, 27–55. https://doi. org/10.1007/BF01036524.
Ugbaje, S.U., Reuter, H.I., 2013. Functional digital soil mapping for the prediction of available water capacity in Nigeria using legacy data. Vadose Zone J. 12 https://doi. org/10.2136/vzj2013.07.0140.
Van De Griend, A.A., Owe, M., 1994. Bare soil surface resistance to evaporation by vapor diffusion under semiarid conditions. Water Resour. Res. 30, 181–188. https://doi. org/10.1029/93WR02747.
Van Genuchten, M.T., 1980. A closed-form equation for predicting the hydraulic conductivity of unsaturated soils. Soil Sci. Soc. Am. J. 44, 892–898. https://doi.org/ 10.2136/sssaj1980.03615995004400050002x.
Vereecken, H., Weynants, M., Javaux, M., Pachepsky, Y., Schaap, M. G., Genuchten, M. T. v., 2010. Using pedotransfer functions to estimate the van Genuchten–Mualem soil hydraulic properties: A review. Vadose Zone J. 9. 10.2136/vzj2010.0045.
Wang, G.J., Hagan, D.F.T., Lou, D., Chen, T.X., 2016. Evaluation of soil moisture derived from FY3B microwave brightness temperature over the Tibetan Plateau. Remote Sens. Lett. 7 (9), 817–826. https://doi.org/10.1080/2150704X.2016.1192303.
Wang, J.X., Gao, X.D., Zhou, Y.Q., Wu, P.T., Zhao, X.N., 2020. Impact of conservation practices on soil hydrothermal properties and crop water use efficiency in a dry agricultural region of the Tibetan plateau. Soil Till. Res. 200, 104619 https://doi. org/10.1016/j.still.2020.104619.
Wang, Z., Feyen, J., van Genuchten, M.T., Nielsen, D.R., 1998. Air entrapment effects on infiltration rate and flow instability. Water Resour. Res. 34 (2), 213–222. https:// doi.org/10.1029/97WR02804.
Weber, T.K.D., Iden, S.C., Durner, W., 2017. A pore-size classification for peat bogs derived from unsaturated hydraulic properties. Hydrol. Earth Syst. Sc. 21, 6185–6200. https://doi.org/10.5194/hess-21-6185-2017.
Wei, Z., Paredes, P., Liu, Y., Chi, W.W., Pereira, L.S., 2015. Modelling transpiration, soil evaporation and yield prediction of soybean in North China Plain. Agr. Water Manage. 147, 43–53. https://doi.org/10.1016/j.agwat.2014.05.004. Wicky, J., Hauck, C., 2017. Numerical modelling of convective heat transport by air flow in permafrost talus slopes. Cryosphere 11, 1311–1325. https://doi.org/10.5194/tc- 11-1311-2017.
Xue, X., Xu, M.H., You, Q.G., Peng, F., 2014. Influence of Experimental Warming on Heat and Water Fluxes of Alpine Meadows in the Qinghai-Tibet Plateau. Arct. Antarct. Alp. Res. 46 (2), 441–458. https://doi.org/10.1657/1938-4246-46.2.441.
Yamasaki, T., Imoto, H., Hamamoto, S., Nishimura, T., 2017. Determination of the role of entrapped air in water flow in a closed soil pipe using a laboratory experiment. Hydrol. Process. 31, 3740–3749. https://doi.org/10.1002/hyp.11302.
Yang, B., Zhao, X. N., Gao, X. D., Pan, D. L., Huo, G. P., Ye, M. T., 2021. Simulation of Water and Heat Coupling Process in Loess Based on Dry Air-flow Mechanism - A Case Study of an Apple Orchard on Mountain. Acta Pedologica Sinica. (In Chinese with English abstract).
Yang, K., Ye, B.S., Zhou, D.G., Wu, B.Y., Foken, T., Qin, J., Zhou, Z.Y., 2011. Response of hydrological cycle to recent climate changes in the Tibetan Plateau. Clim. Change 109 (3–4), 517–534. https://doi.org/10.1007/s10584-011-0099-4.
Yang, K., Zhu, L., Chen, Y.Y., Zhao, L., Qin, J., Lu, H., Tang, W.J., Han, M.L., Ding, B.H., Fang, N., 2016. Land surface model calibration through microwave data assimilation for improving soil moisture simulations. J. Hydrol. 533, 266–276. https://doi.org/ 10.1016/j.jhydrol.2015.12.018.
Yang, K., Wang, C.H., 2019. Water storage effect of soil freeze-thaw process and its impacts on soil hydro-thermal regime variations. Agr. Forest Meteorol. 265, 280–294. https://doi.org/10.1016/j.agrformet.2018.11.011.
Yao, Z., Zhao, C., Yang, K., Liu, W., Li, Y., You, J., Xiao, J., 2016. Alpine grassland degradation in the Qilian Mountains, China — A case study in Damaying Grassland. Catena 137, 494–500. https://doi.org/10.1016/j.catena.2015.09.021.
Yu, L., Zeng, Y., Su, Z., Cai, H., Zheng, Z., 2016. The effect of different evapotranspiration methods on portraying soil water dynamics and ET partitioning in a semi-arid environment in Northwest China. Hydrol. Earth Syst. Sc. 20, 975–990. https://doi. org/10.5194/hess-20-975-2016.
Yu, L., Zeng, Y., Wen, J., Su, Z., 2018. Liquid-vapor-air flow in the frozen soil. J. Geophys. Res-Atmos. https://doi.org/10.1029/2018jd028502.
Yu, L., Zeng, Y., Su, Z., 2020. Understanding the mass, momentum, and energy transfer in the frozen soil with three levels of model complexities. Hydrol. Earth Syst. Sc. 24 (10), 4813–4830. https://doi.org/10.5194/hess-24-4813-2020.
Zeng, Y., Su, Z., Wan, L., Yang, Z., Zhang, T., Tian, H., Shi, X., Wang, X., Cao, W., 2009. Diurnal pattern of the drying front in desert and its application for determining the effective infiltration. Hydrol. Earth Syst. Sc. 13, 703–714. https://doi.org/10.5194/ hess-13-703-2009.
Zeng, Y., Su, Z., Wan, L., Wen, J., 2011a. Numerical analysis of air-water-heat flow in unsaturated soil: Is it necessary to consider airflow in land surface models? J. Geophys. Res-Atmos. 116 https://doi.org/10.1029/2011jd015835.
Zeng, Y., Su, Z., Wan, L., Wen, J., 2011b. A simulation analysis of the advective effect on evaporation using a two-phase heat and mass flow model. Water Resour. Res. 47 https://doi.org/10.1029/2011wr010701.
Zeng, Y., Su, Z., 2013. Reply to comment by Binayak P. Mohanty and Zhenlei Yang on “A simulation analysis of the advective effect on evaporation using a two-phase heat and mass flow model”. Water Resour. Res. 49, 7836–7840. https://doi.org/10.1002/ 2013wr013764.
Zhang, G., Dong, J., Zhou, C., Xu, X., Wang, M., Ouyang, H., Xiao, X., 2013. Increasing cropping intensity in response to climate warming in Tibetan Plateau. China. Field Crop. Res. 142, 36–46. https://doi.org/10.1016/j.fcr.2012.11.021.
Zhang, Q., Fan, K.K., Singh, V.P., Song, C.Q., Xu, C.Y., Sun, P., 2019. Is Himalayan- Tibetan Plateau “drying”? Historical estimations and future trends of surface soil moisture. Sci. Total Environ. 658, 374–384. https://doi.org/10.1016/j. scitotenv.2018.12.209.
Zhang, T., Zhan, X., Kang, Y., Wan, S., Feng, H., 2016. Improvements of soil salt characteristics and nutrient status in an impermeable saline-sodic soil reclaimed with an improved drip irrigation while ridge planting Lycium barbarum L. J. Soil. Sediment. 17, 1126–1139. https://doi.org/10.1007/s11368-016-1600-5.
Zhao, H., Zeng, Y., Lv, S., Su, Z., 2018. Analysis of soil hydraulic and thermal properties for land surface modeling over the Tibetan Plateau. Earth Syst. Sci. Data 10, 1031–1061. https://doi.org/10.5194/essd-10-1031-2018.
Zheng, D.H., Wang, X., van der Velde, R., Ferrazzoli, P., Wen, J., Wang, Z.L., Schwank, M., Colliander, A., Bindlish, R., Su, Z.B., 2018. Impact of surface roughness, vegetation opacity and soil permittivity on L-band microwave emission and soil moisture retrieval in the third pole environment. Remote Sens. Environ. 209, 633–647. https://doi.org/10.1016/j.rse.2018.03.011.