Article
Hadee Thompson-Morrison 1,* , Elena Moltchanova 2 , Sally Gaw 1 and Brett Robinson 1
1 Department of Physical and Chemical Sciences, University of Canterbury, Christchurch 8041, New Zealand 2 Department of Mathematics and Statistics, University of Canterbury, Christchurch 8041, New Zealand
* Correspondence: hadee.thompson-morrison@protonmail.com
Abstract: Palm kernel expeller (PKE) is a biowaste by-product of palm oil processing in Southeast Asia that is exported as stock fodder. Global production of PKE totals 11M t yr−1, of which New Zealand imports 1.9M t yr−1, worth >USD 325M, most of which supports NZ’s dairy herd of 5.5M cows. We aimed to determine the concentrations of the chemical elements in PKE imported into New Zealand and compare this to pasture, as well as to assess chemical concentrations against maximum tolerable levels (MTLs) in stockfeed for animal health and ruminant requirements. Palm kernel expeller was analysed for a suite of essential and trace elements using a HNO3 digestion and analysis by inductively coupled plasma-mass spectrometry. Palm kernel expeller contained statistically significantly higher concentrations of B, Mg, P, Cr, Mn, Fe, Ni, Cu and Zn than pasture. Magnesium, P and Fe exceeded MTLs in PKE, whereas Al, S, K and Cu were within 90% of their MTL. The N, P and K contained in PKE represent the equivalent of 14%, 20% and 28%, respectively, of dairy fertiliser use in New Zealand. As PKE contained 3.3 mg Cd kg P −1, there may be potential for PKE to offset fertiliser use in dairy systems, with a low Cd source of P. There were statistically significant differences in elemental concentrations between different batches of PKE indicating that this product is not uniform. Further research of the effects of PKE on animal health is recommended. The excess elements contained in PKE may present risks or benefits to dairy farming systems and determining these would be beneficial in protecting both animal health and environmental sustainability.
摘要:棕榈仁粕(PKE)是东南亚棕榈油加工过程中产生的一种生物废弃副产物,作为牲畜饲料出口。全球PKE年产量达11M t yr−1,其中新西兰年进口1.9M t yr−1,价值>USD 325M,大部分用于供养新西兰550万头奶牛。本研究旨在测定进口至新西兰的PKE中化学元素的含量并与牧草进行比较,同时依据饲料中针对动物健康的最大耐受水平(MTLs)及反刍动物需求量对其化学元素含量进行评估。采用HNO3消解、电感耦合等离子体质谱法测定了PKE中一系列必需元素和微量元素。PKE中B、Mg、P、Cr、Mn、Fe、Ni、Cu和Zn的含量显著高于牧草。PKE中Mg、P和Fe超过了MTL,而Al、S、K和Cu达到其MTL的90%以内。PKE所含的N、P和K分别相当于新西兰奶牛养殖肥料用量的14%、20%和28%。由于PKE含3.3 mg Cd kg P −1,PKE作为一种低Cd磷源,可能具有替代奶牛养殖系统部分肥料用量的潜力。不同批次PKE的元素含量存在显著差异,表明该产品并不均一。建议进一步研究PKE对动物健康的影响。PKE中过量的元素可能给奶牛养殖系统带来风险或益处,明确这些风险和益处将有助于保护动物健康和环境可持续性。
Keywords: trace elements; dairy cattle; Elaeis guineensis; Indonesia; New Zealand; copper; iron
关键词:微量元素;奶牛;Elaeis guineensis;印度尼西亚;新西兰;铜;铁
1Introduction引言
Academic Editor: Jeroen Meersmans
学术编辑:Jeroen Meersmans
Received: 13 October 2022 Accepted: 4 November 2022 Published: 26 November 2022
Publisher’s Note: MDPI stays neutral with regard to jurisdictional claims in published maps and institutional affiliations.
出版者声明:MDPI对已出版地图中的管辖权主张及机构隶属关系保持中立。
Copyright: © 2022 by the authors. Licensee MDPI, Basel, Switzerland. This article is an open access article distributed under the terms and conditions of the Creative Commons Attribution (CC BY) license (https:// creativecommons.org/licenses/by/ 4.0/).
版权:© 2022 作者所有。被许可方MDPI,瑞士巴塞尔。本文为开放获取文章,依据知识共享署名(CC BY)许可协议(https:// creativecommons.org/licenses/by/ 4.0/)的条款和条件发布。
Elaeis guineensis (African oil palm) produces edible palm oil and palm kernel oil, which are expressed or solvent extracted from the mesocarp and endosperm, respectively, and palm kernel expeller (PKE), a biowaste product comprising the ground endosperm after oil has been extracted. Palm kernel expeller is sold as a supplementary stockfeed globally. New Zealand is the world’s largest importer of PKE, buying 1.9M t, or approximately 17% of global supply, in 2021 [1,2] at a cost of $327–453 million USD (based on the January–April 2020 spot price range of PKE in New Zealand) [3]. This PKE is shipped from Southeast Asia to New Zealand, primarily for use on dairy farms [4]. The reuse of a biowaste such as PKE may be beneficial in terms of creating circular bio-economies that minimise waste and reuse nutrients, thereby adding value to by-products. However, the use of PKE is contentious, as the production of palm oil and PKE have been linked to deforestation of virgin tropical forests and habitat destruction for endangered animals [5]. The plant and animal nutrients that PKE contains may substantially offset the requirements for fertilisers and animal supplements, respectively. Conversely, the import of non-biologically essential elements or nutrients in excess of agricultural requirements may exacerbate soil contamination and potentially endanger animal or human health [6].
Elaeis guineensis(非洲油棕)可生产食用棕榈油和棕榈仁油,二者分别由中果皮和胚乳经压榨或溶剂浸提获得;此外还产生棕榈仁粕(PKE),这是一种由提油后磨碎的胚乳构成的生物废弃物。PKE在全球范围内作为补充饲料销售。新西兰是全球最大的PKE进口国,2021年购入1.9M t,约占全球供应量的17%[1,2],花费3.27亿~4.53亿美元(基于2020年1—4月新西兰PKE现货价格区间)[3]。这些PKE由东南亚运往新西兰,主要用于奶牛场[4]。对PKE等生物废弃物的再利用有助于构建减少废弃物、循环利用养分的循环生物经济,从而提升副产物的价值。然而,PKE的使用存在争议,因为棕榈油和PKE的生产与原始热带森林砍伐以及濒危动物栖息地破坏相关联[5]。PKE所含的植物和动物养分可能分别在很大程度上替代肥料和动物补充剂的需求。反之,输入非生物必需元素或超出农业需求的养分可能加剧土壤污染,并可能危及动物或人类健康[6]。
The effects of any excess elements contained in PKE on livestock will depend on various factors including the proportion of animals’ diets made up of PKE, as well as trace element (TE) interactions that may help or hinder their metabolism [7]. Excess dietary elements may either be absorbed by the animal or excreted through dung, urine or milk [6,8]. Excess elements may endanger food safety or accumulate in soil. Dairy cattle in New Zealand are routinely monitored for element concentrations in liver and serum [6]. These concentrations may indicate whether these elements are absorbed and metabolised by animals, while elemental concentrations in faeces may indicate what excess elements are likely to be excreted.
PKE中过量元素对牲畜的影响取决于多种因素,包括PKE在动物日粮中所占比例,以及可能促进或阻碍其代谢的微量元素(TE)间相互作用[7]。日粮中过量的元素可能被动物吸收,或经粪便、尿液或乳汁排出[6,8]。过量元素可能危及食品安全或在土壤中累积。新西兰奶牛的肝脏和血清元素含量受到常规监测[6]。这些含量可指示元素是否被动物吸收和代谢,而粪便中的元素含量则可指示哪些过量元素可能被排出。
While palm and palm kernel oils generally contain low levels of TEs [9], in PKE, there is a precedent for TE concentrations, which may approach or exceed Maximum Tolerable Levels (MTLs) for cattle feed. Iron, Cu and As in PKE may reach 6130, 29 and 3.1 mg kg−1, respectively [10–12]. Maximum tolerable levels for these TEs are 500, 40 and 4 mg kg−1, respectively [13,14]. Elevated concentrations of Cu, As and Pb have been measured in the soils where E. guineensis is produced, likely due to the use of agrichemicals which contain TEs as impurities (including phosphate fertilisers) and active ingredients (including Cu-based fungicides) [15]. Post-harvest processing and transport, as well as contamination with other (waste) products, may also contribute substantial concentrations of chemical elements [16,17]. Previous studies measuring chemical elements in PKE have focussed either on a limited number of elements or have deficiencies including a lack of specified PKE sources and chemical methods used for analysis. A wider study that analyses PKE from multiple sources and across multiple years for a wide range of elements is needed to elucidate the chemical profile of PKE and any risks or opportunities it may present for agricultural systems.
尽管棕榈油和棕榈仁油中TE含量通常较低[9],但已有先例表明PKE中TE含量可能接近或超过牛饲料的最大耐受水平(MTLs)。PKE中Fe、Cu和As含量可分别达6130、29和3.1 mg kg−1[10–12],而这些TE的最大耐受水平分别为500、40和4 mg kg−1[13,14]。在种植E. guineensis的土壤中已检测到较高含量的Cu、As和Pb,这可能源于含TE杂质(包括磷肥)和含TE活性成分(包括铜基杀菌剂)的农用化学品的使用[15]。采后加工和运输以及与其他(废弃)产品的混杂也可能带入大量化学元素[16,17]。以往测定PKE中化学元素的研究要么仅关注少数元素,要么存在缺陷,如未明确PKE来源及所用化学分析方法。因此,需要开展更广泛的研究,对多来源、多年份的PKE进行多种元素分析,以阐明PKE的化学特征及其可能给农业系统带来的风险或机遇。
We hypothesised that PKE may contain elevated concentrations of Fe, Cu and As. We aimed to compare the elemental profile of PKE to that of New Zealand pasture and to MTLs for cattle feed and cattle requirements. Additionally, we sought to analyse preliminary data on the Cu concentrations of dairy cattle livers to gain insight into the potential effects of PKE on liver Cu status of dairy herds. We used these data as a pilot study to determine the sample size necessary for a comprehensive study on the effects of PKE on dairy cattle liver Cu concentrations in a New Zealand context. Based on this, we have offered directions for future research.
我们假设PKE可能含有较高含量的Fe、Cu和As。本研究旨在将PKE的元素特征与新西兰牧草以及牛饲料MTL和牛需求量进行比较。此外,我们分析了奶牛肝脏Cu含量的初步数据,以了解PKE对奶牛群肝脏Cu状况的潜在影响。我们将这些数据作为预试验,以确定在新西兰背景下全面研究PKE对奶牛肝脏Cu含量影响所需的样本量。在此基础上,我们提出了未来研究方向。
2Materials and Methods材料与方法
2.1. PKE Collection2.1. PKE采集
Grab samples from five shipments (hereafter referred to as batches) of PKE imported into New Zealand were collected for analysis. Five or six sub-samples were analysed from each batch. Batch #1 and #2 were collected from separate Canterbury farms in May 2021. Batches #3–#5 were collected from a port facility in Timaru, New Zealand, in March 2019 (#3, #4) and March 2020 (#5). Batch #4 had been screened to ≤4 mm while Batch #5 had not been screened and was in chunks >4 mm. Samples were oven dried at 60 ◦C for 48 h.
从进口至新西兰的五批PKE货运(以下称批次)中采集随机样品进行分析。每批次分析5或6个子样品。批次#1和#2于2021年5月采自坎特伯雷两个不同农场。批次#3–#5采自新西兰Timaru的一处港口设施,采集时间分别为2019年3月(#3、#4)和2020年3月(#5)。批次#4已筛分至≤4 mm,而批次#5未经筛分,呈>4 mm的块状。样品在60 ◦C下烘干48 h。
2.2. Pasture Sampling2.2. 牧草采样
Pasture samples—79 in total—were collected from 26 farms across the South Island of New Zealand during the spring (September—November) of 2009. Locations of sample collection are detailed in Supplementary Information S1. A pasture sward was cut from each sampling location 2–3 cm above the ground’s surface. Samples were rinsed with deionised water and dried until a constant weight was achieved at 60 ◦C. Pasture samples were then ground using a Cyclotech grinder.
2009年春季(9—11月)在新西兰南岛26个农场共采集牧草样品79个。采样地点详见补充材料S1。在各采样点距地表2~3 cm处刈割草丛。样品用去离子水冲洗,并于60 ◦C下烘干至恒重。随后用Cyclotech粉碎机研磨牧草样品。
2.3. Pseudo-Total Element Concentrations2.3. 准全量元素含量
Pseudo-total element concentrations (hereafter referred to as total concentrations) for PKE were determined using microwave digestion. Samples (0.20 ± 0.01 g) were weighed into digestion tubes and 5 mL of ~69% HNO3 added. Samples were pre-digested overnight and following this digested using EPA Method 3051A [18] at 230 ◦C for 25 min. An Srl Milestone ultraWAVE single reaction chamber microwave digestion unit was used. With every 11 samples, two reagent blanks and two standard reference materials (SRMs) [19–22] were included for quality assurance. Inductively coupled plasma-mass spectrometry (Agilent Technologies 8900) was used to determine elemental concentrations in the digestates. Recoveries of certified values in SRMs ranged from 79–156% of the published values. A list of elemental recoveries is available in Supplementary Information Table S2.
采用微波消解法测定PKE的准全量元素含量(以下称全量)。称取样品(0.20 ± 0.01 g)于消解管中,加入5 mL ~69% HNO3。样品预消解过夜后,按EPA Method 3051A[18]于230 ◦C消解25 min。所用仪器为Srl Milestone ultraWAVE单反应腔微波消解仪。每11个样品设置2个试剂空白和2个标准参考物质(SRMs)[19–22]用于质量保证。采用电感耦合等离子体质谱仪(Agilent Technologies 8900)测定消解液中的元素含量。SRMs中认证值的回收率为公布值的79%~156%。各元素回收率见补充材料表S2。
Pasture samples (0.5 g) were digested in 5 mL ~69% HNO3 and diluted to 25 mL with ultrapure water (Sartorius Arium®Pro UV), before filtering through Whatman 52 filter paper. Elemental concentrations were determined using inductively coupled plasma– optical emission spectroscopy (Varian 720 ES). Blanks and SRMs NIST [19] were also analysed for quality assurance. Recoveries were 92–105% of the published values.
牧草样品(0.5 g)用5 mL ~69% HNO3消解,以超纯水(Sartorius Arium®Pro UV)定容至25 mL,再经Whatman 52滤纸过滤。采用电感耦合等离子体发射光谱仪(Varian 720 ES)测定元素含量。同时分析空白及SRMs NIST[19]用于质量保证。回收率为公布值的92%~105%。
2.4. Total C and N2.4. 全C和全N
A CN828 elemental analysis by combustion C and N analyser was used to determine total C and N of PKE samples. Blanks and SRMs [23,24] were included in analyses for quality assurance.
采用CN828燃烧法C、N元素分析仪测定PKE样品的全C和全N。分析中加入空白和SRMs[23,24]用于质量保证。
2.5. pH
Palm kernel expeller pH was measured following the method of Blakemore and Searle [25]. Five (± 0.05) g of sample was weighed into a falcon tube and 25 mL of deionised water added. This 1:5 ratio was used in place of the more common 1:2.5 ratio due to PKE’s high organic matter content. Samples were then stirred vigorously and left to stand overnight. The pH of each sample was measured with a Hach HQ440d multi pH probe.
PKE的pH按Blakemore和Searle[25]的方法测定。称取5(± 0.05)g样品于离心管中,加入25 mL去离子水。由于PKE有机质含量高,采用1:5的比例代替更常用的1:2.5比例。随后剧烈搅拌样品并静置过夜。用Hach HQ440d多参数pH探头测定各样品的pH。
2.6. Cattle Liver Data2.6. 牛肝脏数据
Secondary data on elemental concentrations in dairy cattle livers were collected from a New Zealand veterinary practice for a preliminary investigation into potential effects of PKE on dairy cattle liver TE status. During routine screening of dairy herds’ nutritional status, liver biopsies were collected from dairy cows by veterinary staff and TE concentrations including copper were analysed in an IANZ-accredited veterinary pathology laboratory. This biopsy collection and analysis was completed as part of routine dairy herd management and was not undertaken on behalf of the authors. No ethical approval was required for this as the purpose of the biopsies was veterinary in nature. Data from 11 farms were collated by veterinary staff and passed on to the authors with the permission of farmers under the condition of farm anonymity. Between five and seven cows were sampled from each farm using convenience sampling. Liver data from a total of 58 cows were used for this analysis. Data were also provided on whether the farms fed PKE and if so at what rates, other feeds utilised and TE supplements that cows were receiving. Reported feeding rates of PKE were between 0.5–2.0 kg PKE cow−1 and cows were fed varying combinations of grass, grain, baleage and fodder beet. Every cow analysed from farms feeding PKE had been fed PKE, and it is unlikely that any of the cows analysed consumed any PKE from the same batches, as were analysed by the authors in this study; however, this cannot be confirmed.
为初步探究PKE对奶牛肝脏TE状况的潜在影响,从新西兰一家兽医诊所收集了奶牛肝脏元素含量的二手数据。在奶牛群营养状况的常规筛查中,兽医人员采集奶牛肝脏活检样品,并在经IANZ认证的兽医病理实验室分析包括铜在内的TE含量。该活检采集与分析属于常规奶牛群管理工作,并非受作者委托开展。由于活检目的属兽医性质,无需伦理审批。11个农场的数据由兽医人员整理,并在农场主许可且农场匿名的条件下提供给作者。采用便利抽样法从每个农场抽取5~7头奶牛,共使用58头奶牛的肝脏数据进行分析。同时提供了各农场是否饲喂PKE及其饲喂量、所用其他饲料以及奶牛所接受的TE补充剂等信息。报告的PKE饲喂量为0.5~2.0 kg PKE cow−1,奶牛饲喂不同组合的牧草、谷物、青贮草包和饲用甜菜。来自饲喂PKE农场的所有被分析奶牛均饲喂过PKE,且被分析奶牛不太可能食用过与本研究作者所分析批次相同的PKE,但这一点无法确认。
2.7. Calculation of Nutrient Inputs to Soils through PKE2.7. 经PKE输入土壤的养分计算
Considering the elemental concentrations in PKE, the quantities of N, P and K imported into New Zealand through PKE were calculated. These calculations used New Zealand’s 2021 import figure of 1.85 Mt PKE [26] and the average concentration of N, P and K in our five PKE batches. These imported quantities were compared to New Zealand’s annual fertiliser N, P and K use in dairy systems, based upon quantities of fertiliser sold in New Zealand in 2019 (the most recent figure available) [27] and the proportion of N, P and K fertilisers in New Zealand utilised by dairy farms [28].
根据PKE中的元素含量,计算了经PKE进口至新西兰的N、P和K数量。计算采用新西兰2021年PKE进口量1.85 Mt[26]及本研究五批PKE中N、P和K的平均含量。将这些进口量与新西兰奶牛养殖系统每年的N、P和K肥料用量进行比较,后者基于2019年(可获得的最新数据)新西兰肥料销售量[27]及新西兰N、P和K肥料中奶牛场所用比例[28]。
2.8. Statistical Analysis2.8. 统计分析
Statistical analyses were conducted using R (version 4.1.0) [29]. A one-way analysis of variance (ANOVA) was used to determine whether any statistically significant differences in mean elemental concentrations existed between batches of PKE. Where assumptions of normality were not met, data were log-transformed. Where assumptions of homoscedasticity were not met, a parametric permutational ANOVA was used to determine the robustness of the parametric ANOVA. The results of the parametric and non-parametric ANOVAs did not differ. Tukey’s honest significant difference (HSD) test was implemented in multcomp package [30] to determine which batches were significantly different from each other when ANOVA identified statistically significant differences.
统计分析使用R(version 4.1.0)[29]进行。采用单因素方差分析(ANOVA)检验不同批次PKE的元素平均含量是否存在显著差异。数据不满足正态性假设时进行对数转换。不满足方差齐性假设时,采用置换ANOVA检验参数ANOVA结果的稳健性。参数与非参数ANOVA结果无差异。当ANOVA检出显著差异时,利用multcomp软件包[30]中的Tukey真实显著差异(HSD)检验确定哪些批次间存在显著差异。
For each element mean concentrations in PKE and pasture were compared using repeated measures ANOVA. The packages lme4 [31] and lmerTest [32] were used for this analysis.
对每种元素,采用重复测量ANOVA比较PKE与牧草中的平均含量。该分析使用lme4[31]和lmerTest[32]软件包。
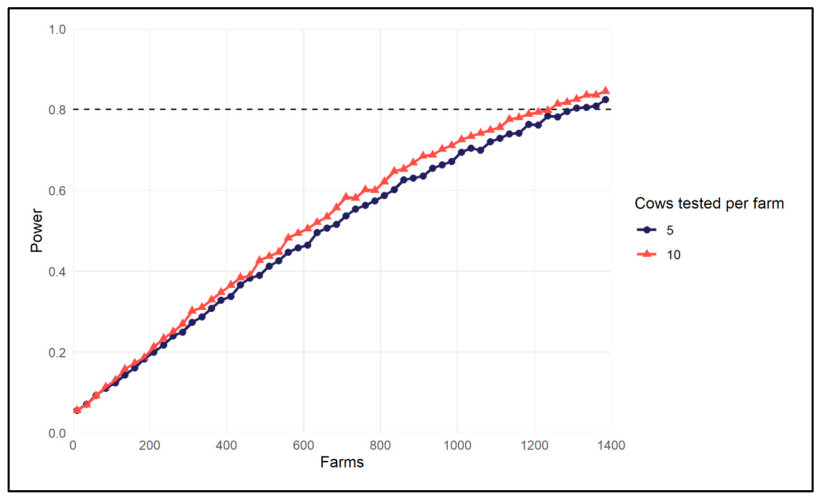
Repeated measures ANOVA was used to compare the average Cu contents in the livers of dairy cattle between the farms with and without PKE in their feed. This was implemented via the lme4 and lmerTest packages. A post-hoc power analysis was run on this data to determine the statistical power with the current sample size. A power curve was then produced for the number of farms ranging from 10 to 1400, with five cows per farm in order to determine the minimum number of farms required to detect the observed effect at 5% significance level with at least 80% probability. It was then repeated for ten cows per farm. The power curve estimation was based on 103 simulations for each setting.
采用重复测量ANOVA比较饲料中含与不含PKE的农场奶牛肝脏平均Cu含量,通过lme4和lmerTest软件包实现。对该数据进行事后功效分析,以确定当前样本量下的统计功效。随后绘制农场数为10~1400、每个农场5头奶牛时的功效曲线,以确定在5%显著性水平下以至少80%概率检测到所观测效应所需的最少农场数。之后又以每个农场10头奶牛重复上述分析。功效曲线估计基于每种设置103次模拟。
3Results and Discussion结果与讨论
3.1. Elements in Palm Kernel Expeller3.1. 棕榈仁粕中的元素
3.1.1. Essential Plant or Animal Nutrients3.1.1. 植物或动物必需养分
Macronutrients大量元素
Nitrogen is commonly used as an indicator for protein (not measured here) in food studies [33]. Mean N concentrations in PKE ranged from 2.0–2.2%. This is lower than concentrations measured in previous studies (Table 1). Nitrogen was statistically significantly higher in PKE (2.0–2.2%) than in E. guineensis endosperms (1.3–1.4%) [9]. Palm oils contain only 0.8% of the N contained in a whole fruit bunch (the fruit bunch cut from the tree containing whole E. guineensis fruitlets as well as the surrounding plant material) [34] meaning that the N concentrations in PKE are likely to reflect ca. 99% of N present in endosperms. It is unlikely that higher N concentrations in PKE are a result of contamination and therefore it is possible that the PKE we analysed was manufactured from plant material with higher N concentrations than have been reported by Thompson-Morrison and Gaw [9], Corley and Tinker [35], Woittiez and Slingerland [36], Rafflegeau and Michel-Dounias [37], Law and Zaharah [38] and Ng et al., as cited in Corley and Tinker [35], all of whom reported N deficiency in E. guineensis plant material. Alternatively, the higher N in PKE may result from the post-harvest mixing with other high N material, as reported in fish meal and soybean meal [17,39,40].
在食品研究中,氮通常被用作蛋白质(本研究未测定)的指标[33]。PKE中N平均含量为2.0%~2.2%,低于以往研究的测定值(表1)。PKE中N含量(2.0%~2.2%)显著高于E. guineensis胚乳(1.3%~1.4%)[9]。棕榈油仅含整个果串(从树上割下的果串,包含完整的E. guineensis小果及周围植物材料)中0.8%的N[34],这意味着PKE中的N含量可能反映了胚乳中约99%的N。PKE中较高的N含量不太可能源于污染,因此,本研究所分析的PKE可能由N含量高于以下文献报道的植物材料制成:Thompson-Morrison和Gaw[9]、Corley和Tinker[35]、Woittiez和Slingerland[36]、Rafflegeau和Michel-Dounias[37]、Law和Zaharah[38]以及Ng et al.(引自Corley和Tinker[35]),这些研究均报道了E. guineensis植物材料缺N。另一种可能是,PKE中较高的N源于采后与其他高N物料的混合,此类情况在鱼粉和豆粕中已有报道[17,39,40]。
Mean P in batches of PKE ranged from 5229–7265 mg kg−1 (Table 1). This concentration range is comparable to the total range previously reported in Malaysian PKE of 4800–7900 mg kg−1 [10,11,41]. The mean concentrations of K in the analysed PKE ranged from 5834–18,927 mg kg−1. A previous study found Malaysian PKE contained 7600–9300 mg kg−1 K [11], while PKE used in the United Kingdom contained 6900 mg kg−1 K [13]. Mean Mg in PKE ranged from 2723–6209 mg kg−1 (Table 1). All batches exceeded concentrations of Mg in Malaysian PKE from Yeong [10] of 2700 mg kg−1, and Batches #1 and #2 exceeded the range of 1600–3300 mg kg−1 in Malaysian PKE reported by Alimon [11]. Sulphur in PKE ranged from 1916–2745 mg kg−1 which was comparable to previously reported concentrations (Table 1).
各批次PKE中P平均含量为5229~7265 mg kg−1(表1),与以往报道的马来西亚PKE总体范围4800~7900 mg kg−1相当[10,11,41]。所分析PKE中K平均含量为5834~18,927 mg kg−1。以往研究发现马来西亚PKE含K 7600~9300 mg kg−1[11],而英国所用PKE含K 6900 mg kg−1[13]。PKE中Mg平均含量为2723~6209 mg kg−1(表1)。所有批次均超过Yeong[10]报道的马来西亚PKE中Mg含量2700 mg kg−1,批次#1和#2超过了Alimon[11]报道的马来西亚PKE范围1600~3300 mg kg−1。PKE中S含量为1916~2745 mg kg−1,与以往报道含量相当(表1)。
| ~~PKE Batch~~~~PKE批次~~ | ~~1 (n = 5)~~ | ~~2 (n = 5)~~ ~~+~~ | 3 (n = 6) ~~ǂ~~ | 4 (n = 6) ~~ǂ~~ | 5 (n = 6) ~~ǂ~~ | ~~Concentration~~ ~~Reported~~ ~~from Other~~ ~~Sources~~~~其他~~ ~~来源~~ ~~报道的~~ ~~含量~~ | ~~s~~ ~~Pasture Con-~~ ~~centration~~~~s~~ ~~牧草~~ ~~含量~~ | ~~Cattle Feed~~ ~~MTL~~ �~~牛饲料~~ ~~MTL~~ � | ~~Cattle Re-~~ ~~quirements~~ ~~‡~~~~牛~~ ~~需求量~~ ~~‡~~ |
|---|---|---|---|---|---|---|---|---|---|
| ~~C (%)~~ | ~~47 (0.45)~~ ~~a~~ | ~~49 (0.81) ~~~~b~~ | ~~49 (0.36) ~~~~b~~ | ~~48 (0.31) ~~~~ab~~ | ~~47 (0.26) ~~~~ab~~ | ~~—~~ | ~~43 ~~~~ꭗ~~ | ~~—~~ | ~~—~~ |
| ~~N (%)~~ | ~~2.2(0.09) ~~a | ~~2.1(0.11) ~~a | ~~2.0(0.12) ~~a | ~~2.2(0.03) ~~a | ~~2.1(0.02) ~~a | ~~2.2 ~~~~҂~~ ~~2.9 ~~~~Ʇ~~ | ~~2.0 ~~~~ꭗ~~ | ~~—~~ | ~~—~~ |
| ~~P~~ | ~~5251 (107) ~~~~a~~ | ~~5229 (90) ~~~~a~~ | ~~5923 (100) ~~~~ab~~ | ~~7265 (160) ~~~~c~~ | ~~6325 (330) ~~~~b~~ | ~~6500 ~~~~Ⴡ ǁ~~ ~~7900 ~~~~ɣ~~ ~~4800–7100 ~~~~ǁ~~ | ~~3404 (148)~~ | ~~6000~~ | ~~3100~~ |
| K * | 17,034 (950) ~~c~~ | 18,927 (496) ~~c~~ | 6065 (45) ~~ab~~ | 6757 (187) ~~b~~ | 5834 (243) ~~a~~ | ~~8000 ~~~~Ⴡ ǁ~~ 7600–9300 ǁ | 22,428 (1265) | 20,000 | 10,000 |
| ~~Mg ~~ | ~~5948 (277) ~~~~b~~ | ~~6209 (146) ~~~~b~~ | ~~2826 (24) ~~~~a~~ | ~~3083 (128) ~~~~a~~ | ~~2723 (107) ~~~~a~~ | ~~3000 ~~~~Ⴡ ǁ~~ ~~2700 ~~~~ɣ~~ ~~1600–3300 ~~~~ǁ~~ | ~~998 (48)~~ | ~~6000~~ | ~~1400~~ |
| ~~S *~~ | ~~2038 (44) ~~~~ab~~ | ~~1916 (37) ~~~~a~~ | ~~2148 (27) ~~~~ab~~ | ~~2745 (92) ~~~~c~~ | ~~2325 (136) ~~~~b~~ | ~~1900–2300 ~~~~ǁ~~ | ~~2538 (105)~~ | ~~3000 (high~~ ~~concentrate)~~ ~~5000 (high~~ ~~forage)~~ | ~~2000~~ |
| ~~B~~ | ~~18(3.5) ~~a | ~~20(2) ~~a | ~~24(1.4) ~~a | ~~21(1.9) ~~a | ~~20(2.6) ~~a | ~~—~~ | ~~6.4(0.41)~~ | ~~150~~ | ~~—~~ |
| ~~Na~~ | ~~280 (71) ~~b | ~~63 (35) ~~~~a~~ | ~~145 (17) ~~ab | ~~131 (18) ~~~~a~~ | ~~126 (14) ~~~~a~~ | ~~200 ~~~~Ⴡ~~ | ~~2226 (282)~~ | ~~—~~ | ~~1200~~ |
| ~~Cr~~ | ~~4.8 (0.2) ~~~~a~~ | ~~5.5 (3.1) ~~~~a~~ | ~~2.5 (0.1) ~~~~a~~ | ~~4.0 (0.58) ~~~~a~~ | ~~2.3 (0.49) ~~~~a~~ | ~~—~~ | ~~0.90 (0.13)~~ | ~~100~~ | ~~—~~ |
| ~~Mn~~ | ~~317 (7.6) ~~~~a~~ | ~~298 (9.3) ~~~~a~~ | ~~271 (0.92) ~~~~a~~ | ~~468 (40) ~~~~b~~ | ~~302 (31) ~~~~a~~ | ~~225 ~~~~ɣ~~ ~~132–340 ~~~~ǁ~~ | ~~119 (10)~~ | ~~2000~~ | ~~25~~ |
| ~~Fe~~ | ~~2406 (174) ~~~~c~~ | ~~786 (29) ~~~~b~~ | ~~624 (49) ~~~~ab~~ | ~~624 (28) ~~~~ab~~ | ~~447 (107) ~~~~a~~ | ~~4.1 ~~~~ɣ~~ ~~835–6130 ~~~~ǁ~~ | ~~433 (97)~~ | ~~500~~ | ~~40~~ |
| ~~Co~~ | ~~0.68 (0.07) ~~~~c~~ | ~~0.1 (0) ~~~~ab~~ | ~~0.07 (0.02) ~~~~ab~~ | ~~0.13 (0.02) ~~~~b~~ | ~~0.03 (0.02) ~~~~a~~ | ~~—~~ | ~~0.93 (0.16)~~ | ~~25~~ | ~~0.06~~ |
| ~~Cu *~~ | ~~28 (0.43) ~~~~b~~ | ~~29 (0.61) ~~~~b~~ | ~~22 (0.32) ~~~~a~~ | ~~36 (1.1) ~~~~c~~ | ~~27 (1.8) ~~~~b~~ | ~~22 ~~~~Ⴡ ǁ~~ ~~29 ~~~~ɣ~~ ~~21–29 ~~~~ǁ~~ | ~~6.9 (0.28)~~ | ~~40 ~~~~ꟻ~~ | ~~9–11~~ |
| ~~Zn~~ | ~~54 (0.65) ~~~~bc~~ | ~~47 (1.2) ~~~~ab~~ | ~~44 (0.53) ~~~~a~~ | ~~59 (1.4) ~~~~c~~ | ~~49 (3.1) ~~~~ab~~ | ~~77 ~~~~ɣ~~ ~~41–50 ~~~~ǁ~~ | ~~27 (1.5)~~ | ~~500~~ | ~~25~~ |
| ~~Mo~~ | ~~0.42 (0.04) ~~~~a~~ | ~~0.42 (0.02) ~~~~a~~ | ~~0.33 (0.02) ~~~~a~~ | ~~0.35 (0.03) ~~~~a~~ | ~~0.43 (0.03) ~~~~a~~ | ~~0.70–0.79 ~~~~ǁ~~ | ~~0.43 (0.061)~~ | ~~5~~ | ~~—~~ |
+ Na n = 2. ǂ C, N n = 5. � [13]. Although PKE can be used as a stockfeed for animals including sheep, goats and poultry, MTLs specific to cows are used where available as the prevailing use for PKE as a stockfeed is in New Zealand dairy farms [1,4]. ‡ [42]. ꭗ [43]. ҂ [44]. Ʇ [45]. Ⴡ [41]. ǁ [11]. ɣ [10]. ꟻ Based on Mo 1–2 mg kg−1 and S 1500–2500 mg kg−1, Cu may become toxic at lower doses if Mo and S are below these values.
+ Na n = 2。ǂ C、N n = 5。� [13]。尽管PKE可作为绵羊、山羊和家禽等动物的饲料,但由于PKE作为饲料的主要用途是在新西兰奶牛场[1,4],因此在可获得时采用牛专用的MTL。‡ [42]。ꭗ [43]。҂ [44]。Ʇ [45]。Ⴡ [41]。ǁ [11]。ɣ [10]。ꟻ 基于Mo 1–2 mg kg−1和S 1500–2500 mg kg−1;若Mo和S低于该值,Cu可能在较低剂量下即产生毒性。
Micronutrients微量养分
The mean Fe concentrations in PKE (447–2406 mg kg−1) were of comparable ranges in Malaysian PKE of 835–6130 mg kg−1 [11]. The Fe present in PKE is likely a result of processing or shipping that occurs post-harvest, and not a result of plant uptake. This is corroborated by the lower Fe concentrations reported in E. guineensis plant tissues by Thompson-Morrison and Gaw [9], and the recognition that production and storage processes are potential sources of contamination—particularly heavy metals—for palm products [16]. Metal contamination of PKE has been a known issue, evidenced by regulations for screening and magnet-scanning of PKE imported into New Zealand [46].
PKE中Fe平均含量(447~2406 mg kg−1)与马来西亚PKE的范围835~6130 mg kg−1相当[11]。PKE中的Fe可能源于采后加工或运输过程,而非植物吸收。Thompson-Morrison和Gaw[9]报道的E. guineensis植物组织中较低的Fe含量,以及生产和储存过程被认为是棕榈产品污染(尤其是重金属污染)的潜在来源[16],均佐证了这一点。PKE的金属污染是已知问题,新西兰对进口PKE实施筛分和磁选检测的法规即为明证[46]。
The mean Cu in PKE ranged from 22–36 mg kg−1. This concentration range is higher than has been previously reported in PKE (Table 1). Copper may enter PKE as a result of Cu-fungicide use in oil palm plantations where it is applied directly to soil and plants [47]. It can then be absorbed by plants and transported to fruit tissues [48].
PKE中Cu平均含量为22~36 mg kg−1,高于以往PKE的报道值(表1)。Cu可能来源于油棕种植园中直接施用于土壤和植物的铜基杀菌剂[47],随后被植物吸收并转运至果实组织[48]。
The concentrations of Mn (271–468 mg kg−1) and Zn (44–59 mg kg−1) in the PKE we analysed were higher than ranges previously reported from Malaysian PKE (Table 1).
本研究所分析PKE中Mn(271~468 mg kg−1)和Zn(44~59 mg kg−1)含量高于以往马来西亚PKE的报道范围(表1)。
Concentrations of Mo in PKE were less than those previously reported which is consistent with Mo deficiencies in the soils and leaves of E. guineensis [9,15].
PKE中Mo含量低于以往报道值,这与E. guineensis土壤和叶片缺Mo相一致[9,15]。
3.1.2. Non-Essential Elements3.1.2. 非必需元素
Concentrations of Ag, Cd, Sb, Te, Au and Hg in PKE were ≤0.03 mg kg−1 and unlikely to pose toxicity risks (Table 2). Concentrations of TEs including Ti, As, Sr and Pb were higher in PKE (11–179, 0.20–0.52, 11–26 and 0.27–1.2 mg kg−1, respectively) compared to E. guineensis endosperms (0.30–0.39, <0.01, 3.9–5.0 and 0.021–0.031 mg kg−1, respectively)—the plant material PKE is produced from [9]. These TEs may have entered PKE through pathways other than plant uptake, including contamination during processing and shipping.
PKE中Ag、Cd、Sb、Te、Au和Hg含量均≤0.03 mg kg−1,不太可能构成毒性风险(表2)。与生产PKE的原料E. guineensis胚乳(分别为0.30~0.39、<0.01、3.9~5.0和0.021~0.031 mg kg−1)[9]相比,PKE中Ti、As、Sr和Pb等TE含量更高(分别为11~179、0.20~0.52、11~26和0.27~1.2 mg kg−1)。这些TE可能经植物吸收以外的途径进入PKE,包括加工和运输过程中的污染。
| Batch批次 | ~~1(n = 5)~~ | ~~2(n = 5)~~ | ~~3(n = 6) ~~+ | ~~4(n = 6) ~~+ | ~~5 (n = 6)~~ ǂ | ~~Concentrations~~ ~~Reported~~ ~~from other~~ Sources~~其他~~ ~~来源~~ ~~报道的~~ 含量 | ~~Pasture~~ ~~Concentration~~~~牧草~~ ~~含量~~ | ~~Cattle Feed~~ ~~MTL~~~~牛饲料~~ ~~MTL~~ |
|---|---|---|---|---|---|---|---|---|
| Al | ~~2767 (97) ~~c | ~~867 (211) ~~b | ~~420 (88) ~~ab | ~~226 (34) ~~a | ~~257 (82) ~~a | ~~178~~ � | ~~469 (127)~~ | ~~1000 ~~‡ |
| ~~Ti~~ | ~~179 (13) ~~~~e~~ | ~~25 (0.95) ~~d | ~~19 (1.5) ~~~~c~~ | ~~15 (0.38) ~~b | ~~11 (0.51) ~~~~a~~ | ~~—~~ | ~~—~~ | ~~—~~ |
| ~~Ni~~ | ~~2.3 (0.05) ~~~~ab~~ | ~~1.8 (0.2)~~ ~~a~~ | ~~1.4 (0.05)~~ ~~a~~ | ~~4.2 (0.77) ~~~~b~~ | ~~1.6 (0.16)~~ ~~a~~ | ~~—~~ | ~~0.77 (0.070)~~ | ~~100~~ ~~‡~~ |
| As | ~~0.52 (0.05)~~ ~~b~~ | ~~0.31 (0.04)~~ ~~ab~~ | ~~0.29 (0.02)~~ ~~a~~ | ~~0.20 (0.04)~~ ~~a~~ | ~~0.24 (0.07)~~ ~~a~~ | ~~0.18–3.1~~ ~~ꭗ~~ | ~~0.41 (0.030)~~ | ~~30 ~~‡ ~~4 ~~Ʇ |
| Sr | ~~26 (0.94) ~~~~b~~ | ~~12 (0.3) ~~~~a~~ | ~~11 (0.41) ~~~~a~~ | ~~21 (2.7) ~~~~b~~ | ~~11 (0.5) ~~~~a~~ | ~~—~~ | ~~—~~ | ~~2000 ~~‡ |
| Zr | 0.49 (0.06) c | 0.025 (0.02) a | ~~0.13 (0.02) ~~b | ~~0.17 (0.01) ~~b | ~~0.12 (0.02) ~~ab | — | — | — |
| Ag | ~~<0.01~~~~a~~ | ~~<0.01~~~~a~~ | ~~<0.01~~~~a~~ | ~~<0.01~~~~a~~ | ~~<0.01~~~~a~~ | ~~—~~ | ~~—~~ | ~~—~~ |
| ~~Cd~~ | 0.024 (0.0024) ~~bc~~ | ~~<0.01~~~~a~~ | 0.023 (0.0021) ~~bc~~ | ~~0.027 (0.0021) ~~~~c~~ | 0.017 (0.0021) ~~ab~~ | ~~—~~ | ~~0.14 (0.014)~~ | 10 ‡ ~~1~~ ~~Ʇ~~ |
| Sb | 0.018 (0.0012) ~~a~~ | 0.021 (0.0028) ~~a~~ | 0.021 (0.0030) ~~a~~ | 0.022 (0.0039) ~~a~~ | 0.014 (0.0021) ~~a~~ | — | — | — |
| Te | 0.014 (0.0012) c | ~~<0.01~~b | ~~<0.01~~ab | <0.01a | <0.01a | — | — | — |
| ~~Cs~~ | ~~1.1 (0.037) ~~d | ~~0.80 (0.032) ~~c | ~~0.43 (0.021) ~~b | ~~0.22 (0.060) ~~a | ~~0.35 (0.022) ~~ab | ~~—~~ | ~~—~~ | ~~—~~ |
| ~~Ce~~ | ~~3.7 (0.28)~~ ~~b~~ | ~~0.24 (0.024)~~ ~~a~~ | ~~0.22 (0.060)~~ ~~a~~ | ~~0.15 (0.022)~~ ~~a~~ | ~~0.10 (0)~~ ~~a~~ | ~~—~~ | ~~—~~ | ~~—~~ |
| Au | ~~<0.01~~~~b~~ | ~~<0.01~~~~b~~ | ~~<0.01~~~~a~~ | ~~<0.01~~~~a~~ | ~~<0.01~~~~a~~ | ~~—~~ | ~~—~~ | ~~—~~ |
| ~~Hg~~ | ~~<0.01~~a | ~~<0.01~~a | ~~<0.01~~a | ~~<0.01~~a | ~~<0.01~~a | ~~—~~ | — | 2 ~~‡~~ 0.1 Ʇ |
| Pb | 1.2 (0.084) b | 0.35 (0.024) a | 0.44 (0.10) a | 0.30 (0.058) a | 0.27 (0.067) a | — | 0.37 (0.054) | 100 ‡ 10 Ʇ |
+ C, N n = 5. ǂ Ag, C, N n = 5. � [49]. ‡ [13]. ꭗ [12]. Ʇ [14].
All batches contained higher concentrations of Al than Malaysian PKE (sourced in New Zealand in a previous study), which measured 178 mg kg−1 [49]. The range of As present in our analysed PKE—0.20–0.52 mg kg−1—was within the range of As in Malaysian PKE of 0.18–3.05 mg kg−1 [12]. Some of the As levels reported by Hammid and Kuntom [12] were within 75% of the MTL for As in cattle feed (4 mg kg−1), and thus this element has been identified as an element of concern in PKE [50]. The As present in the PKE we analysed indicates that concentrations in PKE imported into New Zealand are low and not of concern, which falsifies our hypothesis that PKE would contain elevated As concentrations. Given the large variation in sample TE concentrations, it is possible that some batches will contain unacceptable As concentrations.
所有批次的Al含量均高于马来西亚PKE(以往一项研究在新西兰获取的样品),后者为178 mg kg−1[49]。本研究所分析PKE中As含量范围(0.20~0.52 mg kg−1)处于马来西亚PKE中As含量范围0.18~3.05 mg kg−1之内[12]。Hammid和Kuntom[12]报道的部分As含量达到牛饲料As MTL(4 mg kg−1)的75%以内,因此As被认定为PKE中需关注的元素[50]。本研究所分析PKE中的As表明进口至新西兰的PKE中As含量较低、无需担忧,这否定了PKE含较高As的假设。鉴于样品TE含量变异较大,部分批次仍可能含有不可接受的As含量。
3.2. Implications for Stock Fodder3.2. 对牲畜饲料的影响
Compared to pasture, PKE contained higher concentrations of essential elements P, Cr, Mg, B, Mn, Fe, Cu and Zn. Concentrations Mg, Al, P and Fe in PKE exceeded the MTL for cattle feed in one or more batches, while S, K and Cu were within 90% of MTLs in one or more batches (Table 1). Except for Al, these elements are essential for livestock and thus their high concentrations in PKE may represent a potential benefit if animals are deficient in these elements or grazed on deficient soils, or conversely a risk if their concentrations are high enough to induce toxicity in animals. All other elements analysed were either below MTLs for cattle feed, or values for MTLs or cattle requirements could not be identified. If elements were within 50% of their MTL they were noted and discussed, as this is a benchmark commonly used in environmental monitoring [51]. Effects of TEs contained in PKE on animal health and nutrition will be dependent on the diet-proportionality of PKE which is determined on-farm.
与牧草相比,PKE中必需元素P、Cr、Mg、B、Mn、Fe、Cu和Zn含量更高。PKE中Mg、Al、P和Fe含量在一个或多个批次中超过牛饲料MTL,而S、K和Cu在一个或多个批次中达到MTL的90%以内(表1)。除Al外,这些元素均为牲畜必需元素,因此,若动物缺乏这些元素或在缺素土壤上放牧,PKE中的高含量可能带来潜在益处;反之,若含量高到足以引起动物中毒,则构成风险。所分析的其他元素要么低于牛饲料MTL,要么无法确定其MTL或牛需求量。达到MTL 50%以内的元素予以标注并讨论,因为这是环境监测中常用的基准[51]。PKE中TE对动物健康和营养的影响取决于PKE在日粮中的比例,而这由农场自行决定。
Phosphorus exceeded the MTL for cattle feed of 6000 mg kg−1 in Batches #4 and #5 at 7265 and 6325 mg kg−1, respectively, and was within 87% of the MTL in Batches #1–#3 (5229–5923 mg kg−1). Exceedance of this MTL has also been previously reported in Malaysian PKE (Table 1). Effects of excess P in the diet depend on its bioavailability and solubility, and the concentration of other elements including Ca. In cows, the majority of dietary excess P is excreted once nutrient requirements have been met and no adverse health outcomes or effects on milk production have been observed as a result of excessive P in the diet [8]. Phosphorus is excreted via milk as well as urine and faeces [52], so excess P through PKE may affect milk composition. The factors governing P excretion via milk are not fully understood and may vary between cows [52]. Excess P can adversely interact with Mg, and Ca: P ratios <1:1 in feed are likely to affect animal health and performance regardless of whether P concentrations are below the MTL [53]. A Ca: P ratio of between 1:1 and 6:1 is tolerated in cattle, and if this is well-managed, P concentrations in feedstock above the MTL can be tolerated [53]. Both Ca and P have been flagged by the National Research Council as being of concern for toxicity in livestock. The excretion of excess P may present a substantial input of nutrients to grazed soils in addition to calculated fertiliser inputs, increasing the risk of eutrophication of surface water bodies through runoff of topsoil and nutrients. On-farm nutrient balance calculations which consider inputs through PKE may be beneficial in determining and mitigating this risk.
批次#4和#5中P含量分别为7265和6325 mg kg−1,超过牛饲料MTL 6000 mg kg−1;批次#1–#3(5229~5923 mg kg−1)达到MTL的87%以内。以往马来西亚PKE中也曾报道超过该MTL的情况(表1)。日粮中过量P的影响取决于其生物有效性和溶解度,以及Ca等其他元素的含量。在奶牛中,满足养分需求后,大部分日粮过量P被排出,且未观察到日粮P过量导致的不良健康后果或对产奶量的影响[8]。P可经乳汁以及尿液和粪便排出[52],因此PKE带来的过量P可能影响乳成分。经乳汁排P的调控因素尚未完全明确,且可能因个体而异[52]。过量P可与Mg发生不利相互作用,且饲料中Ca:P比<1:1时,无论P含量是否低于MTL,均可能影响动物健康和生产性能[53]。牛可耐受1:1至6:1的Ca:P比,若管理得当,可耐受饲料中高于MTL的P含量[53]。Ca和P均被美国国家研究委员会(National Research Council)列为需关注的牲畜毒性元素。过量P的排泄可能在计算的肥料输入之外向放牧土壤输入大量养分,通过表土和养分径流增加地表水体富营养化的风险。在农场养分平衡计算中考虑经PKE的输入,可能有助于确定并减缓这一风险。
Batches #1 and #2 contained 17,034 and 18,927 mg kg−1 of K, respectively, which were within 85% of the MTL of 20,000 mg kg−1. All PKE contained lower concentrations of K than pasture. Potassium has been flagged by the National Research Council [13] as being of potential concern for toxicity, and excess K, while usually excreted in urine [54], can interfere with absorption of Ca and Mg [13].
批次#1和#2的K含量分别为17,034和18,927 mg kg−1,达到MTL 20,000 mg kg−1的85%以内。所有PKE的K含量均低于牧草。K已被美国国家研究委员会[13]列为潜在需关注的毒性元素;过量K虽通常经尿液排出[54],但可干扰Ca和Mg的吸收[13]。
Magnesium exceeded the MTL for cattle feed of 6000 mg kg−1 in Batch #2 (6209 mg kg−1) and was within 99% of the MTL in Batch #1 (5928 mg kg−1). All Batches exceeded cattle requirement concentrations for Mg of 1400 mg kg−1. The excess Mg in PKE may be beneficial in the prevention of milk fever, as Mg supplementation is often used for this purpose [55]. This benefit may be realised during pre- and post-calving when Mg supplements are traditionally used. While excess dietary Mg is excreted in urine in dairy cows, Mg-rich diets may lead to an increase in phosphatic calculi (kidney stones) in animals if the diet is also high in P [13]. As PKE contains higher concentrations of both Mg and P than pasture, monitoring dairy herds for signs of kidney stones may be beneficial when feeding high rates of PKE.
批次#2中Mg(6209 mg kg−1)超过牛饲料MTL 6000 mg kg−1,批次#1(5928 mg kg−1)达到MTL的99%以内。所有批次均超过牛的Mg需求量1400 mg kg−1。由于补充Mg常用于预防产乳热[55],PKE中过量的Mg可能对此有益。这一益处可在传统上使用Mg补充剂的产犊前后时期体现。尽管奶牛日粮中过量的Mg经尿液排出,但若日粮中P含量也较高,富Mg日粮可能导致动物磷酸盐结石(肾结石)增加[13]。由于PKE中Mg和P含量均高于牧草,在大量饲喂PKE时,监测奶牛群的肾结石征兆可能是有益的。
Concentrations of S approached the MTL for high-concentrate diets (3000 mg kg−1) in all batches of PKE, which ranged from 1916–2745 mg kg−1. Cattle requirements (2000 mg kg−1) were exceeded in every batch except Batch #2. For cattle fed a highforage diet, the MTL for S is 5000 mg kg−1 and thus any risk associated with S in PKE will depend on the individual feeding patterns of farms [13]. Despite higher MTLs, adverse effects on growth performance may be possible when cattle are fed diets with
所有批次PKE中S含量(1916~2745 mg kg−1)均接近高精料日粮的MTL(3000 mg kg−1)。除批次#2外,各批次均超过牛需求量(2000 mg kg−1)。对于饲喂高粗饲料日粮的牛,S的MTL为5000 mg kg−1,因此PKE中S相关风险取决于各农场的具体饲喂模式[13]。尽管MTL较高,但当牛饲喂含
>2000 mg kg−1 S [53]. Our results exceeded the previously reported range of S in Malaysian PKE, 1900–2300 mg kg−1 [11].
>2000 mg kg−1 S的日粮时,仍可能对生长性能产生不利影响[53]。本研究结果超过了以往报道的马来西亚PKE中S含量范围1900~2300 mg kg−1[11]。
Iron exceeded the MTL of 500 mg kg−1 in Batches #1–4 (624–2406 mg kg−1) and was within 89% of the MTL in Batch #5 (447 mg kg−1). Chronic Fe toxicity in mammals causes damage to the intestinal tract and liver and delays in blood clot formation [56]. Excessive Fe intake in bovines can reduce milk production and decrease body weight, with <30 mg kg−1 day−1 estimated as the minimum harmful dose [57]. Cattle deaths due to suspected Fe toxicity have occurred when fed feedstuffs containing 1992 mg kg−1 Fe [58]. The effects of excessive Fe intake will of course depend on the solubility and bioavailability of Fe in the diet [42].
批次#1–4中Fe(624~2406 mg kg−1)超过MTL 500 mg kg−1,批次#5(447 mg kg−1)达到MTL的89%以内。哺乳动物慢性Fe中毒会损伤肠道和肝脏,并延迟血凝块形成[56]。牛过量摄入Fe可降低产奶量和体重,估计最低有害剂量为<30 mg kg−1 day−1[57]。曾有牛因饲喂含Fe 1992 mg kg−1的饲料而疑似Fe中毒死亡[58]。过量Fe摄入的影响当然取决于日粮中Fe的溶解度和生物有效性[42]。
Mean Cu in PKE was within 55–90% of the MTL (40 mg kg−1) in all five batches. Copper may become toxic at lower levels than MTLs suggest if Mo and S are not present in the diet at concentrations of 1–2 and 1500–2500 mg kg−1, respectively [13]. It has been suggested that excess TEs in PKE such as Cu may present a potential benefit to livestock in countries where soils are deficient in essential nutrients, such as New Zealand [50]. The plausibility of this depends heavily on TE interactions and possible antagonism with respect to elements found in PKE. Effects of excess dietary Cu will be affected by the S, Mn, Fe, Zn and Mo (all Cu antagonists) concentrations in animal feed [11,13,42]. For example, intake of dry matter containing 500–800 mg kg−1 Fe has been shown to cause depressed Cu concentrations in serum and livers of dairy cattle due to interference with Cu metabolism [59,60]. Thus, benefits which may be provided through the addition of Cu to animals’ diets through PKE may be negated by the antagonistic effects of Fe also present in PKE. Investigating this would be beneficial, as in New Zealand Cu supplements for livestock are often reduced when feeding PKE [41]. Alimon [11] noted that animals may develop symptoms of Cu-toxicity when their diets contain >50% PKE. Mortality rates in sheep fed PKE were 100% when their diet was not supplemented with Zn [61]. This was attributed to Cu-toxicity. Appropriate management of elements in animals’ diets is essential if using PKE as a stockfeed, and future studies should address the digestibility/bioavailability of elements in PKE, and interactions that occur between these including K and Mg, Mg and P, and Fe and Cu.
所有五个批次中PKE的Cu平均含量均达到MTL(40 mg kg−1)的55%~90%。若日粮中Mo和S含量未分别达到1~2和1500~2500 mg kg−1,Cu可能在低于MTL的水平下即产生毒性[13]。有观点认为,在新西兰等土壤缺乏必需养分的国家,PKE中Cu等过量TE可能对牲畜有潜在益处[50]。这一设想的合理性在很大程度上取决于PKE中各元素间的TE相互作用及可能的拮抗作用。日粮过量Cu的效应将受动物饲料中S、Mn、Fe、Zn和Mo(均为Cu拮抗元素)含量的影响[11,13,42]。例如,研究表明摄入含Fe 500~800 mg kg−1的干物质会干扰Cu代谢,导致奶牛血清和肝脏Cu含量降低[59,60]。因此,经PKE向动物日粮添加Cu可能带来的益处,可能被PKE中同时存在的Fe的拮抗作用所抵消。鉴于新西兰在饲喂PKE时常减少牲畜Cu补充剂用量[41],对此开展研究将是有益的。Alimon[11]指出,当日粮中PKE比例>50%时,动物可能出现Cu中毒症状。饲喂PKE的绵羊在日粮未补充Zn时死亡率达100%[61],这被归因于Cu中毒。若将PKE用作饲料,对动物日粮中元素进行合理管理至关重要;未来研究应关注PKE中元素的消化率/生物有效性,以及元素间的相互作用,包括K与Mg、Mg与P以及Fe与Cu。
Aluminium was the only non-essential element in PKE that exceeded MTLs. The mean Al concentration of Batch #1 (2767 mg kg−1) exceeded the MTL of 1000 mg kg−1, while Batch #2 was within 86% of the MTL at 867 mg kg−1. No cases of Al toxicity in cattle as a result of Al in feedstock could be identified, although Al is identified as a potentially toxic element by the National Research Council [13]. A risk assessment of the excess Al and other elements contained in PKE and their potential effects on animal health is recommended.
Al是PKE中唯一超过MTL的非必需元素。批次#1的Al平均含量(2767 mg kg−1)超过MTL 1000 mg kg−1,批次#2为867 mg kg−1,达到MTL的86%以内。尽管美国国家研究委员会将Al认定为潜在有毒元素[13],但未发现因饲料中Al导致牛Al中毒的案例。建议对PKE中过量的Al及其他元素及其对动物健康的潜在影响开展风险评估。
Batches contained statistically significantly different concentrations of both essential and non-essential elements, and thus the non-uniformity of PKE should be factored into decisions surrounding its use where animal mineral nutrition is concerned, as consistent levels of elements in each batch cannot be relied upon. Statistically significant differences existed between the pH of different batches of PKE (5.4–5.5). This may be a result of variation in production conditions, including fertiliser and pesticide applications in oil palm plantations [62]. Palm kernel expeller contained statistically significantly higher concentrations (p < 0.05) of B, Mg, P, Cr, Mn, Fe, Ni, Cu and Zn compared to pasture and thus may be a dietary source of these elements. Concentrations of Na, K, Co and Cd were statistically significantly lower (p < 0.05) in PKE than in pasture, while concentrations of Al, S, As, Mo and Pb were comparable between PKE and pasture (Table 1). Palm kernel expeller represents a substantial source of TEs for farm systems utilising this by-product.
各批次中必需和非必需元素含量均存在显著差异,因此在涉及动物矿质营养时,关于PKE使用的决策应考虑其不均一性,因为不能依赖各批次元素水平的一致性。不同批次PKE的pH(5.4~5.5)存在显著差异,这可能源于生产条件的差异,包括油棕种植园中肥料和农药的施用[62]。与牧草相比,PKE中B、Mg、P、Cr、Mn、Fe、Ni、Cu和Zn含量显著更高(p < 0.05),因此可能成为这些元素的日粮来源。PKE中Na、K、Co和Cd含量显著低于牧草(p < 0.05),而Al、S、As、Mo和Pb含量在PKE与牧草间相当(表1)。对于使用该副产物的农场系统而言,PKE是TE的重要来源。
In addition to effects on animal health and performance, excess dietary elements may affect the composition of meat and milk products, as well as elemental concentrations of grazed soils [8,53]. This may have implications for the use of mineral supplements for livestock. On-farm mass-balance calculations that take into account element inputs through PKE would be beneficial in understanding the tangible and long-lasting impacts the use of PKE may have on importing agricultural systems. However, the variation in concentrations of essential nutrients (Mg, P, S, K, Cu and Zn) across PKE batches will make farm nutrient balance calculations complex.
除影响动物健康和生产性能外,日粮中过量元素还可能影响肉类和乳制品的成分以及放牧土壤的元素含量[8,53]。这可能对牲畜矿物质补充剂的使用产生影响。在农场物质平衡计算中考虑经PKE输入的元素,将有助于了解PKE的使用对进口国农业系统可能产生的实际和长期影响。然而,不同批次PKE中必需养分(Mg、P、S、K、Cu和Zn)含量的差异将使农场养分平衡计算变得复杂。
3.3. Pilot Study Using Dairy Cattle Liver Data3.3. 基于奶牛肝脏数据的预试验
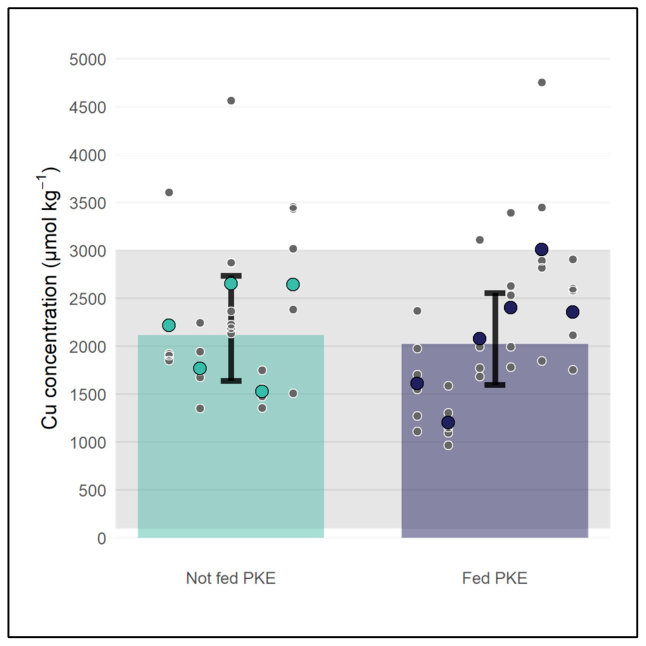
The potential effects of PKE on animal health concerning TEs may be elucidated by preliminary analysis of data on the TE status of dairy cattle livers. Our analysis failed to find a statistically significant difference (p = 0.804) between the liver Cu concentrations of cows fed PKE and those not fed PKE using data from 11 farms in Canterbury. A weighted mean estimate for cows fed PKE was 2023 µmol kg−1 while cows not fed PKE had a mean estimated liver Cu concentration of 2116 µmol kg−1 (Figure 1). Both fall within the adequate range of 95–3000 µmol kg−1. The variation in cows both between farms and within farms is large, and some individual cows have liver Cu concentrations above the adequate range (Figure 1). The lack of statistical difference in the liver chemistry between the PKE-fed cows and the non-PKE-fed cows may be due, in part, to the limited sample size. Our analysis did not have sufficient statistical power to draw generalisable conclusions. A more extensive study is required to determine categorically whether PKE affects liver chemistry. A comprehensive study assessing the potential effects of PKE on liver Cu concentrations in dairy cattle would require approximately 1310 farms with five cows sampled each to achieve statistical power—the probability that an existing effect will be detected—of 0.8 at a 5% statistical significance level. (Figure 2). This would represent data from approximately 12% of New Zealand’s dairy herd. Testing a larger number of cows from each farm would slightly decrease the number of farms needed: if testing 10 cows from each farm, approximately 1260 farms would be needed (Figure 2). Despite the large number of farms required, this data is routinely collected from dairy herds and thus such a study may be feasible with a dedicated effort. The primary challenge would be coordination between researchers and veterinarians and the increased administration on the part of vet practices around gaining farmers’ consent for the study as well as anonymising and sending data. Our preliminary analysis shows no clear evidence for PKE having profound effects on animal Cu status. However future work is clearly needed to confirm this.
通过对奶牛肝脏TE状况数据的初步分析,可以阐明PKE在TE方面对动物健康的潜在影响。利用坎特伯雷11个农场的数据,我们的分析未发现饲喂与未饲喂PKE的奶牛肝脏Cu含量存在显著差异(p = 0.804)。饲喂PKE奶牛的加权平均估计值为2023 µmol kg−1,而未饲喂PKE奶牛的肝脏Cu平均估计含量为2116 µmol kg−1(图1),二者均处于适宜范围95~3000 µmol kg−1之内。农场间和农场内奶牛的变异均较大,部分个体奶牛的肝脏Cu含量高于适宜范围(图1)。饲喂PKE与未饲喂PKE奶牛的肝脏化学组成缺乏统计学差异,部分原因可能在于样本量有限。本分析的统计功效不足以得出可推广的结论。需要开展更大规模的研究,才能明确判断PKE是否影响肝脏化学组成。一项全面评估PKE对奶牛肝脏Cu含量潜在影响的研究,需要约1310个农场、每个农场采集5头奶牛,才能在5%统计显著性水平下达到0.8的统计功效(即检测到真实存在效应的概率)(图2)。这相当于新西兰约12%奶牛群的数据。增加每个农场的检测奶牛数会略微减少所需农场数:若每个农场检测10头奶牛,约需1260个农场(图2)。尽管所需农场数量庞大,但这些数据是奶牛群的常规采集数据,因此经专门努力,此类研究可能是可行的。主要挑战在于研究人员与兽医之间的协调,以及兽医诊所在征得农场主同意、数据匿名化和数据传送方面增加的行政工作量。我们的初步分析未显示PKE对动物Cu状况有显著影响的明确证据,但显然需要进一步研究加以证实。
3.4. Elements in PKE as Soil Nutrient Inputs3.4. PKE中元素作为土壤养分输入
Given dairy systems in New Zealand use 63% of total N fertiliser, 36% of total P fertiliser and 56% of total K fertiliser [28], N, P and K inputs to dairy systems through PKE represent the equivalent of 14%, 20% and 24% of total nutrient inputs through fertilisers, respectively (Table 3). In comparison, the equivalent amount of N, P and K fertilisers in New Zealand based on June 2022 prices [63] and exchange rates would cost approximately USD 78M for N (as urea), USD 39M for P (as superphosphate) and USD 22M for K (as standard KCl)—a total of USD 138M (Table 2). This represents approximately one third of New Zealand’s total expenditure on PKE [3]. Thus, there may be potential to offset the use of fertiliser nutrients on dairy systems through PKE. However, the economic and environmental cost of shipping PKE between continents should be factored into any calculations of this offset.
鉴于新西兰奶牛养殖系统使用了全部N肥的63%、P肥的36%和K肥的56%[28],经PKE输入奶牛养殖系统的N、P和K分别相当于经肥料输入养分总量的14%、20%和24%(表3)。相比之下,按2022年6月价格[63]和汇率计算,新西兰等量N、P和K肥料的费用约为:N(以尿素计)USD 78M,P(以过磷酸钙计)USD 39M,K(以标准KCl计)USD 22M,合计USD 138M(表2)。这约占新西兰PKE总支出的三分之一[3]。因此,通过PKE替代奶牛养殖系统部分肥料养分用量可能具有潜力。然而,在计算此类替代量时,应将跨洲运输PKE的经济和环境成本考虑在内。
| Element元素 | NZ Dairy Farm Fertiliser Use (t yr−1)新西兰奶牛场 肥料用量(t yr−1) | Mean NZ Imports through PKE (t yr−1)新西兰经PKE 平均进口量(t yr−1) | Mean Fertiliser Equivalent Imports through PKE to NZ Dairy Farms (t yr−1)经PKE进入新西兰 奶牛场的平均 肥料等效输入量(t yr−1) | Fertiliser Equivalent Cost (USD)肥料等效 成本(USD) |
|---|---|---|---|---|
| N | 284,760 | 39,258 | 14% | 77,879,500 |
| P | 55,440 | 11,097 | 20% | 38,500,729 |
| K | 73,360 | 20,208 | 28% | 21,756,711 |
Using an average concentration of Cd in PKE, we calculated that the Cd:P ratio in PKE is 3.3 mg Cd kg P−1. Phosphate fertilisers in New Zealand contain on average 184 mg Cd kg P−1, and are voluntarily capped at 280 mg Cd kg P−1 [64]. This is due to New Zealand’s history of high-Cd phosphate fertiliser use, leading to issues of Cd accumulation in productive soils [65]. This accumulation presents risks for food chain transfer and land use flexibility. Palm kernel expeller represents a low-Cd source of P for farms and may have potential for the offsetting of high-Cd phosphate fertiliser use. Offtake of P by animals is assumed negligible, as most excess dietary P is excreted [8]; however, the bioavailability of excreted nutrients including P is not clear. As some elements may be excreted in milk [6,8], the potential for release into milk for the range of excess dietary elements contained in PKE should be assessed. The bioavailability of excreted elements through urine and faeces warrants investigation to determine the feasibility of any fertiliser offsets through PKE.
利用PKE中Cd的平均含量,我们计算得PKE的Cd:P比为3.3 mg Cd kg P−1。新西兰磷肥平均含184 mg Cd kg P−1,并自愿限定上限为280 mg Cd kg P−1[64]。这是由于新西兰历史上长期使用高Cd磷肥,导致生产性土壤中出现Cd累积问题[65]。这种累积带来了食物链传递风险并限制了土地利用的灵活性。PKE是农场的一种低Cd磷源,可能具有替代高Cd磷肥使用的潜力。由于日粮中大部分过量P被排出[8],假定动物对P的带走量可忽略不计;然而,包括P在内的排泄养分的生物有效性尚不明确。由于部分元素可能经乳汁排出[6,8],应评估PKE所含各种过量日粮元素进入乳汁的可能性。经尿液和粪便排出元素的生物有效性值得研究,以确定通过PKE替代肥料的可行性。
The practicality of offsetting fertiliser use would also depend on several factors including cost, feeding methods and TE concentrations in PKE. Importantly, imports of Cu and Zn to farm systems should be considered. Based on our PKE analyses, Cu and Zn have average concentrations in PKE of 28 and 50 mg kg−1, respectively. In total, an average of 53 t Cu and 93 t Zn are brought into New Zealand dairy systems through PKE each year. Zinc is fed to cows to prevent facial eczema, particularly in warm, humid farming environments, and this has led to Zn accumulation in soils in some areas of New Zealand [66]. It is unclear how much further inputs of Zn, such as those through PKE, may exacerbate this issue. As mentioned in Section 3.2, there are potential benefits to animal nutrition from the Cu contained in PKE; however, a full investigation into the interaction of Cu with other TEs and the resulting bioavailability of Cu to animals is needed to understand this. Furthermore, as nutrients contained in PKE are applied to farm soils through animal excretions, their distribution to pasture should be considered. Unlike fertiliser applications which are evenly applied to pasture, animal urine and faeces are concentrated and non-uniform and this may exacerbate the challenges of ‘urine patches’ [67], whereby concentrated nutrient excretions lead to increased nutrient losses.
替代肥料使用的可行性还取决于成本、饲喂方式和PKE中TE含量等多种因素。重要的是,应考虑Cu和Zn向农场系统的输入。根据本研究的PKE分析,PKE中Cu和Zn平均含量分别为28和50 mg kg−1。每年经PKE进入新西兰奶牛养殖系统的Cu和Zn平均分别为53 t和93 t。饲喂奶牛Zn用于预防面部湿疹,尤其是在温暖湿润的养殖环境中,这已导致新西兰部分地区土壤中Zn累积[66]。经PKE等途径进一步输入的Zn会在多大程度上加剧这一问题尚不清楚。如3.2节所述,PKE中所含Cu对动物营养具有潜在益处;然而,需要全面研究Cu与其他TE的相互作用及由此产生的Cu对动物的生物有效性,才能理解这一点。此外,由于PKE中的养分通过动物排泄物进入农场土壤,应考虑其在草地上的分布。与均匀施用于草地的肥料不同,动物尿液和粪便集中且分布不均,这可能加剧“尿斑”问题[67],即集中的养分排泄导致养分损失增加。
Potentially, other biowastes sourced in New Zealand may provide similar benefits to PKE for agricultural systems in terms of beneficial nutrient inputs. Each year, a total of 2.2M t of biowastes, including horticultural and viticultural wastes, are produced in New Zealand, of which the majority end up in landfill [68]. Further work might assess the suitability of some of these locally sourced biowastes for potential use as stock fodder. Reducing the transport requirements of stock fodder may further contribute to the creation of circular bio-economies, recovering resources from and thus adding value to waste products which can be used to sustainably feed New Zealand’s agricultural sector.
在有益养分输入方面,新西兰本地的其他生物废弃物可能为农业系统提供与PKE类似的益处。新西兰每年共产生2.2M t生物废弃物,包括园艺和葡萄栽培废弃物,其中大部分最终进入填埋场[68]。未来研究可评估其中部分本地生物废弃物作为牲畜饲料的适用性。减少牲畜饲料的运输需求可进一步促进循环生物经济的构建,从废弃物中回收资源并提升其价值,进而可持续地供养新西兰农业部门。
4Conclusions结论
Potentially, the chemical elements in PKE may offset nutrient deficiencies in agricultural systems. However, concentrations of Mg, Al, P and Fe exceeded MTLs for cattle feed and concentrations of S, K and Cu in PKE were within 90% of the MTL for cattle feed in one or more batches analysed. Concentrations of B, Mg, P, Cr, Mn, Fe, Ni, Cu and Zn were higher in PKE compared to pasture. Nutrient management on farms utilising PKE may be complicated by the statistically significant differences in essential and non-essential elements between batches of PKE. Our preliminary data analysis did not show a profound effect on liver Cu concentrations explained by the feeding of PKE to dairy cattle. The power analysis indicated that data from around 1300 farms would be needed to achieve adequate statistical power to produce meaningful and extrapolatable results if investigating potential effects of PKE on dairy cattle liver Cu concentrations. The concentrations of N, P and K represent a substantial source of nutrients into New Zealand dairy farms that may have potential for offsetting fertiliser use. In particular, PKE is low in Cd with a P: Cd ratio of 3.3 mg Cd kg P−1. Thus, PKE may be useful as a low-Cd source of P. There is potential for future work to assess the feasibility of PKE to offset fertiliser use, including investigating the bioavailability of excreted nutrients, the potential excretions of elements through milk and any potential effects of excess elements such as Cu and Zn on dairy soils. Additionally, a risk assessment concerning elements that breach MTLs in PKE would be beneficial to ensuring that the use of this by-product as a supplementary stockfeed is sustainable.
PKE中的化学元素有可能弥补农业系统中的养分缺乏。然而,Mg、Al、P和Fe的浓度超过了牛饲料的最大耐受水平(MTL),且在所分析的一个或多个批次中,PKE中S、K和Cu的浓度达到牛饲料MTL的90%以内。与牧草相比,PKE中B、Mg、P、Cr、Mn、Fe、Ni、Cu和Zn的浓度更高。由于不同批次PKE之间必需元素和非必需元素存在统计学显著差异,使用PKE的农场在养分管理上可能更为复杂。我们的初步数据分析未显示饲喂PKE对奶牛肝脏Cu浓度有显著影响。功效分析表明,若要研究PKE对奶牛肝脏Cu浓度的潜在影响,需要约1300个农场的数据才能获得足够的统计功效,从而得出有意义且可外推的结果。PKE中N、P和K的含量构成了新西兰奶牛场养分输入的重要来源,有望抵消部分化肥施用。尤其值得注意的是,PKE的Cd含量较低,P:Cd比为3.3 mg Cd kg P−1。因此,PKE可作为一种低Cd的P源加以利用。未来的研究可评估利用PKE抵消化肥施用的可行性,包括考察排泄养分的生物有效性、元素经乳汁的潜在排出,以及Cu和Zn等过量元素对奶牛场土壤的潜在影响。此外,针对PKE中超过MTL的元素开展风险评估,将有助于确保这一副产品作为补充饲料的可持续利用。
Supplementary Materials: The following supporting information can be downloaded at: https:// www.mdpi.com/article/10.3390/su142315752/s1, Table S1: Sampling locations for pasture; Table S2: SRM recoveries of elements. Reference [69] is cited in the supplementary materials.
补充材料:以下支持信息可从 https:// www.mdpi.com/article/10.3390/su142315752/s1 下载,表S1:牧草采样地点;表S2:元素的标准参考物质(SRM)回收率。补充材料中引用了参考文献[69]。
Author Contributions: H.T.-M. Writing—original draft, formal analysis, investigation. E.M. Writing— review and editing, formal analysis, visualisation. S.G. Writing—review and editing, supervision. B.R. Writing—review and editing, supervision. All authors have read and agreed to the published version of the manuscript.
作者贡献:H.T.-M.:撰写初稿、形式分析、调查研究。E.M.:审阅与修改、形式分析、可视化。S.G.:审阅与修改、指导。B.R.:审阅与修改、指导。所有作者均已阅读并同意本稿的发表版本。
Funding: This work is derived from the Centre for Integrated Biowaste Research funded by Strategic Science Investment Funding from Ministry of Business, Innovation and Employment, New Zealand (contract C03X1701). The lead author gratefully acknowledges the receipt of a University of Canterbury Doctoral Scholarship.
基金资助:本研究源自综合生物废弃物研究中心(Centre for Integrated Biowaste Research),该中心由新西兰商业、创新与就业部(Ministry of Business, Innovation and Employment)战略科学投资基金资助(合同号C03X1701)。第一作者衷心感谢坎特伯雷大学博士奖学金的资助。
Data Availability Statement: The data that support the findings of this study will be made openly available at www.kiwiscience.com.
数据可用性声明:支持本研究结果的数据将在 www.kiwiscience.com 公开发布。
Acknowledgments: We gratefully acknowledge the help of Vet Life and the Canterbury farmers who have provided data and samples required for this research.
致谢:衷心感谢Vet Life以及为本研究提供所需数据和样品的坎特伯雷农场主。
Conflicts of Interest: The authors declare no conflict of interest.
利益冲突:作者声明无利益冲突。
References参考文献
1. Index Mundi. Palm Kernel Meal Imports by Country in 1000 MT. 2022. Available online: https://www.indexmundi.com/ agriculture/?commodity=palm-kernel-meal&graph=imports (accessed on 10 May 2022).
2. Index Mundi. Palm Kernel Meal Production by Country in 1000 MT. 2022. Available online: https://www.indexmundi.com/ agriculture/?commodity=palm-kernel-meal&graph=production (accessed on 9 June 2022).
3. DairyNZ. DairyNZ PKE Pricing Analysis; DairyNZ: Hamilton, New Zealand, 2020.
4. MPI. Importation of Palm Kernel Expeller from Indonesia: MPI Audit Report; MPI: Wellington, New Zealand, 2015.
5. Morgans, C.L.; Meijaard, E.; Santika, T.; Law, E.; Budiharta, S.; Ancrenaz, M.; Wilson, K.A. Evaluating the effectiveness of palm oil certification in delivering multiple sustainability objectives. Environ. Res. Lett. 2018, 13, 064032. [CrossRef]
6. Grace, N.D.; Knowles, S.O. Trace element supplementation of livestock in New Zealand: Meeting the challenges of free-range grazing systems. Vet. Med. Int. 2012, 2012, 639472. [CrossRef]
7. Grace, N.; Knowles, S.; Hittmann, A. High and variable copper status identified among dairy herds in the Waikato region by concentrations of Cu in liver sourced from biopsies and cull cows. N. Z. Vet. J. 2010, 58, 130–136. [CrossRef] [PubMed]
8. Wu, Z.; Satter, L.; Blohowiak, A.; Stauffacher, R.; Wilson, J. Milk production, estimated phosphorus excretion, and bone characteristics of dairy cows fed different amounts of phosphorus for two or three years. J. Dairy Sci. 2001, 84, 1738–1748. [CrossRef] [PubMed]
9. Thompson-Morrison, H.; Ariantiningsih, F.; Arief, S.M.; Gaw, S.; Robinson, B. Chemical elements in plants and oils from current and former palm oil production systems. Sci. Rep. 2022. submitted.
10. Yeong, S. The nutritive value of palm kernel cake as a feedstuff for poultry. In Proceedings of the A Nutritional Workshop on Oil Palm by-Products Utilization, Kualalumpur, Malysia, 14–15 December 1981.
11. Alimon, A.R. The nutritive value of palm kernel cake for animal feed. Palm Oil Dev. 2004, 40, 12–14.
12. Hammid, A.A.; Kuntom, A.; Ismail, R.; Pardi, N. Arsenic in palm kernel expeller using microwave digestion and graphite furnace atomic absorption spectrophotometry method. Int. J. Basic Appl. Sci. 2013, 1, 641–649.
13. National Research Council. Mineral Tolerance of Animals, 2nd ed.; National Academic Press: Washington, DC, USA, 2005.
14. European Union. Directive 2002/32/EC of the European Parliament and of the Council of 7 May 2002 on undesirable substances in animal feed-Council statement; European Union: Maastricht, The Netherlands, 2002.
15. Thompson-Morrison, H.; Ariantiningsih, F.; Arief, S.M.; Gaw, S.; Robinson, B. Chemical elements in soils of current and former palm oil production systems. Geoderma Regional. 2022. submitted.
16. Szydłowska-Czerniak, A.; Trokowski, K.; Karlovits, G.; Szłyk, E. Spectroscopic determination of metals in palm oils from different stages of the technological process. J. Agric. Food Chem. 2013, 61, 2276–2283. [CrossRef]
17. Tangendjaja, B. Quality Control of Feed Ingredients for Aquaculture, in Feed and Feeding Practices in Aquaculture; Davis, D.A., Ed.; Woodhead Publishing: Sawston, UK, 2015; pp. 141–169.
18. US EPA. Method 3051A (SW-846): Microwave Assisted Acid Digestion of Sediments, Sludges, Soils, and Oils, Revision 1; US EPA: Washington, DC, USA, 2007.
19. NIST. Certificate of Analysis: Standard Reference Material 1573a Tomato Leaves; National Institute of Standards & Technology: Gaithersburg, MD, USA, 1995.
20. NIST. Certificate of Analysis: Standard Reference Material 2706 New Jersey Soil; National Institute of Standards & Technology: Gaithersburg, MD, USA, 2018.
21. NIST. Certificate of Analysis: Standard Reference Material 2710 Montana soil; National Institute of Standards & Technology: Gaithersburg, MD, USA, 2003.
22. INCT. Polish Certified Reference Material for Multielement Trace Analysis: Oriental Basma Tobacco Leaves (INCT-OBTL-5); Institute of Nuclear Chemistry and Technology: Warszawa, Poland, 2010.
23. LECO. Instrument: CN828 Determination of Carbon and Nitrogen in Soil; LECO Corportaion: St. Joseph, MI, USA, 2021.
24. LECO. Instrument: CNS928 Determination of Carbon, Nitrogen and Sulfur in Plant Tissue; LECO Corportaion: St. Joseph, MI, USA, 2019.
25. Blakemore, L.C.; Searle, P.L.; Daly, B.K. Methods for Chemical Analysis of Soils; New Zealand Soil Bureau Scientific Report; New Zealand Soil Bureau: Lower Hutt, New Zealand, 1987; p. 80.
26. Index Mundi. New Zealand Palm Kernel Meal Imports by Year. 2022. Available online: https://www.indexmundi.com/ agriculture/?country=nz&commodity=palm-kernel-meal&graph=imports (accessed on 1 June 2021).
27. Stats NZ. Fertilisers—Nitrogen and Phosphorus. 2021. Available online: https://www.stats.govt.nz/indicators/fertilisersnitrogen-and-phosphorus (accessed on 1 June 2022).
28. FANZ. Fertiliser Use in NZ. 2018. Available online: https://www.fertiliser.org.nz/Site/about/fertiliser_use_in_nz.aspx#:~{}: text=exposure%20to%20cadmium-,Nitrogen%20use,form%20of%20nitrogen%20fertiliser%20used (accessed on 3 June 2022).
29. R Core Team. R: A Language and Environment for Statistical Computing. 2021. Available online: https://www.R-project.org/ (accessed on 1 June 2022).
30. Hothorn, T.; Bretz, F.; Westfall, P. Simultaneous inference in general parametric models. Biom. J. 2008, 50, 346–363. [CrossRef]
31. Bates, D.; Mächler, M.; Bolker, B.; Walker, S. Fitting linear mixed-effects models using lme4. arXiv 2014, arXiv:1406.5823.
32. Kuznetsova, A.; Brockhoff, P.B.; Christensen, R.H.B. lmerTest package: Tests in linear mixed effects models. J. Stat. Softw. 2017, 82, 1–26. [CrossRef]
33. Hall, N.G.; Schönfeldt, H.C. Total nitrogen vs. amino-acid profile as indicator of protein content of beef. Food Chem. 2013, 140, 608–612. [CrossRef] [PubMed]
34. Donough, C.R.; Cahyo, A.; Wandri, R.; Fisher, M.; Oberthür, T. Plant nutrients in palm oil. Better Crops Plant Food 2016, 100, 19–22. 35. Corley, R.H.V.; Tinker, P.B.H. The Oil Palm, 5th ed.; Wiley: Hoboken, NJ, USA, 2015.
36. Woittiez, L.S.; Slingerland, M.; Giller, K.E. Yield gaps in Indonesian smallholder plantations: Causes and solutions. In Proceedings of the International Palm Oil Congress and Exhibition, Kuala Lumpur, Malaysia, 6–8 October 2015.
37. Rafflegeau, S.; Michel-Dounias, I.; Tailliez, B.; Ndigui, B.; Papy, F. Unexpected N and K nutrition diagnosis in oil palm smallholdings using references of high-yielding industrial plantations. Agron. Sustain. Dev. 2010, 30, 777–787. [CrossRef]
38. Law, C.C.; Zaharah, A.R.; Husni, M.H.A.; Siti Nor Akmar, A. Leaf nitrogen content in oil palm seedlings and their relationship to SPAD chlorophyll meter readings. J. Oil Palm Environ. Health 2014, 5, 8–17.
39. Zhong, J.; Wang, X. Evaluation Technologies for Food Quality; Elsevier Science: Amsterdam, The Netherlands, 2019.
40. Battaglia, M.; Cruywagen, C.; Bertuzzi, T.; Gallo, A.; Moschini, M.; Piva, G.; Masoero, F. Transfer of melamine from feed to milk and from milk to cheese and whey in lactating dairy cows fed single oral doses. J. Dairy Sci. 2010, 93, 5338–5347. [CrossRef]
41. DairyNZ. Farmfact: 1-71 Palm Kernel Extract (PKE); DairyNZ: Hamilton, New Zealand, 2008.
42. Grace, N.D.; Knowles, S.O.; Sykes, A. ; New Zealand Society of Animal Production. Managing Mineral Deficiencies in Grazing Livestock; New Zealand Society of Animal Production: Palmerston North, New Zealand, 2010.
43. Reiser, R.; Simmler, M.; Portmann, D.; Clucas, L.; Schulin, R.; Robinson, B. Cadmium concentrations in New Zealand pastures: Relationships to soil and climate variables. J. Environ. Qual. 2014, 43, 917–925. [CrossRef]
44. DairyNZ. Common Feed Supplements. 2022. Available online: https://www.dairynz.co.nz/feed/supplements/common-feedsupplements/ (accessed on 2 June 2022).
45. Kolade, O.O.; Coker, A.O.; Sridhar, M.K.C.; Adeoye, G.O. Palm kernel waste management through composting and crop production. J. Environ. Health Res. 2006, 5, 81–85.
46. MPI. Imported Feed Commodities: ACVM (Imported Feed Commodities) Notice 2014; MPI: Wellingotn, New Zealand, 2014.
47. MPOB. Chemical Fertiliser Ganocare™ as Preventive Treatment in Controlling Ganoderma Disease of Oil Palm; MPOB: Kajang, Malaysia, 2015.
48. Kabata-Pendias, A.; Mukherjee, A.B. Trace Elements from Soil to Human; Springer: Berlin, Germany, 2007.
49. Abdollahi, M.; Hosking, B.; Ravindran, V. Nutrient analysis, metabolisable energy and ileal amino acid digestibility of palm kernel meal for broilers. Anim. Feed Sci. Technol. 2015, 206, 119–125. [CrossRef]
50. Thompson-Morrison, H.; Gaw, S.; Robinson, B. An assessment of trace element accumulation in palm oil production. Sustainability 2022, 14, 4553. [CrossRef]
51. Nokes, C. A Guide to the Ministry of Health Drinking-Water Standards for New Zealand; Environmental Science & Research Ltd.: Christchurch, New Zealand, 2008.
52. Goselink, R.M.A.; Klop, G.; Dijkstra, J.; Bannink, A. Phosphorus Metabolism in Dairy Cattle: A Literature Study on Recent Developments and Gaps in Knowledge; Wageningen UR Livestock Research: Wageningen, The Netherlands, 2015.
53. Crawford, G. Avoiding Mineral Toxicity in Cattle. 2007. Available online: https://fyi.extension.wisc.edu/wbic/files/2010/12/ Factsheet_MineralToxicity.pdf (accessed on 20 August 2022).
54. Ward, G.M. Potassium metabolism of domestic ruminants—A review. J. Dairy Sci. 1966, 49, 268–276. [CrossRef]
55. Martín-Tereso, J.; Martens, H. Calcium and magnesium physiology and nutrition in relation to the prevention of milk fever and tetany (dietary management of macrominerals in preventing disease). Vet. Clin. North Am. : Food Anim. Pract. 2014, 30, 643–670. [CrossRef]
56. Luckey, T.D.; Venugopal, B. Metal Toxicity in Mammals: Physiologic and Chemical Basis for Metal Toxicity; Springer: New York, NY, USA, 1977.
57. Coup, M.R.; Campbell, A.G. The effect of excessive iron intake upon the health and production of dairy cows. N. Z. J. Agric. Res. 1964, 7, 624–638. [CrossRef]
58. Oruc, H.H.; Uzunoglu, I.; Cengiz, M. Suspected iron toxicity in dairy cattle. Uludag Univ. J. Fac. Vet. Med. 2009, 28, 75–77.
59. Phillippo, M.; Humphries, W.; Garthwaite, P. The effect of dietary molybdenum and iron on copper status and growth in cattle. J. Agric. Sci. 1987, 109, 315–320. [CrossRef]
60. Phillippo, M.; Humphries, W.R.; Atkinson, T.; Henderson, G.D.; Garthwaite, P.H. The effect of dietary molybdenum and iron on copper status, puberty, fertility and oestrous cycles in cattle. J. Agric. Sci. 1987, 109, 321–336. [CrossRef]
61. Hair-Bejo, M.; Davis, M.P.; Alimon, A.R.; Moonafizad, M. Chronic copper toxicosis: Utilization of palm kernel cake in sheep fed solely on concentrate diets. In Proceedings of the First Symposium on Integration of Livestock to Palm Oil Production, Kuala Lumpur, Malaysia, 22–27 May 1995.
62. Jelsma, I.; Woittiez, L.S.; Ollivier, J.; Dharmawan, A.H. Do wealthy farmers implement better agricultural practices? An assessment of implementation of Good Agricultural Practices among different types of independent oil palm smallholders in Riau, Indonesia. Agric. Syst. 2019, 170, 63–76. [CrossRef]
63. Ravensdown. Fertiliser Prices; Ravensdown: Christchurch, New Zealand, 2022.
64. Abraham, E. Cadmium in New Zealand agricultural soils. N. Z. J. Agric. Res. 2020, 63, 202–219. [CrossRef]
65. Rys, G.J. A National Cadmium Management Strategy for New Zealand Agriculture; Cadmium Working Group: Wellington, New Zealand, 2011.
66. Vermeulen, V. Use of Zinc in Agriculture: An Assessment of Data for Evidence of Accumulation in Waikato Soils Surface Water and Sediments: A Thesis Presented in Partial Fulfillment of the Requirements for the Degree of Master of Health Science in Environmental Health at Massey University, Wellington, New Zealand; Massey University: Wellington, New Zealand, 2015.
67. Selbie, D.R.; Buckthought, L.E.; Shepherd, M.A. The challenge of the urine patch for managing nitrogen in grazed pasture systems. Adv. Agron. 2015, 129, 229–292.
68. University of Canterbury. New Kiwi Research to Turn Biowaste into Economic Boost; University of Canterbury: Christchurch, New Zealand, 2021.
69. Mason, B.H.; Moore, C.B. Principles of Geochemistry; Wiley: Hoboken, NJ, USA, 1982.