Article
Hadee Thompson-Morrison 1,*,† , Fransisca Ariantiningsih 2, Sugesti Muhammad Arief 2, Sally Gaw 1 and Brett Robinson 1
1 School of Physical and Chemical Sciences, University of Canterbury, Christchurch 8041, New Zealand; sally.gaw@canterbury.ac.nz (S.G.); brett.robinson@canterbury.ac.nz (B.R.)
2 Orangutan Information Centre, Medan 20131, Indonesia; fransisca@orangutancentre.org (F.A.); gesti@orangutancentre.org (S.M.A.)
* Correspondence: thompson-morrisonh@landcareresearch.co.nz
† Current address: Manaaki Whenua—Landcare Research, Lincoln 7608, New Zealand.
† 现地址:Manaaki Whenua—Landcare Research, Lincoln 7608, 新西兰。
Citation: Thompson-Morrison, H.; Ariantiningsih, F.; Arief, S.M.; Gaw, S.; Robinson, B. Nutrients and Contaminants in Soils of Current and Former Oil Palm Production Systems from Indonesia. Land 2023, 12, 2144. https://doi.org/10.3390/land12122144
Abstract: Palm oil production in Southeast Asia often occurs on nutrient-poor, acidic soils converted from primary forest. Both the agricultural conversion and the production of oil palm are subsidised in Indonesia. As well as depleting soil organic C and plant nutrients, agricultural production on these soils can result in the accumulation of trace elements (TEs)—including micronutrients and non-essential trace elements—from the use of TE-containing agrichemicals including phosphate fertilisers and Cu fungicides. We tested the hypothesis that palm soils will have lower C concentrations than forest soils, as well as accumulation of TEs including Cu, Zn and Cd. Soil samples from active and abandoned oil palm plantations in Sumatra, Indonesia, were analysed for general soil properties as well as TE concentrations. Soils were acidic and low in key nutrients, with production likely to be limited by deficiencies of N, P, K, Mg and Mo, present at some sites in mean concentrations as low as 0.021%, 118 mg kg−1, 778 mg kg−1, 1023 mg kg−1 and 0.095 mg kg−1, respectively. Mean organic C was lower (2.0–3.3%) than reported values in nearby forest soils (7.7%). Soils under palm production contained elevated levels of Cu, Zn, As and Pb up to 38, 91, 9.0 and 28 mg kg−1, respectively, likely due to agrichemical use. The correction of nutrient deficiencies in palm production would require significant fertiliser inputs, which would exacerbate TE accumulation and reduce the net economic revenue from oil production. Our data have shown that in the plantations we have sampled, soils have become degraded. These tropical, weathered, and naturally nutrient-poor soils are ill suited to intensive production that requires high ongoing nutrient inputs. These findings have implications for the sustainability of a regionally significant production system across Southeast Asia.
摘要:东南亚的棕榈油生产通常在由原始森林转化而来的贫瘠酸性土壤上进行。在印度尼西亚,农业转化和油棕生产均享有补贴。这些土壤上的农业生产不仅会消耗土壤有机碳和植物养分,还可能因使用含微量元素的农用化学品(包括磷肥和铜基杀菌剂)而导致微量元素(TEs,包括微量营养元素和非必需微量元素)的累积。本研究检验了以下假设:与森林土壤相比,油棕土壤的C浓度较低,且存在Cu、Zn和Cd等微量元素的累积。对印度尼西亚苏门答腊岛在产及废弃油棕种植园的土壤样品进行了常规土壤性质和微量元素浓度分析。结果表明,土壤呈酸性且关键养分含量低,生产很可能受N、P、K、Mg和Mo缺乏的限制,部分样点上述元素的平均浓度分别低至0.021%、118 mg kg−1、778 mg kg−1、1023 mg kg−1和0.095 mg kg−1。平均有机C含量(2.0%–3.3%)低于附近森林土壤的报道值(7.7%)。油棕生产土壤中Cu、Zn、As和Pb含量升高,分别高达38、91、9.0和28 mg kg−1,这很可能是施用农用化学品所致。纠正油棕生产中的养分缺乏需要大量施肥,这将加剧微量元素累积并降低棕榈油生产的净经济收益。本研究数据表明,在所采样的种植园中,土壤已经退化。这些热带、强风化且天然养分贫瘠的土壤不适合需要持续高养分投入的集约化生产。上述发现对东南亚这一具有区域重要性的生产体系的可持续性具有重要意义。
Keywords: Elaeis guineensis; palm oil; fertilisers; trace elements; heavy metals
关键词:Elaeis guineensis;棕榈油;肥料;微量元素;重金属
Academic Editor: Lujun Li
Received: 21 September 2023 Revised: 19 October 2023 Accepted: 13 November 2023 Published: 8 December 2023
Copyright: © 2023 by the authors. Licensee MDPI, Basel, Switzerland. This article is an open access article distributed under the terms and conditions of the Creative Commons Attribution (CC BY) license (https:// creativecommons.org/licenses/by/ 4.0/).
版权:© 2023 作者所有。授权方 MDPI,瑞士巴塞尔。本文为开放获取文章,依据知识共享署名(CC BY)许可协议(https:// creativecommons.org/licenses/by/ 4.0/)条款发布。
1Introduction引言
Since 1990, most tropical soils used for agricultural production (90%) were formerly under indigenous forest [1], of which 86% were converted to oil palm (Elaeis guineensis) and rubber (Hevea brasiliensis) plantations [2]. Indonesia and Malaysia are the largest palm oil producers [3]. Indonesia provides financial incentives to convert forest to palm plantations and subsidises oil palm production [4]. Palm conversions result in the destruction of forest ecosystems with resulting impacts on megafauna habitat and biodiversity [5–8]. However, there is a lacuna of information on the effects of oil palm production on tropical soils [9]. In particular, trace elements (TEs), which occur at <1000 mg kg−1 in living tissue [10], can accumulate in soils as a result of repeated applications of agrochemicals in which the TE is an active ingredient or a contaminant. Trace elements can be both deleterious or beneficial to the health of plants, animals and ecosystems, depending on their concentration, speciation and associated mobility within the environment. Some TEs are non-essential and will pose toxicity risks if allowed to accumulate past toxic thresholds, while others are essential for plants and/or animals in certain doses; however, they can still become toxic when they accumulate past health-based thresholds. Thus all trace elements can become potentially toxic depending on their concentrations and exposure routes present within the environment [11].
自1990年以来,用于农业生产的热带土壤大多(90%)原为原生森林[1],其中86%被转化为油棕(Elaeis guineensis)和橡胶(Hevea brasiliensis)种植园[2]。印度尼西亚和马来西亚是最大的棕榈油生产国[3]。印度尼西亚为将森林转化为油棕种植园提供经济激励,并对油棕生产给予补贴[4]。油棕转化导致森林生态系统遭到破坏,进而影响大型动物栖息地和生物多样性[5–8]。然而,关于油棕生产对热带土壤影响的信息仍十分缺乏[9]。特别是微量元素(TEs,即在活体组织中含量 <1000 mg kg−1 的元素[10]),可能因反复施用以该元素为有效成分或含该元素杂质的农用化学品而在土壤中累积。微量元素对植物、动物和生态系统健康既可能有害也可能有益,这取决于其浓度、形态以及在环境中的相关迁移性。一些微量元素为非必需元素,若累积超过毒性阈值将带来毒性风险;另一些元素在一定剂量下是植物和/或动物所必需的,但当其累积超过基于健康的阈值时仍可能产生毒性。因此,根据其在环境中的浓度和暴露途径,所有微量元素都可能成为潜在有毒元素[11]。
Both the fertilisers and composts that are used to increase soil fertility as well as applied pesticides may contain trace elements (TEs) as contaminants, including Zn, As, Cd and Pb in NPK fertilisers [12], or active ingredients such as Cu in Cu-based fungicides [13]. Trace elements may accumulate in soils over time [14] and increase the risk of food-chain transfer of toxic elements [15], particularly if Soil Guideline Values (SGVs) for TEs are exceeded. In different agricultural systems requiring high input rates of TE-containing agrichemicals, the accumulation of TEs in soil has posed risks for production: in New Zealand dairy farms which have historically used high rates of phosphate fertilisers, Cd now limits production in some regions [16], while in some regions of France, viticultural production is limited by the accumulation of Cu due to repeated Cu pesticide use [17]. If similar inputs and accumulation has occurred under oil palm agriculture, TEs may come to limit production in oil palm producing soils.
用于提高土壤肥力的肥料和堆肥以及施用的农药均可能含有作为杂质的微量元素(TEs),例如NPK肥料中的Zn、As、Cd和Pb[12],或作为有效成分的微量元素,例如铜基杀菌剂中的Cu[13]。微量元素可能随时间在土壤中累积[14],并增加有毒元素经食物链传递的风险[15],尤其是在微量元素超过土壤指导值(SGVs)的情况下。在需要大量施用含微量元素农用化学品的不同农业系统中,土壤微量元素的累积已对生产构成风险:在历史上大量施用磷肥的新西兰奶牛场,Cd目前已限制了部分地区的生产[16];而在法国部分地区,由于反复施用铜基农药导致Cu累积,葡萄种植生产受到限制[17]。如果油棕种植中也存在类似的投入和累积,微量元素可能会限制油棕生产土壤的生产力。
Typically, indigenous forests overlie acidic soils with low concentrations of plant nutrients that require capital lime and fertilisers to enable production [18,19]. Following conversion, soil organic matter usually decreases [20,21]. Soil organic matter has been found to decrease by up to 42% when converted from forest to oil palm [22]. Oil palm is an intensive crop, requiring maintenance nutrient inputs of N (215–286 kg ha−1), P (143–215 kg ha−1), K (358–429 kg ha−1), Mg (215–286 kg ha−1) and B (14–29 kg ha−1) [23]. These input requirements may increase when palm is cultivated on nutrient-poor soils [3,23]. Cultivation on Histosols also requires inputs of Cu and Zn to meet plant nutrient requirements [24], and the use of Cu-based fungicides is recommended to treat oil palm pests including Ganoderma spp. [13,25]. In a survey of farmers, the most frequently used fertilisers in smallholder oil palm production in Indonesia were subsidised NPK (15-15-15) and urea, with farmers citing financial limitations as a key factor of fertiliser choice [26]. Oil palm soils can contain Cu, Zn and Cd up to 69, 107 and 5.2 mg kg−1, respectively [27]. Maximum potential yields for palm oil have been calculated at between 10 and 18 t oil ha−1 yr−1; however, commercial yields are in the range of 5–7 t oil ha−1 yr−1 [28], and smallholder yields are as low as 4 t oil ha−1 yr−1 [29]. Without subsidies, oil palm production on low-fertility tropical soils may not be viable [30–32].
通常,原生森林下覆盖的是植物养分浓度低的酸性土壤,需要施用基础石灰和肥料才能进行生产[18,19]。转化后,土壤有机质通常会减少[20,21]。研究发现,森林转化为油棕后土壤有机质减少可达42%[22]。油棕是一种集约化作物,需要维持性养分投入:N(215–286 kg ha−1)、P(143–215 kg ha−1)、K(358–429 kg ha−1)、Mg(215–286 kg ha−1)和B(14–29 kg ha−1)[23]。当油棕种植于养分贫瘠土壤时,这些投入需求可能会增加[3,23]。在有机土(Histosols)上种植还需要投入Cu和Zn以满足植物养分需求[24],并推荐使用铜基杀菌剂防治包括Ganoderma spp.在内的油棕病虫害[13,25]。一项农户调查显示,印度尼西亚小农油棕生产中最常用的肥料为补贴的NPK(15-15-15)和尿素,农户将经济限制列为选择肥料的关键因素[26]。油棕土壤中Cu、Zn和Cd含量可分别高达69、107和5.2 mg kg−1[27]。经计算,棕榈油的最大潜在产量为10–18 t oil ha−1 yr−1;然而,商业产量为5–7 t oil ha−1 yr−1[28],小农产量低至4 t oil ha−1 yr−1[29]。若无补贴,在低肥力热带土壤上进行油棕生产可能难以为继[30–32]。
We hypothesise that the conversion of forest soils to palm oil or rubber plantation will result in the accumulation of TEs, particularly Cu, Zn and Cd, as well as the depletion of organic C. We further hypothesise that soils at sites that are under current production will have higher N concentrations than sites where the production of oil palm has been abandoned.
我们假设,森林土壤转化为油棕或橡胶种植园将导致微量元素(尤其是Cu、Zn和Cd)的累积以及有机C的耗竭。我们进一步假设,目前仍在生产的样点土壤N浓度高于已放弃油棕生产的样点。
We aimed to determine the chemical composition and plant nutrient status of soils under active production and those which have been abandoned in Indonesia, and to compare these with published data from forest soils, international SGVs and oil palm production systems in other regions, as well as soils under rubber production.
本研究旨在测定印度尼西亚在产及废弃土壤的化学组成和植物养分状况,并将其与已发表的森林土壤数据、国际土壤指导值(SGVs)、其他地区油棕生产系统以及橡胶生产土壤进行比较。
2Materials and Methods材料与方法
2.1. Site Descriptions2.1. 样点描述
Soil samples were collected from four E. guineensis plantation sites on the Indonesian island of Sumatra in May 2019 (Figure 1). Samples were obtained under the conditions of anonymity of land ownership, and following this, Figure 1 identifies the locality from where samples were collected. The sampling region has mean annual rainfall of 2950 mm [33]. All palm sites had soils classed as Acrisols under the FAO soil classification system [34], representing some 90% of soils in oil palm growing regions of Indonesia. Acrisols are taxonomically related to Oxisols under the USDA soil classification system [35]. These soils typically form in humid, tropical climates and old undulating landscapes, and are characterised by a subsurface accumulation of kaolinitic clays. They are typically highly leached, low in plant nutrients, highly erodible and contain high levels of Al. As such, agricultural production on these soils can be challenging. The sites were chosen to give an indication of the range of soil conditions present under both current and former oil palm plantations with varying management practices and landscape features. For a summary of the site characteristics of the plantations sampled, see Table 1.
2019年5月,在印度尼西亚苏门答腊岛的4个E. guineensis种植园样点采集了土壤样品(图1)。样品在土地所有权匿名的条件下获取,因此图1仅标示了样品采集的所在地区。采样区域年均降雨量为2950 mm[33]。根据FAO土壤分类系统[34],所有油棕样点土壤均属于强淋溶土(Acrisols),这类土壤约占印度尼西亚油棕种植区土壤的90%。在USDA土壤分类系统中,强淋溶土在分类学上与氧化土(Oxisols)相关[35]。这些土壤通常形成于湿润的热带气候和古老的起伏地貌中,其特征是高岭石类黏土在表下层累积。它们通常淋溶强烈、植物养分含量低、极易侵蚀且Al含量高。因此,在这些土壤上进行农业生产具有挑战性。选择这些样点是为了反映在现有及以往油棕种植园中、不同管理措施和地貌特征下的土壤条件范围。所采样种植园的样点特征汇总见表1。
![Figure 1. Map of Indonesia showing sampling locality in Sumatra with the extent of Acrisol soils over the north of the island. Adapted from [34].](195/figure-01.jpg)
| Site Abbreviation样点 缩写 | Site A样点A | Site B样点B | Site C样点C | Site D样点D |
|---|---|---|---|---|
| Site status | ~~Abandoned,~~ trees remaining | ~~Abandoned,~~ trees remaining | ~~Active,~~ smallholder | ~~Ex-plantation, no trees~~ remaining |
| Soil type (FAO classification) | Acrisol | Acrisol | Acrisol | Acrisol |
| Soil type (USDA classification) | Oxisol | Oxisol | Oxisol | Oxisol |
| i Slope | _≤_12◦ | _≤_12◦ | <4◦ | _≤_9◦ |
| Years in production | ca. 30 | ca. 30 | ca. 20 | ca. 12 |
| Recent management history | No amendments applied and unharvested for past 3 years | No amendments applied and unharvested for past 3 years | Amendments applied and weeds cleared with pesticides within last year | Oil palm trees Removed, area under regeneration with no amendments applied for past 3 years |
| Number of samples collected | 25 | 25 | 10 | 25 |
Sites A and B were both abandoned oil palm plantations that still contained abandoned oil palm trees. These sites were on the forest edge of Gunung Leuser National Park and were formerly under corporate management. For the previous three years, the sites had been unmanaged with no fertiliser applied. Prior to this, according to the plantation age map [36], these sites were under production since ca. 1996–1998. Trees were thus ca. 30 years old. These sites were adjacent to each other and were separated northeast (Site A)/southwest (Site B). Future reforestation was planned at these sites. As such, the sites were overgrown with understory plants and no amendments had been applied to the soil for at least three years. These sites were >100 ha in area, hilly and steep in places with slopes up to approximately 12◦, and samples were taken from both in areas in which E. guineensis trees remained, based on accessibility and practicality.
样点A和B均为废弃油棕种植园,园内仍保留有废弃的油棕树。这些样点位于Gunung Leuser国家公园的森林边缘,以前由企业管理。在过去三年中,这些样点无人管理,未施用任何肥料。在此之前,根据种植园树龄图[36],这些样点自约1996–1998年起投入生产,因此树龄约为30年。两个样点相互毗邻,分别位于东北侧(样点A)和西南侧(样点B)。这些样点计划在未来进行重新造林。因此,样点内林下植物丛生,且至少三年未对土壤施用任何改良剂。这些样点面积 >100 ha,地势起伏,局部陡峭,坡度可达约12◦;根据可达性和可操作性,在两个样点内仍有E. guineensis树的区域采集样品。
Site C was an active smallholder oil palm plantation site on the forest edge, near to Gunung Leuser National Park. This site was adjacent to a small village and river and had been under E. guineensis production since ca. 2001 [36]. The site was <10 ha in area and had a slope of <4◦.
样点C为位于森林边缘、靠近Gunung Leuser国家公园的在产小农油棕种植园。该样点毗邻一个小村庄和一条河流,自约2001年起用于E. guineensis生产[36]。样点面积 <10 ha,坡度 <4◦。
Site D was also an abandoned plantation and was classed as an ex-oil palm plantation, as the majority of oil palm trees has been removed at the time of sampling. Like the other plantations, this site bordered Gunung Leuser National Park. Production at the site had been abandoned and the area had transitioned into a mix of permaculture and reforestation. No amendments had been applied to the soil for at least three years. According to data on remaining surrounding plantations from a map of plantation age [36], this site had likely been under production since at least 2009. This site was hilly with slopes up to 9◦, and samples were collected here based on accessibility and practicality.
样点D也是一处废弃种植园,由于采样时大部分油棕树已被移除,因此被归类为前油棕种植园。与其他种植园一样,该样点与Gunung Leuser国家公园接壤。该样点已停止生产,区域已转变为永续农业与重新造林相结合的模式。至少三年未对土壤施用任何改良剂。根据种植园树龄图[36]中周边现存种植园的数据,该样点可能至少自2009年起投入生产。该样点地势起伏,坡度可达9◦,根据可达性和可操作性采集样品。
Control samples outside of plantations and in natural forest could not be collected, as permits were not granted to take soil samples from within the National Park. As such, we used published data from soils under nearby Gunung Leuser National Park [37,38] as well as from a rubber plantation in North Sumatra as a comparison site. Rubber cultivation often occurs adjacent to oil palm cultivation; however, it typically uses lower inputs of agrichemicals, particularly fertilisers [39]. The rubber trees at this site were ca. 10 years old at the time of sampling and data were from 32 samples. The soils from this site were Ultisols under the USDA classification system. Ultisols are similar to Acrisols/Oxisols, but feature a translocated clay layer below the surface horizon [40].
由于未获准在国家公园内采集土壤样品,因此无法采集种植园外及天然林中的对照样品。因此,我们采用了附近Gunung Leuser国家公园土壤的已发表数据[37,38],并以北苏门答腊的一处橡胶种植园作为比较样点。橡胶种植通常与油棕种植相邻,但其农用化学品(尤其是肥料)投入通常较低[39]。采样时该样点的橡胶树树龄约为10年,数据来自32个样品。根据USDA分类系统,该样点土壤属于老成土(Ultisols)。老成土与强淋溶土/氧化土相似,但在表层之下具有黏粒淀积层[40]。
2.2. Analytical Methods2.2. 分析方法
2.2.1. Sample Collection and Preparation2.2.1. 样品采集与制备
After clearing away the surface litter, soil samples were collected to 150 mm depth using a spade and placed in zip-lock plastic bags. Samples were taken at least 20 m apart from inter rows between trees. As each site varied in area, more samples were taken from the larger sites to achieve representativity of soils at each site. We took 25 samples from Sites A, B and D, and 10 samples from Site C, as this site was smaller in area. Samples were oven dried at 105 ◦C until a constant weight was achieved. Samples were then crushed using a mortar and pestle and passed through a 2 mm stainless steel sieve [41] for all analyses excluding PSA.
清除地表凋落物后,用铁锹采集0–150 mm深度的土壤样品,装入自封塑料袋中。样品采自树间行间,采样点间距至少20 m。由于各样点面积不同,面积较大的样点采集更多样品,以保证各样点土壤的代表性。样点A、B和D各采集25个样品,样点C因面积较小采集10个样品。样品在105 ◦C下烘干至恒重,然后用研钵和研杵研磨,并过2 mm不锈钢筛[41],用于除粒径分析(PSA)以外的所有分析。
2.2.2. Pseudo-Total Element Concentrations2.2.2. 准全量元素浓度
Microwave digestion was used to analyse pseudo-total elemental concentrations (hereafter referred to as total concentrations) in all samples following EPA Method 3051A [42]. The microwave used was an Ultrawave Single Reaction Chamber Microwave Digestion Unit. For each sample, 0.20 g (±0.01 g) was weighed into a digestion tube and 5 mL 70% HNO3 was added. Samples were left to pre-digest overnight, before being digested for 25 min at 230 ◦C [43]. Two reagent blanks and two Standard Reference Material (SRM) samples [44,45] were included with every 11 samples for quality assurance.
按照EPA Method 3051A[42],采用微波消解法分析所有样品的准全量元素浓度(以下简称全量浓度)。所用微波消解仪为Ultrawave单反应腔微波消解系统。每个样品称取0.20 g(±0.01 g)置于消解管中,加入5 mL 70% HNO3。样品先静置过夜进行预消解,然后在230 ◦C下消解25 min[43]。为保证质量,每11个样品中加入2个试剂空白和2个标准参考物质(SRM)样品[44,45]。
2.2.3. Ca(NO3)2-Extractable Element Concentrations2.2.3. Ca(NO3)2可提取态元素浓度
A Ca(NO3)2 extraction was used to measure phytoavailable concentrations of TEs in palm soil samples. This analysis used 0.05 M Ca(NO3)2 [46]. Here, 5.00 g (±0.05 g) of soil was weighed into a 50 mL centrifuge tube, and 30 mL of 0.05 M Ca(NO3)2 was added. Tubes were placed on an oscillating shaker for two hours, then centrifuged at 4559 g for ten minutes. Four reagent blanks were included in every analysis.
采用Ca(NO3)2提取法测定油棕土壤样品中微量元素的植物有效态浓度。本分析使用0.05 M Ca(NO3)2[46]。称取5.00 g(±0.05 g)土壤置于50 mL离心管中,加入30 mL 0.05 M Ca(NO3)2。离心管置于往复振荡器上振荡2 h,然后以4559 g离心10 min。每批分析中均包含4个试剂空白。
Soil adsorption coefficients (KD) were calculated for TEs soils at Sites A, B, C and D based on total and Ca(NO3)2 extractable (soluble) concentrations using the sorbed/soluble concentration quotient.
基于全量和Ca(NO3)2可提取态(可溶态)浓度,采用吸附态/可溶态浓度比值计算样点A、B、C和D土壤中微量元素的土壤吸附系数(KD)。
2.2.4. pH
The pH of soil was measured using a pH electrode according to the pH in H2O method [41]. Five g of soil was measured into a beaker, and 12.5 mL of Milli-Q water was added (soil to water ratio of 1:2.5). Samples were then stirred vigorously for at least 1 min and left to stand overnight. A Hach HQ440d multi pH probe was then used to take the pH measurement of each sample.
按照水浸提pH法[41],使用pH电极测定土壤pH。称取5 g土壤置于烧杯中,加入12.5 mL Milli-Q水(土水比为1:2.5)。样品剧烈搅拌至少1 min后静置过夜,然后使用Hach HQ440d多参数pH探头测定每个样品的pH。
2.2.5. Cation Exchange Capacity and Base Saturation2.2.5. 阳离子交换量与盐基饱和度
The method described by Hendershot and Duquette [47] was used to analyse samples for Cation Exchange Capacity (CEC). For each sample, 2.00 g (±0.01 g) of soil was weighed into a 50 mL centrifuge tube and 20.00 mL 0.1 M BaCl2:2H2O was added. Samples were shaken on an oscillating shaker for 2 h, before being centrifuged at 4559 g for 10 min. Following this, samples were analysed using MP-AES for Na, Mg, Al, K, Ca, Mn and Fe. Effective CEC was calculated from this. Base Saturation (BS) was calculated as the percentage of CEC made up of base cations, i.e., Na, Mg, K and Ca. At least two reagent blanks were included in every analysis.
采用Hendershot和Duquette[47]所述方法分析样品的阳离子交换量(CEC)。每个样品称取2.00 g(±0.01 g)土壤置于50 mL离心管中,加入20.00 mL 0.1 M BaCl2:2H2O。样品在往复振荡器上振荡2 h,然后以4559 g离心10 min。随后采用MP-AES测定样品中的Na、Mg、Al、K、Ca、Mn和Fe,并据此计算有效CEC。盐基饱和度(BS)按盐基阳离子(即Na、Mg、K和Ca)占CEC的百分比计算。每批分析中至少包含2个试剂空白。
2.2.6. Total Carbon and Nitrogen2.2.6. 全碳与全氮
Total C and N of soils was analysed with a CN828 Elemental Analysis using a Combustion C and N analyser. Blanks and SRMs [48] were analysed with samples.
采用CN828元素分析仪(燃烧法C、N分析仪)测定土壤全C和全N。空白和SRM[48]与样品一同分析。
2.2.7. Particle Size Analysis2.2.7. 粒径分析
A laser diffraction method was used to analyse soils for particle size distribution. The method used for PSA was developed in collaboration by the University of Canterbury sedimentology and engineering departments, and follows the overview given by Bohren and Huffman [49] and Pansu and Gautheyrou [50]. Samples were deflocculated in 50 g L−1 sodium hexametaphosphate (Calgon) on an oscillating shaker for 24 h. They were then vortexed and placed on a magnetic stirrer plate to ensure all particles were in suspension. The sample was then analysed using a Saturn DigiSizer 5200 using the Fraunhofer method [49]. Drops of the deflocculated sample were dropped into the liquid sample handling unit of the machine until the optimum obscuration was achieved (12–17%), and sample analysis was run. A Wentworth size chart was used to determine silt, sand and clay soil fractions, and soil was categorised according to USDA classification [51].
采用激光衍射法分析土壤粒径分布。PSA所用方法由坎特伯雷大学沉积学系与工程系合作开发,遵循Bohren和Huffman[49]以及Pansu和Gautheyrou[50]的概述。样品在50 g L−1六偏磷酸钠(Calgon)中于往复振荡器上振荡24 h进行分散,然后涡旋并置于磁力搅拌器上,以确保所有颗粒处于悬浮状态。随后采用Saturn DigiSizer 5200以Fraunhofer法[49]进行分析。将分散后的样品逐滴加入仪器的液体进样单元,直至达到最佳遮光度(12%–17%),然后进行样品分析。采用Wentworth粒级表确定粉粒、砂粒和黏粒组分,并按USDA分类[51]对土壤进行分类。
2.2.8. Elemental Determination2.2.8. 元素测定
Macroelements (P, K, S, Ca, Mg, Al and Fe) were analysed using inductively coupled plasma mass spectrometry (ICP-MS) and microwave plasma atomic emission spectroscopy (MP-AES). Recoveries of SRMs ranged from 30 to 169% of certified values. Supplementary Materials Table S1 gives a complete list of the elements and their respective recoveries. Trace elements (Cr, Mn, Co, Ni, Cu, Zn, Ge, As, Sr, Mo, Pd, Ag, Cd, Te, Cs, Ce, Re, Ir, Hg and Pb) were analysed using ICP-MS, inductively coupled plasma optical emission spectrometry (ICP-OES) or MP-AES. Recoveries ranged from 37 to 164% of certified values. The limit of quantification for analyses was 0.01 mg kg−1.
采用电感耦合等离子体质谱(ICP-MS)和微波等离子体原子发射光谱(MP-AES)分析常量元素(P、K、S、Ca、Mg、Al和Fe)。SRM回收率为认证值的30%–169%。补充材料表S1列出了全部元素及其回收率。微量元素(Cr、Mn、Co、Ni、Cu、Zn、Ge、As、Sr、Mo、Pd、Ag、Cd、Te、Cs、Ce、Re、Ir、Hg和Pb)采用ICP-MS、电感耦合等离子体发射光谱(ICP-OES)或MP-AES分析,回收率为认证值的37%–164%。分析的定量限为0.01 mg kg−1。
2.3. Statistical Analysis2.3. 统计分析
R (version 4.1.0) [52] was used for all statistical analyses. One-way parametric analysis of variance (ANOVA) was carried out to compare means between sites using the package multcomp [53]. Where assumptions of normality were not met, data were log-transformed (natural log). When data did not meet assumptions of homoscedacity, a non-parametric permutation ANOVA was used; however, no difference was found between parametric and non-parametric tests with regard to the significance of results, and the parametric ANOVA was concluded to be robust. Tukey’s Honest Significant Difference test was used to determine significant differences in soil variables between sites.
所有统计分析均使用R(4.1.0版)[52]进行。采用multcomp程序包[53]进行单因素参数方差分析(ANOVA),比较各样点间的均值。若数据不满足正态性假设,则进行(自然)对数转换。若数据不满足方差齐性假设,则采用非参数置换ANOVA;然而,参数检验与非参数检验在结果显著性方面并无差异,因此认为参数ANOVA是稳健的。采用Tukey真实显著差异检验确定各样点间土壤变量的显著差异。
A principle component analysis (PCA) was used to determine which soil factors were the most important variants between sites and whether agrichemical-borne elements were important. Only variables which could be measured across all sites were included, so the PCA did not include Ca(NO3)2 extractable element concentrations, CEC, BS or particle size data. The PCA was run for total elemental concentrations and soil variables in R using the package factoextra [54]. Incomplete sets of elemental data were removed prior to running the PCA.
采用主成分分析(PCA)确定哪些土壤因子是造成样点间差异的最重要变量,以及农用化学品带入的元素是否重要。仅纳入所有样点均可测定的变量,因此PCA未包括Ca(NO3)2可提取态元素浓度、CEC、BS或粒径数据。在R中使用factoextra程序包[54]对全量元素浓度和土壤变量进行PCA。运行PCA前剔除了不完整的元素数据集。
Log-transformed data from each site were used to create correlation matrices and correlograms using the R packages Hmisc [55] and corrplot [56]. Any soil variables with missing or below-detection values were excluded from this analysis. A probability value of 0.01 (chosen over 0.05) was used to determine statistically significant correlations in this analysis, as there were multiple comparisons made; thus there was a higher chance of incorrectly identifying significant relationships between variables (Type 1 error). Significance codes were used to identify statistically significant correlations: S* indicates p < 0.01, while S** indicates p < 0.001.
利用各样点经对数转换的数据,使用R程序包Hmisc[55]和corrplot[56]构建相关矩阵和相关图。任何存在缺失值或低于检出限值的土壤变量均被排除在该分析之外。由于进行了多重比较,错误识别变量间显著关系(第一类错误)的可能性较高,因此本分析采用0.01(而非0.05)的概率值判定统计显著相关性。采用显著性代码标识统计显著相关:S*表示p < 0.01,S**表示p < 0.001。
3Results and Discussion结果与讨论
3.1. General Soil Properties and Soil Carbon3.1. 土壤一般性质与土壤碳
Soil samples from all sites were acidic, with pH ranging from 4.6 to 5.4 (Table 2). This is within the range of 4.5–5.5 and comparable to the mean of 5.1 previously reported in oil palm plantations in Gunung Leuser National Park [37,38]. The rubber plantation soils (pH 5.2) were within the preferred pH range for H. brasiliensis of 5.0–6.0 [37]. Under acidic soil conditions, Al becomes increasingly soluble as Al3+: this is supported by a strong negative correlation between Ca(NO3)2 extractable Al and pH (r = −0.86 S**) for all soils. In kaolinitic soils at pH < 5.5, Al3+ and Mn2+ toxicity may inhibit plant growth, making agricultural production challenging [18,57].
所有样点的土壤样品均呈酸性,pH范围为4.6–5.4(表2)。这处于Gunung Leuser国家公园油棕种植园此前报道的4.5–5.5范围内,并与其报道的均值5.1相当[37,38]。橡胶种植园土壤(pH 5.2)处于H. brasiliensis适宜的pH范围5.0–6.0内[37]。在酸性土壤条件下,Al以Al3+形式溶解度逐渐增加:所有土壤中Ca(NO3)2可提取态Al与pH之间存在强负相关(r = −0.86 S**),证实了这一点。在pH < 5.5的高岭石质土壤中,Al3+和Mn2+毒害可能抑制植物生长,使农业生产面临挑战[18,57]。
| Site样点 | A (n = 25) | B (n = 25) | C (n = 10) | D (n = 25) | Rubber Plantation (n = 32)橡胶 种植园 (n = 32) |
|---|---|---|---|---|---|
| Ptil i Sand (%) | 8.3(1.4) a | 5.6(1.0) a | 27(1.3) b | 50(2.5) b | — |
| arce sze ditibti Silt (%) | 58(1.4) b | 55(0.99) b | 57(1.3) b | 35(1.8) a | — |
| sruon Clay (%) | 33(2.2) b | 40(1.7) b | 17(1.3) a | 15(0.92) a | — |
| pH | 5.4(0.11) c | 4.8(0.061) ab | 5.1(0.097) bc | 4.6(0.047) a | 5.2(0.076) c |
| CEC (cmol (+) kg_−_1) | 25(1.5) c | 30(0.80) d | 4.3(0.63) a | 10(0.67) b | — |
| BS (%) | 70(5.5) c | 33(4.7) b | 43(8.5) bc | 21(3.4) a | — |
| Total Al (mg kg_−_1) | 29,207(868) b | 31,022(1144) b | 32,307(1241) b | 25,174(1855) a | 67,371(2379) c |
| Ca(NO3)2 extractable Al (mg kg_−_1) | 110(24) ab | 308(30) c | 36(7.1) a | 194(16) b | — |
| Total Fe (mg kg_−_1) | 28,530(696) c | 31,149(1017) c | 23,084(420) b | 16,847(1007) a | 23,921(334) b |
| Ca(NO3)2 extractable Fe (mg kg_−_1) | 0.42(0.095) a | 0.64(0.18) a | 0.045(0.015) a | 4.2(0.95) b | — |
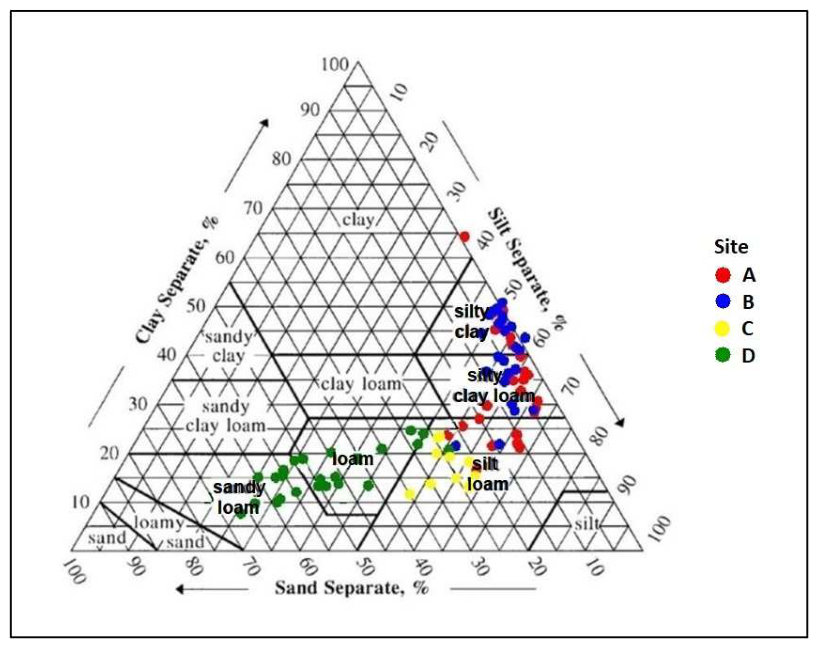
There were significant differences in soil texture between sites: soils at Site C were silt loams while soils at Site D ranged from silt loam through to sandy loam (Figure 2). Soils at Sites A and B contained significantly more clay than other sites. The sand, silt and clay fractions of soils ranged from 15 to 40%.
各样点间土壤质地存在显著差异:样点C土壤为粉壤土,而样点D土壤从粉壤土到砂壤土不等(图2)。样点A和B土壤的黏粒含量显著高于其他样点。土壤砂粒、粉粒和黏粒组分含量范围为15%–40%。
The soils under rubber production had significantly less C (1.3%) than the palm sites (2.0–3.3%). The C concentrations for the soils of the four palm sites presented in Table 3 were comparable to the mean C concentration of 2.1% reported for tropical Oxisols [58]. The significantly lower C concentration under the rubber plantation may be a result of soil type, as tropical Ultisols typically have a lower mean C (1.9%) [58]. The C concentrations at Sites A–D were similar to C concentrations of Indonesian oil palm soils in Gunung Leuser National Park area reported in the literature: Asnur [37] reported the majority of soils in a palm production area within Leuser were within the range of 1–2%, while Wasis [38] reported a mean organic C concentration of 0.57%, decreased from 7.7% following conversion from forest to oil palm. This loss in organic C is typical of soils following conversion to agriculture [59], particularly in tropical regions [20] and specifically in Sumatra [60]. However, the optimal soil C range for oil palm production is 1.5–2.0% according to Corley and Tinker [3], and 1.2–1.5% according to Goh and Po [61]. In this case, any reduction in soil C following agricultural conversion may be beneficial for palm production, with unfavourable implications for climate change [20,59].
橡胶生产土壤的C含量(1.3%)显著低于油棕样点(2.0%–3.3%)。表3所列4个油棕样点土壤的C浓度与热带氧化土报道的平均C浓度2.1%相当[58]。橡胶种植园C浓度显著较低可能与土壤类型有关,因为热带老成土的平均C含量通常较低(1.9%)[58]。样点A–D的C浓度与文献报道的Gunung Leuser国家公园地区印度尼西亚油棕土壤的C浓度相似:Asnur[37]报道,Leuser内某油棕生产区大多数土壤C含量在1%–2%范围内;而Wasis[38]报道,森林转化为油棕后,平均有机C浓度由7.7%降至0.57%。有机C的这种损失是土壤转化为农业用地后的典型现象[59],在热带地区[20]尤其是苏门答腊[60]尤为明显。然而,根据Corley和Tinker[3],油棕生产的最佳土壤C范围为1.5%–2.0%,而根据Goh和Po[61]则为1.2%–1.5%。在此情况下,农业转化后土壤C的任何减少可能有利于油棕生产,但对气候变化具有不利影响[20,59]。
| Site样点 | A (n = 25) | B (n = 25) | C (n = 10) | D (n = 25) | Rubber Plantation (n = 32)橡胶 种植园(n = 32) |
|---|---|---|---|---|---|
| Total C (%) | 3.2(0.23) c | 3.3(0.23) c | 2.1(0.11) b | 2.0(0.14) b | 1.3(0.027) a |
| Total N (%) | 0.23(0.023) c | 0.23(0.020) c | 0.035(0.0090) a | 0.021(0.0057) a | 0.12(0.0032) b |
| C:N ratio | 14 | 14 | 60 | 95 | 11 |
| Total P (mg kg_−_1) | 296(21) b | 305(17) b | 299(13) b | 118(30) a | 323(14) b |
| Ca(NO3)2 extractable P (mg kg_−_1) Total K (mg kg_−_1) | 0.030(0.0040) b 4252(303) d | 0.021(0.0029) ab 2316(106)c | 0.037(0.0031) b 1883(176) bc | 0.013(0.0033) a 778(67) a | — 1612(25) b |
| Total S (mg kg_−_1) | 266(16) c | 358(139) bc | 170(9.5) b | 116(7.6) a | 306(6.5) c |
| Ca(NO3)2 extractable S (mg kg_−_1) Total Ca (mg kg_−_1) | 2.6(1.3) a 9422(1400) d | 1.8(0.85) a 5468(996) cd | 0.45(0.39) a 2439(564) bc | 1.1(0.42) a 1286(416) a | — 1202(117) ab |
| Ca(NO3)2 extractable Ca (mg kg_−_1) | 65(5.6) c | 6.6(2.4) b | 0.0001(<0.001) ab | 1.9(1.9) a | — |
| Total Mg (mg kg_−_1) | 3005(156) c | 2637(101) c | 2747(405) c | 1023(102) a | 1185(49) b |
Cation exchange capacity was significantly different between all four palm sites, in the order Site C < Site D < Site A < Site B. The CEC of the ex-palm site (Site D) (10 cmol (+) kg−1) was comparable to published oil palm soil data of 8.2 cmol (+) kg−1 [38], while abandoned sites (Sites A and B) (25 and 30 cmol (+) kg−1, respectively) were closer to published CEC data for natural forest (26 cmol (+) kg−1). All values were higher than those reported from an oil palm plantation in Western Ghana of 3.0 and 2.3 cmol (+) kg−1 [62]. There is disagreement in the literature regarding the optimal soil CEC for oil palm production. Optimal ranges vary from 12 to 15 cmol (+) kg−1 [61,62] to >24 cmol (+) kg−1 [3].
4个油棕样点间的阳离子交换量均存在显著差异,大小顺序为样点C < 样点D < 样点A < 样点B。前油棕样点(样点D)的CEC(10 cmol (+) kg−1)与已发表的油棕土壤数据8.2 cmol (+) kg−1[38]相当,而废弃样点(样点A和B)的CEC(分别为25和30 cmol (+) kg−1)更接近已发表的天然林CEC数据(26 cmol (+) kg−1)。所有数值均高于加纳西部某油棕种植园报道的3.0和2.3 cmol (+) kg−1[62]。关于油棕生产的最佳土壤CEC,文献中存在分歧,最佳范围从12–15 cmol (+) kg−1[61,62]到 >24 cmol (+) kg−1[3]不等。
Both the clay content and the C concentration of soil samples increased in the order Site D < Site C < Site A < Site B (Table 3 and Figure 2). There was a positive correlation between the clay content of soils and C, which is consistent with clay minerals protecting organic matter from degradation [63,64], effectively affording soils with a higher clay content a higher C-holding capacity [65]. Across all soils, there were positive correlations between
土壤样品的黏粒含量和C浓度均按样点D < 样点C < 样点A < 样点B的顺序增加(表3和图2)。土壤黏粒含量与C呈正相关,这与黏土矿物保护有机质免于降解[63,64]、从而使黏粒含量较高的土壤具有较高固碳能力[65]的观点一致。在所有土壤中,以下变量之间存在正相关:
C and clay content (r = 0.43 S**), C and CEC (r = 0.51 S**), and clay content and CEC (r = 0.68 S**).
C与黏粒含量(r = 0.43 S**)、C与CEC(r = 0.51 S**)以及黏粒含量与CEC(r = 0.68 S**)。
3.2. Plant Macronutrients3.2. 植物大量营养元素
The average soil N ranged from 0.021% (ex-oil palm plantation, Site D) to 0.23% (abandoned sites, Sites A and B) (Table 3). The optimal soil N concentrations for oil palm growth ranged from 0.12% [61] to >0.15% [23]. The active site (Site C) did not contain higher N concentrations relative to the ex-oil palm site (Site D) and contained significantly lower N than the abandoned sites A and B. This falsified our hypothesis that the active site would contain higher N concentrations than the abandoned sites. Soils at both smallholder and ex-plantation sites (Sites C and D) were deficient in N, which would have contributed to reduced yields of palm oil. This is supported by the high C:N ratios at these sites of 60 and 95, respectively, which indicate that N may undergo rapid immobilisation in these soils [66] 1. In comparison, oil palm plantation soils in Nigeria had C:N ratios of 5 [67]. Nitrogen deficiency has been reported in smallholder plantations in Indonesia similar to Site C and attributed to sub-optimal fertiliser applications [23]. It is likely that the soils of the ex-plantation and smallholder sites (Sites C and D) may have experienced N depletion following a change in oil palm cultivation and subsequent inappropriate nutrient management. Wasis [38] reported a decrease in soil N from 0.32% to 0.06% following agricultural conversion in the Leuser region.
土壤平均N含量范围为0.021%(前油棕种植园,样点D)至0.23%(废弃样点,样点A和B)(表3)。油棕生长的最佳土壤N浓度为0.12%[61]至 >0.15%[23]。在产样点(样点C)的N浓度并不高于前油棕样点(样点D),且显著低于废弃样点A和B。这否定了我们关于在产样点N浓度高于废弃样点的假设。小农样点和前种植园样点(样点C和D)的土壤均缺N,这可能导致棕榈油产量下降。这些样点较高的C:N比(分别为60和95)支持了这一点,表明N在这些土壤中可能发生快速固持[66] 1。相比之下,尼日利亚油棕种植园土壤的C:N比为5[67]。已有研究报道,印度尼西亚与样点C类似的小农种植园存在缺N现象,并将其归因于施肥不足[23]。前种植园和小农样点(样点C和D)的土壤很可能在油棕种植方式改变及随后不当的养分管理后发生了N耗竭。Wasis[38]报道,Leuser地区农业转化后土壤N由0.32%降至0.06%。
The average total P in soils ranged from 118 mg kg−1 (Site D) to 323 mg kg−1 (rubber plantation) (Table 3). The range of mean P concentrations in all soils was low compared to the world average of 650 mg kg−1 [68] and to the range of 200–1500 mg kg−1 [69]. Deficiencies in soil P exist in smallholder plantations in Indonesia [23], and P deficiency is common in crops grown on weathered acidic soils including Acrisols/Oxisols and Ultisols [70]. These soils typically have capacity for high P fixation, resulting in reduced plant uptake of P. Fertilisers are usually scattered on the soil surface in oil palm plantations around the base of palms. This, combined with management practices such as weed clearing and growing on landscapes with a >6◦ slope has high potential to result in soil and fertiliser run-off during rainfall events and may limit production [3,26,38,71–73]. As Sumatra experiences ca. 3000 mm of rainfall annually [74], high erosion rates are common in this region [75]. Soil erosion in oil palm plantations removes topsoil as well as soil P and may lead to eutrophication of nearby surface water. Phosphorus limitation in cereal crops has been shown to lead to global yield gaps [76], and generally, P deficiency is recognised as an important factor affecting crop yields [77]. Following this, it is likely that the low P concentrations in the oil palm soils may be contributing to yield limitations at these sites.
土壤平均全P含量范围为118 mg kg−1(样点D)至323 mg kg−1(橡胶种植园)(表3)。所有土壤的平均P浓度范围均低于世界平均值650 mg kg−1[68]及200–1500 mg kg−1的范围[69]。印度尼西亚小农种植园存在土壤缺P现象[23],在强淋溶土/氧化土和老成土等风化酸性土壤上种植的作物普遍缺P[70]。这些土壤通常具有较高的固P能力,导致植物对P的吸收减少。油棕种植园中肥料通常撒施于油棕树基部周围的土壤表面。这一做法与除草以及在坡度 >6◦的地貌上种植等管理措施相结合,极易在降雨事件中导致土壤和肥料径流流失,并可能限制生产[3,26,38,71–73]。由于苏门答腊年降雨量约为3000 mm[74],该地区侵蚀速率普遍较高[75]。油棕种植园的土壤侵蚀会带走表土及土壤P,并可能导致附近地表水体富营养化。研究表明,谷类作物的P限制导致了全球产量差距[76],而且缺P通常被认为是影响作物产量的重要因素[77]。据此,油棕土壤中较低的P浓度很可能是这些样点产量受限的原因之一。
Potassium and Mg at all sites were below global average soil concentrations of 14,000 and 5000 mg kg−1, respectively [68]. Low K and Mg concentrations are typical of weathered, acidic soils with low-K parent materials and high K and Mg leaching, due to high precipitation [70]. Woittiez et al. [23] reported K deficiencies in >80% of smallholder plantation soils surveyed in Indonesia, as well as visual signs of Mg deficiency. Globally, K outputs from soil exceed K inputs, and this is especially pronounced in Global South countries where access to K fertilisers is more limited than in the Global North [78]. Woittiez et al. [23] identified K deficiency as a potential leading cause of sub-optimal yields in smallholder oil palm plantations and attributed this to the use of subsidised NPK fertilisers with poor nutrient balances for oil palm requirements. It is possible that a lack of access to K fertilisers adequate for palm and rubber production is responsible for the low K concentrations in soils from the palm and rubber sites.
所有样点的K和Mg均低于全球土壤平均浓度(分别为14,000和5000 mg kg−1)[68]。K和Mg浓度低是风化酸性土壤的典型特征,这类土壤母质K含量低,且由于降水量大,K和Mg淋溶强烈[70]。Woittiez et al.[23]报道,在印度尼西亚调查的小农种植园土壤中 >80% 缺K,并观察到缺Mg的可见症状。在全球范围内,土壤K输出超过K输入,这在K肥获取比全球北方更受限的全球南方国家尤为明显[78]。Woittiez et al.[23]认为缺K可能是小农油棕种植园产量不佳的主要原因之一,并将其归因于使用了养分配比不符合油棕需求的补贴NPK肥料。缺乏适合油棕和橡胶生产的K肥,可能是油棕和橡胶样点土壤K浓度低的原因。
3.3. Total Trace Element Concentrations3.3. 微量元素全量浓度
Except for elevated concentrations of Zn and Pb, TE concentrations (Table 4) in palm soils were generally similar to background concentrations. No concentrations of TEs in palm soils exceeded SGVs for agricultural soils.
除Zn和Pb浓度升高外,油棕土壤中的微量元素浓度(表4)总体与背景浓度相近。油棕土壤中没有任何微量元素浓度超过农业土壤的SGVs。
| Site样点 | A (n = 25) | B (n = 25) | C (n = 10) | D (n = 25) | Rubber Plantation (n = 32)橡胶 种植园 (n = 32) |
|---|---|---|---|---|---|
| Cr | 34(1.1) c | 25(0.90) b | 27(1.4) bc | 50(3.7) d | 5.03(0.20) a |
| Mn | 281(56) b | 519(87) c | 876(82) d | 28(3.7) a | 2995(52) e |
| Co | 19(2.3) c | 19(1.5) c | 16(0.36) c | 3.4(0.42) a | 8.9(0.12) b |
| Ni | 29(2.0) d | 30(1.5) d | 13(0.61) c | 7.9(0.58) b | 4.5(0.40) a |
| Cu | 19(1.4) c | 38(0.86) d | 5.6(0.69) b | 1.1(0.22) a | 6.6(0.49) b |
| Zn | 91(3.7) b | 91(3.8) b | 75(5.2) b | 19(1.4) a | 213(5.7) c |
| Ge | 0.86(0.051) b | 1.0(0.79) b | 1.05(0.36) b | 0.54(0.028) a | 1.7(0.034) c |
| As | 3.8(0.14) bc | 4.3(0.16) c | 9.0(0.59) d | 3.7(0.28) ab | 3.1(0.12) a |
| Sr | 24(2.2) c | 14(1.4) b | 48(13) d | 6.1(0.67) a | 4.3(0.16) a |
| Mo | 1.5(0.17) b | 2.0(0.15) c | 0.13(0.0068) a | 0.30(0.080) a | 0.095(0.0038) a |
| Cd | 0.14(0.026) bc | 0.087(0.024) ac | 0.085(0.029) ab | 0.026(0.0073) a | 0.16(0.012) b |
| Ce | 22(1.9) a | 23(2.5) a | 55(1.6) b | 17(0.83) a | 139(1.9) c |
| Pb | 16(0.70) b | 17(1.2) b | 28(1.8) c | 5.8(1.2) a | 51(0.53) d |
Abandoned and smallholder sites (Sites A, B and C) all contained soil concentrations of Zn and Pb above background levels of 50 and 10 mg kg−1, respectively [68]. Although elevated, concentrations of Zn and Pb did not surpass SGVs. However, Zn concentrations were present at these three sites at >50% of the limits (a benchmark used in environmental monitoring) [79] for Denmark and the EU, indicating that accumulation should be monitored at the remaining active smallholder site (Site C) and further Zn inputs to soils should be limited to prevent accumulation which could impede production. Our concentrations were comparable to published values of 99 mg kg−1 Zn in Malaysian palm soils [80] and 14 mg kg−1 Pb in Nigerian palm plantation soils [81]. Soils from the smallholder site (Site C) also contained As above the background level of 5 mg kg−1 [82], but below SGVs for the US (18 mg kg−1), Canada (17 mg kg−1) and New Zealand (20 mg kg−1) [83]. Again, as As in the smallholder site (Site C) soil was present at >50% SGVs, inputs should be monitored here. No reports could be identified for the comparison of As in palm plantation soils. The natural background concentration of Cu in soil is 20 mg kg−1 [68], which was surpassed in soils at one abandoned site (Site B). The concentrations here breached 50% of SGV levels for Canada (63 mg kg−1) and the US (70 mg kg−1) [83]. Copper was reported up to 69 mg kg−1 in Nigerian palm plantations [81]. The elevated Cu, Zn, As and Pb were likely a result of agrichemical use during palm production at these sites. Zinc, As and Pb are all common contaminants of phosphate fertilisers [12], while Cu is a common active ingredient in pesticides used in horticultural production [84], and in particular, the production of oil palm [13,25]. One abandoned site (Site B) may have had higher rates of fungicide application, leading to its significantly higher soil Cu concentrations.
废弃样点和小农样点(样点A、B和C)土壤中的Zn和Pb浓度均高于背景水平(分别为50和10 mg kg−1)[68]。尽管有所升高,Zn和Pb浓度并未超过SGVs。然而,这三个样点的Zn浓度达到丹麦和欧盟限值的 >50%(环境监测中使用的基准)[79],表明应对仍在生产的小农样点(样点C)的累积情况进行监测,并应限制土壤的进一步Zn输入,以防止累积妨碍生产。本研究测得的浓度与已发表的马来西亚油棕土壤Zn含量99 mg kg−1[80]以及尼日利亚油棕种植园土壤Pb含量14 mg kg−1[81]相当。小农样点(样点C)土壤中的As也高于背景水平5 mg kg−1[82],但低于美国(18 mg kg−1)、加拿大(17 mg kg−1)和新西兰(20 mg kg−1)的SGVs[83]。同样,由于小农样点(样点C)土壤中As含量达到SGVs的 >50%,应对该样点的输入进行监测。未能检索到有关油棕种植园土壤As含量的比较报道。土壤中Cu的自然背景浓度为20 mg kg−1[68],一个废弃样点(样点B)的土壤超过了该值。该处浓度超过了加拿大(63 mg kg−1)和美国(70 mg kg−1)SGV水平的50%[83]。据报道,尼日利亚油棕种植园中Cu含量高达69 mg kg−1[81]。Cu、Zn、As和Pb的升高很可能是这些样点在油棕生产期间施用农用化学品所致。Zn、As和Pb均为磷肥中常见的杂质[12],而Cu是园艺生产[84]特别是油棕生产[13,25]所用农药中的常见有效成分。一个废弃样点(样点B)可能施用了较多的杀菌剂,导致其土壤Cu浓度显著较高。
Deficiencies in Mo, defined as <2 mg kg−1 [82], were present at all sites except one of the abandoned sites (Site B). Our total Mo concentrations were comparable to those of Golow et al. [85] from palm plantations in Ghana. Several TEs measured in our soils were present at concentrations less than or comparable to natural background levels in soils. These included Cr (5.03–50 mg kg−1), Co (3.4–19 mg kg−1), Ni (4.5–30 mg kg−1), Ge (0.54–1.7 mg kg−1) and Cd (0.026–0.16 mg kg−1)—all non-essential plant TEs—with average backgrounds of 100, 40, 22, 2 and 0.06 mg kg−1, respectively [68,86–88]. These measured TE concentrations were comparable to those reported in palm plantation soils in Nigeria, Ghana and Papua New Guinea [80,81,89,90].
除一个废弃样点(样点B)外,所有样点均存在Mo缺乏(定义为 <2 mg kg−1[82])。本研究的全Mo浓度与Golow et al.[85]在加纳油棕种植园的测定结果相当。本研究土壤中测定的若干微量元素浓度低于或接近土壤自然背景水平,包括Cr(5.03–50 mg kg−1)、Co(3.4–19 mg kg−1)、Ni(4.5–30 mg kg−1)、Ge(0.54–1.7 mg kg−1)和Cd(0.026–0.16 mg kg−1),均为植物非必需微量元素,其平均背景值分别为100、40、22、2和0.06 mg kg−1[68,86–88]。这些微量元素测定浓度与尼日利亚、加纳和巴布亚新几内亚油棕种植园土壤的报道值相当[80,81,89,90]。
For all TEs except As, Mo, Cd and Ce, soils from the ex-plantation site (Site D) had significantly lower mean total concentrations compared to other palm sites (Sites A, B and C). Despite being present in higher concentrations compared to some other sites, these
除As、Mo、Cd和Ce外,前种植园样点(样点D)土壤中所有微量元素的平均全量浓度均显著低于其他油棕样点(样点A、B和C)。尽管与部分其他样点相比浓度较高,但这些
TEs were below background concentrations in the ex-plantation site (Site D) (6, 2, 0.06 and 49 mg kg−1 for As, Mo, Cd and Ce, respectively) [68,91]. In general, the ex-plantation site (Site D) had no elevated concentrations of TEs above expected background concentrations. Trace elements at this site were lower compared to the other sites, as it is no longer in production and the trees have been cleared—a process which may have resulted in the erosion and run-off of topsoil [92] and any associated TEs contained there [75].
微量元素在前种植园样点(样点D)中仍低于背景浓度(As、Mo、Cd和Ce分别为6、2、0.06和49 mg kg−1)[68,91]。总体而言,前种植园样点(样点D)没有任何微量元素浓度高于预期背景浓度。该样点的微量元素低于其他样点,原因是其已停止生产且树木已被清除,这一过程可能导致表土[92]及其中所含微量元素[75]的侵蚀和径流流失。
There were significant differences between rubber and palm sites for total Cr, Mn, Co, Ni, Zn, Ce and Pb, presented in Table 4. Concentrations of Cr and Ni were lower in the rubber plantation compared to all four palm soils, while Mn, Zn, Ce and Pb were higher in the rubber plantation. The mean Mn, Zn, Ce and Pb concentrations in the rubber plantation (2995, 213 and 139 mg kg−1, respectively) were higher than global background levels (850, 50, 49 and 10 mg kg−1, respectively) [68,91]. The Mn concentration present here was higher than would be expected from geogenic sources [93], while Zn concentrations at this site exceeded the SGVs for agricultural land from Canada (200 mg kg−1), the EU (94 mg kg−1 added Zn) 2, the US (160 mg kg−1) and Denmark (100 mg kg−1) [83]. These Zn concentrations may be phytotoxic, and this may limit production at the rubber site [94]. The elevated Mn and Zn in the rubber plantation may be a result of fungicides—namely mancozeb—used to treat pests including Corynespora cassiicola which causes leaf fall disease in rubber trees [95]. Mancozeb is an ethylenebisdithiocarbamate compound containing Mn and Zn as active ingredients [96,97]. Dithiocarbamate compounds (including Zn dithiocarbamate) [98] are used in rubber production to accelerate vulcanisation (hardening) [99]; thus if used in the rubber plantation, they may have led to Mn and Zn inputs in soils through direct prolonged or repeated accidental or careless exposure of these compounds to soils.
橡胶样点与油棕样点之间在全量Cr、Mn、Co、Ni、Zn、Ce和Pb方面存在显著差异(见表4)。橡胶种植园中Cr和Ni浓度低于全部4个油棕土壤,而Mn、Zn、Ce和Pb浓度则高于油棕土壤。橡胶种植园中Mn、Zn、Ce和Pb的平均浓度(分别为2995、213和139 mg kg−1)高于全球背景水平(分别为850、50、49和10 mg kg−1)[68,91]。此处的Mn浓度高于地质来源的预期值[93],而该样点的Zn浓度超过了加拿大(200 mg kg−1)、欧盟(94 mg kg−1外源添加Zn)2、美国(160 mg kg−1)和丹麦(100 mg kg−1)的农业用地SGVs[83]。这些Zn浓度可能具有植物毒性,并可能限制橡胶样点的生产[94]。橡胶种植园中Mn和Zn的升高可能源于杀菌剂(即代森锰锌),该药剂用于防治包括引起橡胶树落叶病的Corynespora cassiicola在内的病害[95]。代森锰锌是一种以Mn和Zn为有效成分的乙撑双二硫代氨基甲酸盐化合物[96,97]。二硫代氨基甲酸盐化合物(包括二硫代氨基甲酸锌)[98]在橡胶生产中用于促进硫化(硬化)[99];因此,若橡胶种植园使用了这些化合物,则可能因其长期直接或反复意外或不慎接触土壤而导致Mn和Zn进入土壤。
While Ce has no specified toxicity thresholds in soil [100], it has been found to decrease germination speed and reduce plant biomass, particularly in tropical acidic soils [101], and to be increasingly taken up into the roots and shoots of plants as soil pH decreases [102]. An HC5 (hazardous concentration for 5% of plant species) value of 281.6 mg kg−1 was calculated for tropical Oxisols and Inceptisols [101]. As such, Ce concentrations in soils from the rubber plantation may not yet impact production; however, they have potential to do so in the future if accumulation continues. Lead concentrations in the rubber plantation, while elevated—likely as a result of phosphate fertiliser use [12,103]—did not breach international SGVs 3 (70 mg kg−1 in Canada, 120 mg kg−1 in US, 166 mg kg−1 added Pb in EU and 300 mg kg−1 in New Zealand) [83] and are unlikely to affect production; however, they may pose issues in the future if allowed to accumulate past SGVs.
尽管Ce在土壤中没有规定的毒性阈值[100],但已有研究发现其会降低种子萌发速度并减少植物生物量,在热带酸性土壤中尤为明显[101],且随着土壤pH降低,植物根和地上部对Ce的吸收增加[102]。已计算得出热带氧化土和始成土(Inceptisols)的HC5(对5%植物物种有害的浓度)值为281.6 mg kg−1[101]。因此,橡胶种植园土壤中的Ce浓度可能尚未影响生产,但若持续累积,则可能在未来产生影响。橡胶种植园中的Pb浓度虽有所升高(可能源于磷肥施用[12,103]),但并未超过国际SGVs 3(加拿大70 mg kg−1、美国120 mg kg−1、欧盟166 mg kg−1外源添加Pb、新西兰300 mg kg−1)[83],不太可能影响生产;但若任其累积超过SGVs,未来可能会带来问题。
Given the low pH of the soils, both non-essential and essential cations will be relatively soluble [104]. Ca(NO3)2 extractable concentrations of TEs, used to calculate KD values, are presented in Supplementary Materials Table S2. When calculated KD values were compared to KD values for arable or pasture soils, Mn, Ni, Zn, Sr, Cd, Ce and Pb (arable/pasture soil KD: 22,000, 3000, 6000, 190, 3000, 88,000 and 25,000, respectively) [104,105] were more soluble in palm soils at all sites (Table 5). Cobalt was more soluble in abandoned and ex-plantation sites (Sites A, B and D) (arable soil KD 1800) [104], while Mo was more soluble at the smallholder and ex-plantation sites (Sites C and D) and less soluble at abandoned sites (Sites A and B) compared with arable soils (KD 240) [104]. Toxicity of these TEs may occur at lower concentrations than SGVs suggest in these palm soils due to the acidic soil environment and associated increase in solubility and plant uptake. Additionally, P may become even less plant available in these soils due to its strong specific adsorption onto oxyhydroxides which occurs in acidic environments [69].
鉴于土壤pH较低,非必需和必需阳离子的溶解度均相对较高[104]。用于计算KD值的微量元素Ca(NO3)2可提取态浓度列于补充材料表S2。将计算所得KD值与耕地或牧场土壤的KD值比较发现,Mn、Ni、Zn、Sr、Cd、Ce和Pb(耕地/牧场土壤KD分别为22,000、3000、6000、190、3000、88,000和25,000)[104,105]在所有样点的油棕土壤中溶解度均更高(表5)。Co在废弃样点和前种植园样点(样点A、B和D)中溶解度更高(耕地土壤KD为1800)[104];与耕地土壤(KD为240)相比,Mo在小农样点和前种植园样点(样点C和D)中溶解度更高,而在废弃样点(样点A和B)中溶解度较低[104]。由于酸性土壤环境及随之增加的溶解度和植物吸收,这些微量元素在油棕土壤中可能在低于SGVs所示的浓度下即产生毒性。此外,由于在酸性环境中P会强烈专性吸附于羟基氧化物上,P在这些土壤中对植物的有效性可能进一步降低[69]。
Chromium was less soluble in palm soils compared with arable soils (KD 270) [104]. Compared to other TEs, Cu was less soluble in palm soils, particularly at the smallholder site (Site C). This may be due to Cu association with organic matter and Fe and Al oxides in these soils, which strongly bind Cu, decreasing its mobility [106]. Therefore, Cu may be less available to plants, and the exceedance of SGVs at Site B may not result in any negative effect on oil palm yield, despite high total concentrations.
与耕地土壤(KD为270)相比,Cr在油棕土壤中溶解度较低[104]。与其他微量元素相比,Cu在油棕土壤中溶解度较低,尤其是在小农样点(样点C)。这可能是由于这些土壤中Cu与有机质以及Fe、Al氧化物结合,这些组分可强烈结合Cu,降低其迁移性[106]。因此,Cu对植物的有效性可能较低,尽管样点B的全量浓度较高并超过SGVs,但可能不会对油棕产量产生负面影响。
| Site样点 | A | B | C | D |
|---|---|---|---|---|
| Cr | 3179 | 2651 | 2900 | 5849 |
| Co | 279 | 195 | 2344 | 156 |
| Ni | 46 | 26 | 1389 | 25 |
| Cu | 904 | 358 | 5643 | 933 |
| Zn | 72 | 42 | 172 | 52 |
| Ge | 649 | 128 | 481 | 148 |
| As | 127 | 46 | 150 | 61 |
| Sr | 23 | 26 | 83 | 35 |
| Mo | 420 | 1615 | 43 | 28 |
| Ce | 658 | 102 | 615 | 106 |
| Pb | 175 | 76 | 257 | 37 |
Total and Ca(NO3)2 extractable concentrations of Pd, Te, Re, Ir and Hg are presented in Supplementary Materials Table S3. These TEs were present in concentrations <0.1 mg kg−1 and were considered to have no environmental consequences. Total Ag and Cs for the rubber plantation soils are also presented in Supplementary Materials Table S3.
Pd、Te、Re、Ir和Hg的全量及Ca(NO3)2可提取态浓度列于补充材料表S3。这些微量元素浓度 <0.1 mg kg−1,被认为不具有环境影响。橡胶种植园土壤的全量Ag和Cs也列于补充材料表S3。
3.4. Factors Controlling the Variation between Sites3.4. 控制样点间差异的因素
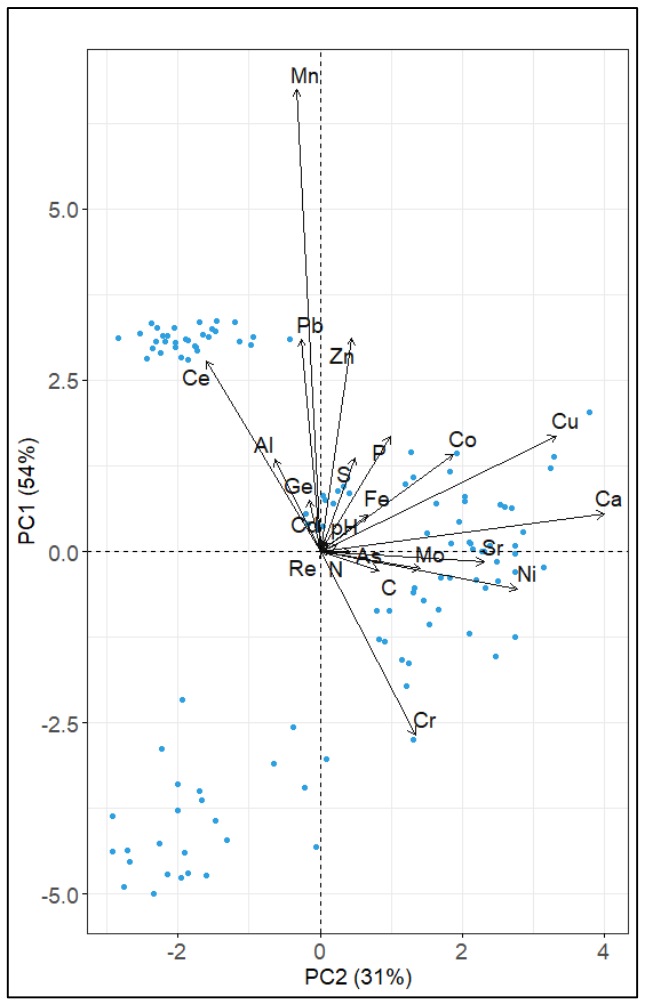
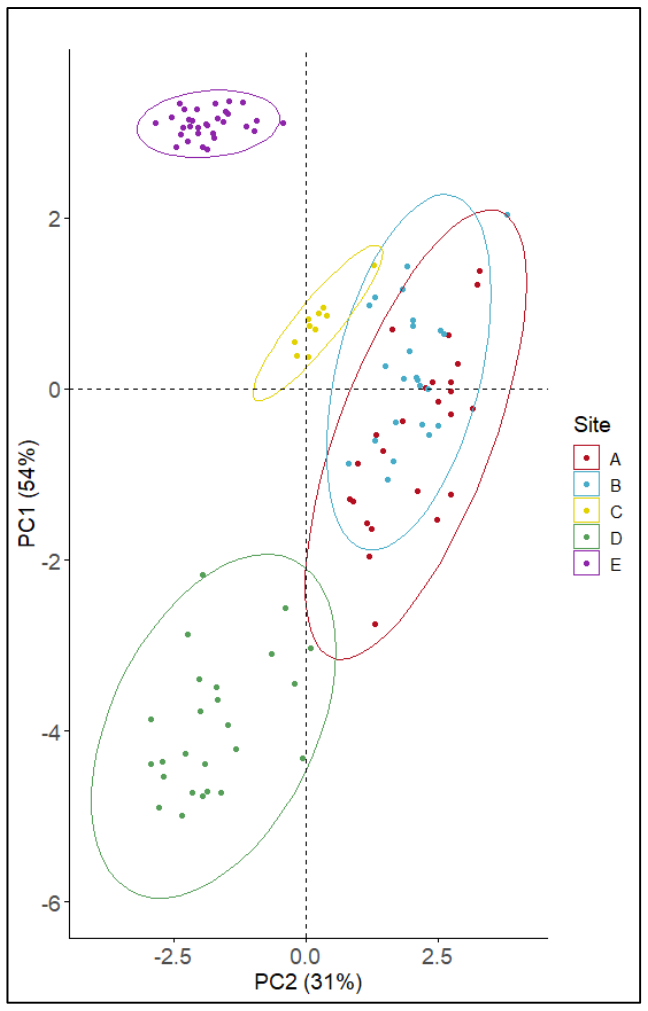
Principal component one (PC1) explained 53.9% of the variation between soils and was dominated by Mn, Zn, Pb, Ce and Cr in descending order (Figure 3a). Principal component two (PC2) explained 31% of the variance and was dominated (in descending order) by Ca, Cu, Ni, Sr, Co and Ce. The five sites formed distinct groups in the PCA plot (Figure 3b), with some overlap occurring between the two adjacent abandoned sites (Sites A and B). Soils from the rubber plantation had distinct chemistry, separating it from the four sites under palm production. This is attributed to the history of land use and production.
第一主成分(PC1)解释了土壤间53.9%的变异,按降序主要由Mn、Zn、Pb、Ce和Cr决定(图3a)。第二主成分(PC2)解释了31%的变异,主要由(按降序)Ca、Cu、Ni、Sr、Co和Ce决定。5个样点在PCA图中形成了明显的分组(图3b),两个相邻的废弃样点(样点A和B)之间存在部分重叠。橡胶种植园土壤具有独特的化学特征,与4个油棕生产样点明显分开。这归因于土地利用和生产历史。
The chemistry of the oil palm sites (Sites A, B, C and D) separated out according to a combination of edaphic and anthropogenic factors when a PCA was carried out using only soils from the four palm sites (see Supplementary Materials Figure S1 for PCA results of palm sites including general soil parameters).
仅使用4个油棕样点的土壤进行PCA时,油棕样点(样点A、B、C和D)的化学特征根据土壤因素与人为因素的综合作用而分离(包括一般土壤参数在内的油棕样点PCA结果见补充材料图S1)。
3.5. Intra-Site Correlations3.5. 样点内相关性
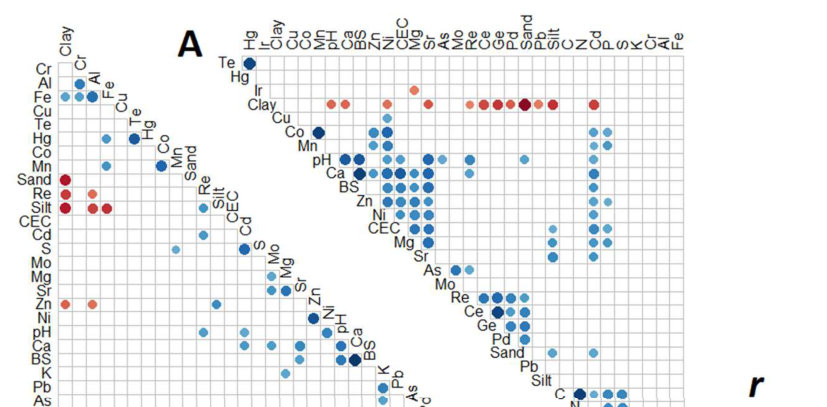
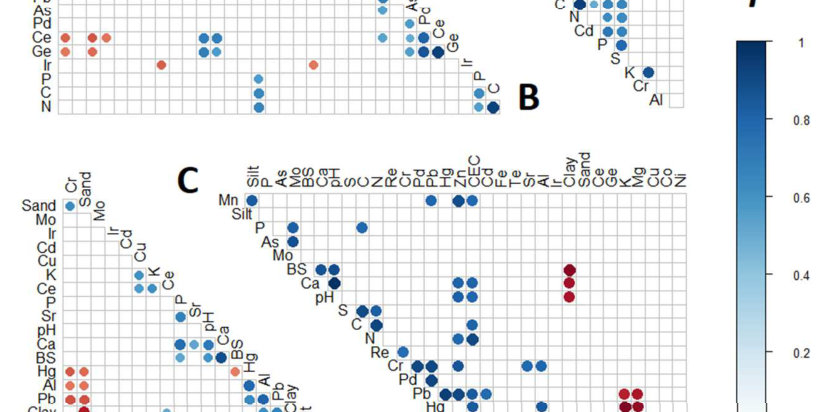
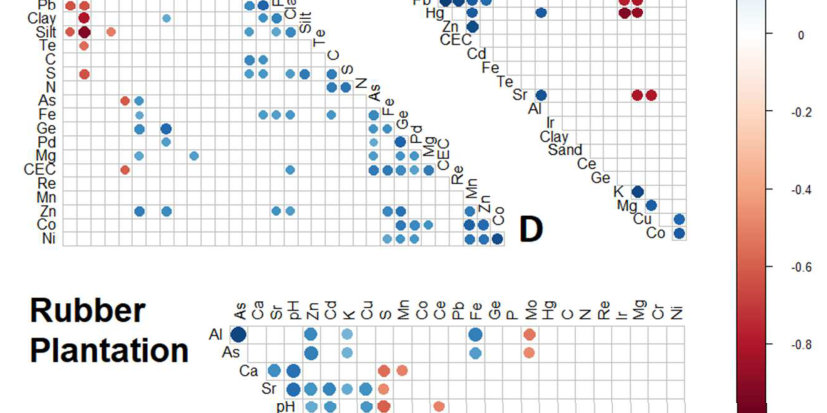
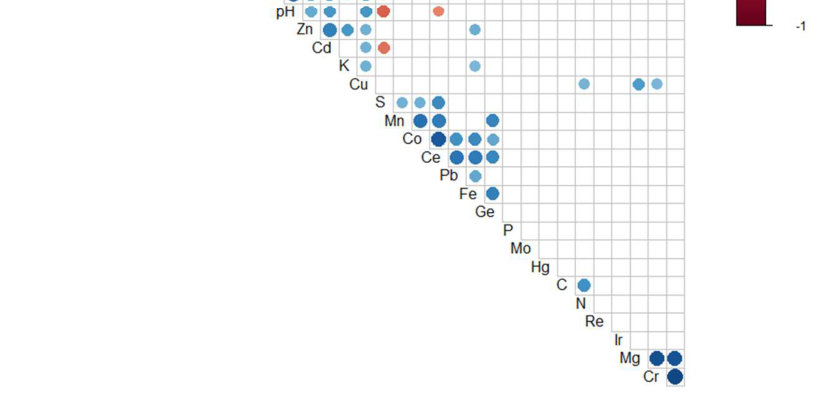
Correlograms for all five sites are presented in Figure 4. All correlations presented are statistically significant (p < 0.01). Soil variables are grouped by hierarchical clustering, whereby similarly behaving variables which share common correlations are grouped closer together.
5个样点的相关图见图4。图中所示相关性均具有统计显著性(p < 0.01)。土壤变量按层次聚类分组,具有共同相关性、行为相似的变量被归为较近的一组。
At abandoned and smallholder sites (Sites A, B and C), there was a common positive correlation between P and C (r = 0.66 S**, 0.64 S** and 0.79 S*, respectively). At abandoned sites (Sites A and B), P was positively correlated with N (r = 0.62 S** and 0.56 S*, respectively). As organic P in soils positively correlates with organic matter, the correlations at the smallholder and abandoned sites indicate that soil P at these sites was mostly associated with organic matter in the soil and was unavailable to plants [107]. Carbon, N and S were mutually positively correlated at all palm sites (0.63 < r < 0.94 S*-S**), indicating that most of the N and S in soils at these sites were also organically associated. In the rubber plantation, C and N positively correlated (r = 0.61 S**); however, there were no other significant correlations between C, N, P and S. This indicates that in contrast to the palm sites, N, P and S in soils from the rubber plantation were associated with the mineral phase of the soil and may have been more plant available.
在废弃样点和小农样点(样点A、B和C),P与C之间普遍存在正相关(r分别为0.66 S**、0.64 S**和0.79 S*)。在废弃样点(样点A和B),P与N呈正相关(r分别为0.62 S**和0.56 S*)。由于土壤有机P与有机质呈正相关,小农样点和废弃样点的上述相关性表明,这些样点的土壤P主要与土壤有机质结合,对植物不可利用[107]。在所有油棕样点,C、N和S之间均相互呈正相关(0.63 < r < 0.94 S*-S**),表明这些样点土壤中的大部分N和S也与有机质结合。在橡胶种植园中,C与N呈正相关(r = 0.61 S**),但C、N、P和S之间不存在其他显著相关性。这表明与油棕样点不同,橡胶种植园土壤中的N、P和S与土壤矿物相结合,对植物的有效性可能更高。
There is some evidence of agricultural correlation with TEs in the palm plantation soils when P is used as a proxy for agriculture. Phosphorus correlated positively with Co (r = 0.52 S*), Mn (r = 0.58 S*), Zn (r = 0.51 S*) and Cd (r = 0.72 S**) at one abandoned site (Site A), with Mo at the smallholder site (Site C) (r = 0.81 S*) and with Sr (r = 0.67 S**) at the ex-plantation site (Site D). All of these TEs are present within fertilisers, and thus these correlations are typical of past or present agricultural sites [12,108]. Where P does not correlate with TEs, we reject the hypothesis that TEs are fertiliser-derived and conclude that any present are likely geogenic.
以P作为农业活动的指示指标时,有证据表明棕榈种植园土壤中的微量元素(TEs)与农业活动相关。在一个弃耕样地(样地A),磷与Co(r = 0.52 S*)、Mn(r = 0.58 S*)、Zn(r = 0.51 S*)和Cd(r = 0.72 S**)呈正相关;在小农户样地(样地C),磷与Mo呈正相关(r = 0.81 S*);在原种植园样地(样地D),磷与Sr呈正相关(r = 0.67 S**)。上述微量元素均存在于肥料中,因此这些相关性是过去或当前农业用地的典型特征[12,108]。在P与微量元素不相关的情况下,我们拒绝微量元素来源于肥料的假设,并认为所存在的微量元素可能为地质成因。
Correlations existed between variables which would typically be expected in soils [109,110]: BS positively correlated with pH at all four palm sites (0.59 < r < 0.91 S*-S**). Although not shown in Figure 4, soil pH also correlated negatively with Ca(NO3)2 extractable Al at abandoned sites (Site A r = −0.93 S**, Site B r = −0.89 S**) and the smallholder site (Site C r = −0.95 S**), and correlated negatively with extractable Fe at both abandoned sites (Site A r = −0.74 S**, Site B r = −0.66 S**). Calcium positively correlated with both BS (0.88 < r < 0.96 S**) and pH (0.71 < r < 0.99 S**) at all palm sites.
各变量之间存在土壤中通常预期的相关性[109,110]:在全部4个棕榈样地中,盐基饱和度(BS)均与pH呈正相关(0.59 < r < 0.91 S*-S**)。尽管图4中未显示,土壤pH在弃耕样地(样地A r = −0.93 S**,样地B r = −0.89 S**)和小农户样地(样地C r = −0.95 S**)还与Ca(NO3)2可提取态Al呈负相关,在两个弃耕样地均与可提取态Fe呈负相关(样地A r = −0.74 S**,样地B r = −0.66 S**)。在所有棕榈样地中,钙均与BS(0.88 < r < 0.96 S**)和pH(0.71 < r < 0.99 S**)呈正相关。
Concentrations of Ca(NO3)2 extractable cationic TEs including Cr, Ni, Cu, Zn and Cd (see Supplementary Materials Table S2) typically negatively correlate with pH, as increasing soil pH can lower the availability of TEs in soil solution [111,112]. While Ca(NO3)2 extractable TEs were not included in the correlograms, this was the case at one abandoned site (Site A), where pH negatively correlated with Ca(NO3)2 extractable
Ca(NO3)2可提取态阳离子型微量元素(包括Cr、Ni、Cu、Zn和Cd,见补充材料表S2)的浓度通常与pH呈负相关,因为土壤pH升高会降低土壤溶液中微量元素的有效性[111,112]。尽管相关图中未纳入Ca(NO3)2可提取态微量元素,但在一个弃耕样地(样地A)确实存在这种情况,其pH与Ca(NO3)2可提取态
Cr (r = −0.51 S*), Ni (r = −0.65 S**), Zn (r = −0.85 S**) and Ce (r = −0.55 S*). At the other abandoned site (Site B), pH negatively correlated with Ca(NO3)2 extractable Cu (r = −0.55 S*) and Zn (r = −0.58 S**), while at the smallholder site (Site C), pH negatively correlated with Ca(NO3)2 extractable Ge (r = −0.86 S*) and Ce (r = −0.87 S*).
Cr(r = −0.51 S*)、Ni(r = −0.65 S**)、Zn(r = −0.85 S**)和Ce(r = −0.55 S*)呈负相关。在另一个弃耕样地(样地B),pH与Ca(NO3)2可提取态Cu(r = −0.55 S*)和Zn(r = −0.58 S**)呈负相关;而在小农户样地(样地C),pH与Ca(NO3)2可提取态Ge(r = −0.86 S*)和Ce(r = −0.87 S*)呈负相关。
4Conclusions结论
The chemical composition and plant nutrient status of the soils we have investigated under oil palm and rubber production have shown that these soils had low fertility and were nutrient poor. Generally, they were acidic with low P concentrations. Soil N, P and S were associated with organic matter in palm production soils, which was low compared to published data on forest soils from this region. Production at palm sites is likely to be severely limited by a deficiency in N, P, K, Mg and Mo in soils. Consistent with our hypothesis, there was evidence of agriculturally derived TEs accumulating in both rubber and palm soils. Manganese, Zn, Ce and Pb were significantly higher in rubber soils, likely due to the application of these TEs as ingredients or contaminants in agrichemicals at this site. These TEs may already limit production. In addition, palm soils contained elevated concentrations of Cu, Zn, As and Pb. Based on KD values, most TEs were more soluble in soils under oil palm production compared to other arable production, likely due to the low pH of these tropical soils. Consequently, toxicity thresholds may be reached at lower concentrations than SGVs suggest. Soils under rubber production were chemically distinct from soils under palm production and the chemistry at palm sites was consistent with that of soils with a short fertiliser history. While our sites varied in terms of landscape elements and prior or current management, the trends in the data were consistent. This indicates that nutrient deficiencies may be present in oil palm production soils throughout Indonesia. Correction of nutrient deficiencies in these oil palm plantations would necessitate significant fertiliser inputs in soils which would be of considerable cost and negatively affect the economic revenue gained through oil palm production. These inputs would also lead to increased TE loadings in soils, exacerbating issues of TE accumulation. As Cu, Zn, As and Pb were already elevated at both active and former oil palm production sites, likely as a result of fertiliser use, these TEs in particular are likely to accumulate past SGVs and eventually limit production with increased fertiliser inputs. This has implications for the sustainability of a regionally significant production system across Southeast Asia. Subsidised oil palm production may not be economically viable, but it still results in the degradation of significant areas of tropical ecosystems for production that are challenged by low soil fertility, and sometimes abandoned. Further work should determine whether oil palm production would be economically viable without subsidies, particularly on soils converted from primary forest. Such an analysis should include quantification of the costs and ecological impacts of applying sufficient fertiliser to enable economically viable palm production, including the resultant TE loading to soils. This analysis should consider local ecosystem values and the opportunity costs associated with the loss of forest ecosystems that provide numerous ecosystem services.
本研究对油棕和橡胶种植土壤的化学组成及植物养分状况的调查表明,这些土壤肥力低、养分贫乏。总体而言,土壤呈酸性且P浓度较低。在棕榈种植土壤中,土壤N、P和S与有机质相关,而其有机质含量低于该地区森林土壤的已发表数据。棕榈样地的生产可能受到土壤中N、P、K、Mg和Mo缺乏的严重限制。与我们的假设一致,有证据表明来源于农业的微量元素在橡胶和棕榈土壤中均有累积。橡胶土壤中的Mn、Zn、Ce和Pb显著较高,这可能是由于该样地施用的农用化学品中含有这些微量元素(作为成分或杂质)。这些微量元素可能已对生产造成限制。此外,棕榈土壤中Cu、Zn、As和Pb的浓度升高。基于KD值,与其他耕作生产相比,大多数微量元素在油棕种植土壤中的溶解性更高,这可能与这些热带土壤的低pH有关。因此,毒性阈值可能在低于土壤指导值(SGVs)所示的浓度下即已达到。橡胶种植土壤在化学性质上与棕榈种植土壤明显不同,而棕榈样地的土壤化学特征与施肥历史较短的土壤相符。尽管各样地在景观要素以及过去或当前的管理方式上存在差异,但数据所呈现的趋势是一致的。这表明印度尼西亚各地的油棕种植土壤可能普遍存在养分缺乏问题。要纠正这些油棕种植园的养分缺乏,需向土壤投入大量肥料,这将产生可观的成本,并对油棕生产所获得的经济收益产生负面影响。这些投入还将导致土壤微量元素负荷增加,加剧微量元素累积问题。由于Cu、Zn、As和Pb在现有及原有油棕种植样地中均已升高(很可能是施肥所致),随着肥料投入的增加,这些微量元素尤其可能累积至超过SGVs的水平,并最终限制生产。这对东南亚一个具有区域重要性的生产体系的可持续性具有重要意义。受补贴的油棕生产可能在经济上并不可行,但它仍然导致大面积热带生态系统退化,而用于生产的这些土地受到土壤肥力低下的制约,有时甚至被弃耕。今后的研究应确定在没有补贴的情况下油棕生产是否具有经济可行性,尤其是在由原始森林转变而来的土壤上。此类分析应量化施用足量肥料以实现经济上可行的棕榈生产所需的成本及其生态影响,包括由此导致的土壤微量元素负荷。该分析还应考虑当地生态系统价值,以及丧失提供多种生态系统服务的森林生态系统所带来的机会成本。
Supplementary Materials: The following supporting information can be downloaded at: https: //www.mdpi.com/article/10.3390/land12122144/s1, Table S1: SRM recoveries of elements; Table S2: Ca(NO3)2 extractable concentrations of trace elements in soils under palm production; Table S3: Additional trace elements analysed; Figure S1: PCA results of four palm sites including general soil parameters.
补充材料:以下支持信息可从https: //www.mdpi.com/article/10.3390/land12122144/s1下载:表S1:各元素的标准参考物质(SRM)回收率;表S2:棕榈种植土壤中微量元素的Ca(NO3)2可提取态浓度;表S3:其他分析的微量元素;图S1:包含一般土壤参数的4个棕榈样地的PCA结果。
Author Contributions: H.T.-M., writing—original draft, formal analysis, visualisation. F.A., resources, writing—review and editing. S.M.A., resources, writing—review and editing. S.G., writing— review and editing, supervision. B.R., writing—review and editing, supervision. All authors have read and agreed to the published version of the manuscript.
作者贡献:H.T.-M.,撰写—初稿、形式分析、可视化。F.A.,资源、撰写—审阅与编辑。S.M.A.,资源、撰写—审阅与编辑。S.G.,撰写—审阅与编辑、指导。B.R.,撰写—审阅与编辑、指导。所有作者均已阅读并同意手稿的发表版本。
Funding: This work was supported by A Well Fed World; The Centre for Integrated Biowaste Research funded by Strategic Science Investment Funding from Ministry of Business, Innovation and Employment, New Zealand (contract C03X1701); and a University of Canterbury Doctoral Scholarship.
基金资助:本研究得到以下资助:A Well Fed World;由新西兰商业、创新与就业部战略科学投资基金资助的Centre for Integrated Biowaste Research(合同号C03X1701);以及坎特伯雷大学博士奖学金。
Data Availability Statement: The data that support the findings of this study are openly available at www.kiwiscience.com.
数据可用性声明:支持本研究结论的数据可在www.kiwiscience.com公开获取。
Acknowledgments: We acknowledge the help of the landowners and others who helped us to sample the research sites, without whom this work would not be possible.
致谢:感谢土地所有者以及其他协助我们在研究样地采样的人员,没有他们,本研究将无法完成。
Conflicts of Interest: The authors declare no conflict of interest.利益冲突:作者声明不存在利益冲突。
Notes注
1 Mineral N (NH4 and NO3) could not be measured due to the inability to import fresh soil into our laboratory.
1 由于无法将新鲜土壤进口至我们的实验室,未能测定矿质氮(NH4和NO3)。
2 This SGV applies to soil with pH 5.5, CEC 15 cmol (+) kg−1 and 15% clay content.
2 该SGV适用于pH 5.5、CEC 15 cmol (+) kg−1、黏粒含量15%的土壤。
3 SGVs specific to Indonesia were not identified.
3 未找到印度尼西亚专用的SGVs。
References参考文献
1. Gibbs, H.K.; Ruesch, A.S.; Achard, F.; Clayton, M.K.; Holmgren, P.; Ramankutty, N.; Foley, J.A. Tropical forests were the primary sources of new agricultural land in the 1980s and 1990s. Proc. Natl. Acad. Sci. USA 2010, 107, 16732–16737. [CrossRef]
2. Vancutsem, C.; Achard, F.; Pekel, J.-F.; Vieilledent, G.; Carboni, S.; Simonetti, D.; Gallego, J.; Aragão LE, O.C.; Nasi, R. Long-term (1990–2019) monitoring of forest cover changes in the humid tropics. Sci. Adv. 2021, 7, eabe1603. [CrossRef] [PubMed]
3. Corley, R.H.V.; Tinker, P.B.H. The Oil Palm, 5th ed.; Wiley: New York, NY, USA, 2015.
4. Kissinger, G. Fiscal Incentives for Indonesian Palm oil Production: Pathways for Alignment with Green Growth; United Nations Environment Programme: Nairobi, Kenya, 2016.
5. Bateman, I.J.; Fisher, B.; Fitzherbert, E.; Glew, D.; Naidoo, R. Tigers, markets and palm oil: Market potential for conservation. Oryx 2010, 44, 230–234. [CrossRef]
6. Fitzherbert, E.B.; Struebig, M.J.; Morel, A.; Danielsen, F.; Brühl, C.A.; Donald, P.F.; Phalan, B. How will oil palm expansion affect biodiversity? Trends Ecol. Evol. 2008, 23, 538–545. [CrossRef]
7. Morgans, C.L.; Meijaard, E.; Santika, T.; Law, E.; Budiharta, S.; Ancrenaz, M.; Wilson, K.A. Evaluating the effectiveness of palm oil certification in delivering multiple sustainability objectives. Environ. Res. Lett. 2018, 13, 064032. [CrossRef]
8. Wilcove, D.S.; Koh, L.P. Addressing the threats to biodiversity from oil-palm agriculture. Biodivers. Conserv. 2010, 19, 999–1007. [CrossRef]
9. Padfield, R.; Hansen, S.; Davies, Z.G.; Ehrensperger, A.; Slade, E.M.; Evers, S.; Papargyropoulou, E.; Bessou, C.; Abdullah, N.; Page, S.; et al. Co-producing a research agenda for sustainable palm oil [Original Research]. Front. For. Glob. Chang. 2019, 2, 1–17. [CrossRef]
10. Robinson, B.; Bolan, N.; Mahimairaja, S.; Clothier, B. Solubility, mobility, and bioaccumulation of trace elements: Abiotic processes in the rhizosphere. In Trace Elements in the Environment: Biogeochemistry, Biotechnology, and Bioremediation; CRC Press: Boca Raton, FL, USA, 2005; pp. 97–110.
11. Chapman, P.M. Determining When Contamination Is Pollution—Weight of Evidence Determinations for Sediments and Effluents. Environ. Int. 2007, 33, 492–501. [CrossRef]
12. Taylor, M.; Kim, N.; Smidt, G.; McNally, S.; Robinson, B.; Kratz, S.; Schnug, E. Trace element contaminants and radioactivity from phosphate fertilizer. In Phosphorus in Agriculture: 100% Zero; Schnug, E., De Kok, L.J., Eds.; Springer: Cham, Switzerland, 2016; pp. 231–266. [CrossRef]
13. Bivi MS, H.R.; Paiko, A.S.; Khairulmazmi, A.; Akhtar, M.S.; Idris, A.S. Control of basal stem rot disease in oil palm by supplementation of calcium, copper, and salicylic acid. Plant Pathol. J. 2016, 32, 396–406. [CrossRef]
14. Taghavi, M.; Darvishiyan, M.; Momeni, M.; Eslami, H.; Fallahzadeh, R.A.; Zarei, A. Ecological risk assessment of trace elements (TEs) pollution and human health risk exposure in agricultural soils used for saffron cultivation. Sci. Rep. 2023, 13, 4556. [CrossRef]
15. Miclean, M.; Cadar, O.; Levei, E.A.; Roman, R.; Ozunu, A.; Levei, L. Metal (Pb, Cu, Cd, and Zn) transfer along food chain and health risk assessment through raw milk consumption from free-range cows. Int. J. Environ. Res. Public Health 2019, 16, 4604. [CrossRef] [PubMed]
16. Gray, C.W.; Cavanagh, J.E. The state of knowledge of cadmium in New Zealand agricultural systems: 2021. N. Z. J. Agric. Res. 2022, 66, 285–335. [CrossRef]
17. Besnard, E.; Chenu, C.; Robert, M. Distribution of copper in champagne vineyards soils, as influenced by organic amendments. In Proceedings of the 5th International Conference on the Biogeochemistry of Trace Elements, Vienna, Austria, 11–15 July 1999; p. 416.
18. Foy, C.D. Physiological effects of hydrogen, aluminum, and manganese toxicities in acid soil. In Agronomy Monograph; Adams, F., Ed.; Wiley: New York, NY, USA, 1984. [CrossRef]
19. Hartemink, A.E. Soil science in tropical and temperate regions—Some differences and similarities. In Advances in Agronomy; Sparks, D.L., Ed.; Academic Press: Cambridge, MA, USA, 2002; Volume 77, pp. 269–292. Available online: https://www. sciencedirect.com/science/article/pii/S0065211302770168 (accessed on 25 May 2021).
20. Cooper, H.V.; Evers, S.; Aplin, P.; Crout, N.; Dahalan MP, B.; Sjogersten, S. Greenhouse gas emissions resulting from conversion of peat swamp forest to oil palm plantation. Nat. Commun. 2020, 11, 407. [CrossRef] [PubMed]
21. Woomer, P.L.; Martin, A.; Albrecht, A.; Resck DV, S.; Scharpens, H.W. The importance and management of soil organic matter in the tropics. In The Biological Management of Tropical Soil Fertility; Woomer, P.L., Swift, M.J., Eds.; Wiley-Sayce: New York, NY, USA, 1994. 22. Rahman, N.; Neergaard A d Magid, J.; Ven, G.W.; Giller, K.E.; Bruun, T.B. Changes in soil organic carbon stocks after conversion from forest to oil palm plantations in Malaysian Borneo. Environ. Res. Lett. 2018, 13, 105001. [CrossRef]
23. Woittiez, L.S.; Slingerland, M.; Giller, K.E. Yield gaps in Indonesian smallholder plantations: Causes and solutions. In Proceedings of the International Palm Oil Congress and Exhibition, Kuala Lumpur, Malaysia, 6–8 October 2015.
24. Ng, S.K. Nutrition and nutrient management of oil palm—New thrust for the future perspective. In Potassium for Sustainable Crop production: International Symposium on the Role of Potassium; Pasricha, N.S., Bansal, S.K., Eds.; Potash Research Institute of India and International Potash Institute: Haryana, India, 2002; pp. 415–429.
25. MPOB. Chemical Fertilizer Ganocare™ as Preventive Treatment in Controlling Ganoderma Disease of oil Palm; Malaysian Palm Oil Board TT No. 564. 2015. Available online: http://palmoilis.mpob.gov.my/publications/TOT/TT564-Idris.pdf (accessed on 25 May 2021).
26. Woittiez, L.S.; Slingerland, M.; Rafik, R.; Giller, K.E. Nutritional imbalance in smallholder oil palm plantations in Indonesia. Nutr. Cycl. Agroecosyst. 2018, 111, 73–86. [CrossRef]
27. Thompson-Morrison, H.; Gaw, S.; Robinson, B. An assessment of trace element accumulation in palm oil production. Sustainability 2022, 14, 4553. [CrossRef]
28. Wahid, M.B.; Abdullah, S.N.A.; Henson, I.E. Oil palm—Achievements and potential. Plant Prod. Sci. 2005, 8, 288–297. [CrossRef] 29. Woittiez, L.S.; Van Wijk, M.; Slingerland, M.; Van Noordwijk, M.; Giller, K. Yield gaps in oil palm: A quantitative review of contributing factors. Eur. J. Agron. 2017, 83, 57–77. [CrossRef]
30. Afriyanti, D.; Hein, L.; Kroeze, C.; Zuhdi, M.; Saad, A. Scenarios for withdrawal of oil palm plantations from peatlands in Jambi Province, Sumatra, Indonesia. Reg. Environ. Chang 2019, 19, 1201–1215. [CrossRef]
31. Pradipta, T. Abandoned Oil Palm Plantations to be Converted into Forests. The Palm Scribe. 2018. Available online: https: //thepalmscribe.id/abandoned-oil-palm-plantations-to-be-converted-into-forests/ (accessed on 17 March 2022).
32. Sari DA, P.; Falatehan, A.F.; Ramadhonah, R.Y. The social and economic impacts of peat land palm oil plantation in Indonesia. J. Phys. Conf. Ser. 2019, 1364, 012017. [CrossRef]
33. Rochayati, S.; Verloo, M.; Laing, G.D. Availability of cadmium and zinc as affected by the use of reactive phosphate rock, lime, and chicken manure on an indonesian acidic upland soil under field conditions. Commun. Soil Sci. Plant Anal. 2010, 41, 1986–2003. [CrossRef]
34. FAO; UNESCO. Soil Map of the World; FAO: Québec City, QC, Canada, 1976.
35. Encyclopedia Britannica. Acrisol. 2016. Available online: https://www.britannica.com/science/Acrisol (accessed on 25 May 2021). 36. Du, Z.; Yu, L.; Yang, J.; Xu, Y.; Chen, B.; Peng, S.; Zhang, T.; Fu, H.; Harris, N.; Gong, P. A global map of planting years of plantations. Sci. Data 2022, 9, 141. [CrossRef] [PubMed]
37. Asnur, P.; Thoha, A.S.; Elfiati, D. Mapping of Degraded Soil Properties in Gunung Leuser National Park. J. Sylva Indones. 2019, 2, 70–79. [CrossRef]
38. Wasis, B. Soil properties in natural forest destruction and conversion to agricultural land, in Gunung Leuser National Park, North Sumatera province. J. Trop. For. Manag. 2012, 18, 206–212. [CrossRef]
39. Schwarze, S.; Euler, M.; Gatto, M.; Hein, J.; Hettig, E.; Holtkamp, A.M.; Izhar, L.; Kunz, Y.; Lay, J.; Merten, J.; et al. Rubber vs. Oil Palm: An Analysis of Factors Influencing Smallholders’ Crop Choice in Jambi, Indonesia; EFForTS Discussion Paper Series, Issue. Georg-August-Universität. 2015. Available online: https://www.econstor.eu/bitstream/10419/117323/1/EFForTS_dp-11.pdf (accessed on 25 May 2021).
40. Ultisol. 2012. Available online: https://www.britannica.com/science/Ultisol (accessed on 25 May 2021).
41. Blakemore, L.C.; Searle, P.L.; Daly, B.K. Methods for chemical analysis of soils. N. Z. Soil Bur. Sci. Rep. 1987, 80.
42. US EPA. Method 3051A (SW-846): Microwave Assisted Acid Digestion of Sediments, Sludges, Soils, and Oils, Revision 1; US EPA: Washington, DC, USA, 2007.
43. Milestone. Digestion Method for Environmental Samples; Milestone: Williston, ND, USA, 2011.
44. NIST. Certificate of Analysis: Standard Reference Material 2710 Montana Soil; National Institute of Standards & Technology: Gaithersburg, MA, USA, 2003.
45. NIST. Certificate of Analysis: Standard Reference Material 2706 New Jersey Soil; National Institute of Standards & Technology: Gaithersburg, MA, USA, 2018.
46. Gray, C.W.; McLaren, R.G.; Roberts AH, C.; Condron, L.M. The effect of long-term phosphatic fertilizer applications on the amounts and forms of cadmium in soils under pasture in New Zealand. Nutr. Cycl. Agroecosyst. 1999, 54, 267–277. [CrossRef]
47. Hendershot, W.H.; Duquette, M. A simple barium chloride method for determing cation exchange capacity and exchangeable cations. Soil Sci. Soc. Am. J. 1986, 50, 605–608. [CrossRef]
48. LECO. Instrument: CN828 Determination of Carbon and Nitrogen in Soil. LECO Corportaion. 2021. Available online: https: //eu.leco.com/images/Analytical-Application-Library/CN828_SOIL_203-821-627.pdf (accessed on 3 March 2022).
49. Bohren, C.F.; Huffman, D.R. Absorption and Scattering of Light by Small Particles; Wiley: New York, NY, USA, 1998. [CrossRef]
50. Pansu, M.; Gautheyrou, J. Handbook of Soil Analysis: Mineralogical, Organic and Inorganic Methods; Springer: Berlin/Heidelberg, Germany, 2006.
51. USDA. USDA Textural Soil Classification; USD: Washington, DC, USA, 1987. Available online: https://www.nrcs.usda.gov/ Internet/FSE_DOCUMENTS/stelprdb1044818.pdf (accessed on 6 June 2021).
52. R Core Team. R: A Language and Environment for Statistical Computing. 2021. Available online: https://www.R-project.org/ (accessed on 6 June 2021).
53. Hothorn, T.; Bretz, F.; Westfall, P. Simultaneous inference in general parametric models. Biom. J. 2008, 50, 346–363. [CrossRef]
54. Kassambara, A.; Mundt, F. Factoextra: Extract and Visualize the Results of Multivariate Data Analyses. R Package Version 1.0.7. 2020. Available online: https://CRAN.R-project.org/package=factoextra (accessed on 6 June 2021).
55. Harrell, F.E. Hmisc: Harrell Miscellaneous. R Package Version 4.6-0. 2021. Available online: https://CRAN.R-project.org/ package=Hmisc (accessed on 6 June 2021).
56. Wei, T.; Simko, V. R Package ‘Corrplot’: Visualization of a Correlation Matrix (Version 0.92). 2021. Available online: https: //github.com/taiyun/corrplot (accessed on 20 September 2023).
57. Rao, I.M.; Zeigler, R.S.; Vera, R.; Sarkarung, S. Selection and breeding for acid-soil tolerance in crops. Bioscience 1993, 43, 454–465. [CrossRef]
58. Shofiyati, R.; Las, I.; Agus, F. Indonesian soil data base and predicted stock of soil carbon. In Proceedings of the International Workshop on Evaluation and Sustainable Management of Soil Carbon Sequestration in Asian Countries, Bogor, Indonesia, 28–29 September 2010.
59. Sanderman, J.; Hengl, T.; Fiske, G.J. Soil carbon debt of 12,000 years of human land use. Proc. Natl. Acad. Sci. USA 2017, 114, 9575–9580. [CrossRef]
60. van Noordwijk, M.; Cerri, C.; Woomer, P.L.; Nugroho, K.; Bernoux, M. Soil carbon dynamics in the humid tropical forest zone. Geoderma 1997, 79, 187–225. [CrossRef]
61. Goh, K.; Po, S.B. Fertilizer recommendation systems for oil palm: Estimating the fertilizer rates. In Proceedings of the MOSTA Best Practices Workshops-Agronomy and Crop Management, Kuala Lumpur, Malaysia, 27 March–14 August 2004.
62. Obeng, A.S.; Sadick, A.; Hanyabui, E.; Musah, M.; Marius, M.; Acheampong, M.K. Evaluation of soil fertility status in oil palm plantations in the Western Region of Ghana. Agric. Food 2020, 5, 938–949. [CrossRef]
63. Kahle, M.; Kleber, M.; Jahn, R. Predicting carbon content in illitic clay fractions from surface area, cation exchange capacity and dithionite-extractable iron. Eur. J. Soil Sci. 2002, 53, 639–644. [CrossRef]
64. Matus, F.; Rumpel, C.; Neculman, R.; Panichini, M.; Mora, M. Soil carbon storage and stabilisation in andic soils: A review. Catena 2014, 120, 102–110. [CrossRef]
65. Feng, W.; Plante, A.F.; Six, J. Improving estimates of maximal organic carbon stabilization by fine soil particles. Biogeochemistry 2013, 112, 81–93. [CrossRef]
66. Bengtsson, G.; Bengtson, P.; Månsson, K.F. Gross nitrogen mineralization-, immobilization-, and nitrification rates as a function of soil C/N ratio and microbial activity. Soil Biol. Biochem. 2003, 35, 143–154. [CrossRef]
67. Aweto, A.O.; Enaruvbe, G.O. Catenary properties of soil properties under oil palm plantations in southwetsern Nigeria. Ethiop. J. Environ. Stud. Manag. 2010, 3, 1–7. [CrossRef]
68. Mason, B.H.; Moore, C.B. Principles of Geochemistry; Wiley: New York, NY, USA, 1982; Available online: https://books.google.co. nz/books?id=K75gIAAACAAJ (accessed on 20 September 2023).
69. McLaren, R.G.; Cameron, K.C. Soil Ccience: Sustainable Production and Environmental Protection; Oxford University Press: Oxford, UK, 1996; Available online: https://books.google.co.nz/books?id=AYVFAQAAIAAJ (accessed on 20 September 2023).
70. Fageria, N.K.; Nascente, A.S. Chapter Six—Management of Soil Acidity of South American Soils for Sustainable Crop Production. In Advances in Agronomy; Sparks, D.L., Ed.; Academic Press: Cambridge, MA, USA, 2014; Volume 128, pp. 221–275. Available online: https://www.sciencedirect.com/science/article/pii/B9780128021392000068 (accessed on 6 June 2021).
71. Foster, H.L.; Tayeb DM, T. The effect of different methods of placement and frequency of application of fertilizer to oil palm on an inland soil in Peninsula Malaysia. Palm Oil Res. Inst. Malays. Bull. 1986, 12, 1–11.
72. Goh, K.J.; Härdter, R.; Fairhurst, T. Fertilizing for maximum return. In The Oil Palm: Management for Large and Sustainable Yields; Fairhurst, T., Härdter, R., Eds.; Phosphate Institute of Canada, Potash & Phosphate Institute, International Potash Institute: Zug, Switzerland, 2003; pp. 279–306.
73. Maene, L.M.; Thong, K.C.; Ong, T.S.; Mokhtaruddin, A.M.; Pushparajah, E. Surface wash under mature oil palm. In Proceedings of the 1979 Symposium on Water in Malaysian Agriculture, Kuala Lumpur, Malaysia, 16–17 March 1979.
74. Climate: North Sumatra. Available online: https://en.climate-data.org/asia/indonesia/north-sumatra-1204/ (accessed on 30 March 2022).
75. Aflizar Aprisal Alarima, C.I.; Masunaga, T. Effect of soil erosion and topography on distribution of cadmium (Cd) in Sumani watershed, west Sumatra, Indonesia. MATEC Web Conf. 2018, 229, 03001. [CrossRef]
76. Kvaki´c, M.; Pellerin, S.; Ciais, P.; Achat, D.L.; Augusto, L.; Denoroy, P.; Gerber, J.S.; Goll, D.; Mollier, A.; Mueller, N.D.; et al. Quantifying the Limitation to World Cereal Production Due To Soil Phosphorus Status. Glob. Biogeochem. Cycles 2018, 32, 143–157. [CrossRef]
77. Van De Wiel CC, M.; Van Der Linden, C.G.; Scholten, O.E. Improving phosphorus use efficiency in agriculture: Opportunities for breeding. Euphytica 2016, 207, 1–22. [CrossRef]
78. Manning DA, C. How will minerals feed the world in 2050? Proc. Geol. Assoc. 2015, 126, 14–17. [CrossRef]
79. Nokes, C. A Guide to the Ministry of Health Drinking-Water Standards for New Zealand; Environmental Science & Research Ltd.: Kenepuru, Porirua, 2008.
80. Aini Azura, A.; Fauziah, C.I.; Samsuri, A.W. Cadmium and zinc concentrations in soils and oil palm tissues as affected by long-term application of phosphate rock fertilizers. Soil Sediment Contam. Int. J. 2012, 21, 586–603. [CrossRef]
81. Olafisoye, B.O.; Oguntibeju, O.O.; Osibote, O.A. An assessment of the bioavailability of metals in soils on oil palm plantations in Nigeria. Pol. J. Environ. Stud. 2016, 25, 1125–1140. [CrossRef]
82. Hooda, P. Trace Elements in Soils; Wiley: New York, NY, USA, 2010.
83. Cavanagh, J.; Munir, K. Development of Soil Guideline Values for the Protection of Ecological Receptors (Eco-SGVs): Technical Document; Landcare Research: Lincoln, New Zealand, 2016.
84. Kiwifruit Vine Health. KVH Information Sheet: Copper Spray Information. 2019. Available online: https://www.kvh.org.nz/ vdb/document/91314 (accessed on 25 May 2021).
85. Golow, A.A.; Agyemang, O.; Ackah, M. Soil fertility analysis in two oil plam plantation towns in Assin, north district of the central region of Ghana. Aust. J. Basic Appl. Sci. 2010, 4, 1650–1655.
86. Iyaka, Y.A. Nickel in soils: A review of its distribution and impacts. Sci. Res. Essays 2011, 6, 6774–6777. [CrossRef]
87. Kaiser, S.; Wagner, S.; Moschner, C.; Funke, C.; Wiche, O. Accumulation of germanium (Ge) in plant tissues of grasses is not solely driven by its incorporation in phytoliths. Biogeochemistry 2020, 148, 49–68. [CrossRef]
88. Sheffer, F.; Schachtschabel, P.; Blume, H.-P. Scheffer/Schachtschabel Soil Science; Springer: Berlin/Heidelberg, Germany, 2016.
89. Cole, B.; Craven, J. Impacts of Oil Plam Activities in the Kokonda and Popondetta Catchments: An initial Environmental Examination. 2006. Available online: https://aarhusclearinghouse.unece.org/resources/impacts-oil-palm-activities-kokodaand-popondetta-catchments-initial-environmental (accessed on 25 May 2021).
90. Orobator, P.; Ashiriba, H.; Aighewi, I. Assessment of Heavy Metals Concentration in Soils under Selected Oil Palm (Elaeis guineensis) Plantations in Edo State, Nigeria. Academix. 2018. Available online: http://www.academix.ng/documents/papers/ 1524666819_6831.pdf (accessed on 6 June 2021).
91. Perelomov, L.V. Interaction of rare-earth elements with biotic and abiotic soil components. Agrokhimiya 2007, 11, 85–96.
92. Suryatmojo, H.; Fujimoto, M.; Kosugi, K.; Mizuyama, T. Runoff and soil erosion characteristics in different periods of an intensive forest management system in a tropical indonesian rainforest. Int. J. Sustain. Dev. Plan. 2014, 9, 830–846. [CrossRef]
93. Maynard, J.B. 7.11—Manganiferous Sediments, Rocks, and Ores. In Treatise on Geochemistr; Holland, H.D., Turekian, K.K., Eds.; Pergamon: Oxford, UK, 2003; pp. 289–308. Available online: https://www.sciencedirect.com/science/article/pii/B00804375160 70997 (accessed on 25 May 2021).
94. Chaney, R.L. Zinc phytotoxicity. In Zinc in Soils and Plants; Robson, A.D., Ed.; Springer: Berlin/Heidelberg, Germany, 1993; Volume 55. [CrossRef]
95. Fernando TH, P.S.; Jayasinghe, C.K.; Wijesundera RL, C.; Siriwardana, D. Screening of fungicides against Corynespora leaf fall disease of rubber under nursery conditions [Screening von Fungizidwirkungen gegenüber der Corynespora-Blattfallkrankheit in Baumschulen]. J. Plant Dis. Prot. 2010, 117, 117–121. [CrossRef]
96. Hurt, S.; Ollinger, J.; Arce, G.; Bui, Q.; Tobia, A.J.; Ravenswaay, B. Chapter 78—Dialkyldithiocarbamates (EBDCs). In Hayes’ Handbook of Pesticide Toxicology, 3rd ed.; Krieger, R., Ed.; Academic Press: Cambridge, MA, USA, 2010; pp. 1689–1710.
97. Mancino, C.R.; Holdren, D.D.; Tredway, L.; Soika, M.D.; Soika, M.D. Influence of mancozeb fungicides, chlorothalonil, manganese and zinc on bentgrass color and disease incidence. J. Turfgrass Manag. 1999, 3, 13–22.
98. Shi, F.; Li, X.; Bai, Y.; Li, L.; Pu, M.; Liu, L.; Lei, M. Mechanism of the Zinc Dithiocarbamate-Activated Rubber Vulcanization Process: A Density Functional Theory Study. ACS Appl. Polym. Mater. 2021, 3, 5188–5196. [CrossRef]
99. Gullino, M.L.; Tinivella, F.; Garibaldi, A.; Kemmitt, G.M.; Bacci, L.; Sheppard, B. Mancozeb: Past, present, and future. Plant Dis. 2010, 94, 1076–1087. [CrossRef] [PubMed]
100. Savichev, A.T.; Vodyanitskii, Y.N. Determination of barium, lanthanum, and cerium contents in soils by the X-ray radiometric method. Eurasian Soil Sci. 2009, 42, 1461–1469. [CrossRef]
101. Moreira, C.G.; de Carvalho, T.S.; de Carvalho, T.S.; de Oliveira, C.; de Abreu, L.B.; de Castro, A.C.S.; Ribeiro, P.G.; Bispo, F.H.A.; Boutin, C.; Guilherme, L.R.G. Ecological risk assessment of cerium for tropical agroecosystems. Chemosphere 2019, 221, 124–131. [CrossRef] [PubMed]
102. Thomas, P.J.; Carpenter, D.; Boutin, C.; Allison, J.E. Rare earth elements (REEs): Effects on germination and growth of selected crop and native plant species. Chemosphere 2014, 96, 57–66. [CrossRef]
103. Setyorini, D.; Prihatini, T.; Kurnia, U.; No, J.I.J. Pollution of Soil by Agricultural and Industrial Waste; Food and Fertilizer Technology Center: Taipei, Taiwan, 2002.
104. Sheppard, S.; Long, J.; Sanipelli, B.; Sohlenius, G. Solid/Liquid Partition Coefficients (Kd) for Selected Soils and Sediments at Forsmark and Laxemar-Simpevarp. Geological Survey of Sweden. 2009. Available online: http://www.skb.com/publication/19 51648/R-09-27.pdf (accessed on 25 May 2021).
105. Reiser, R.; Simmler, M.; Portmann, D.; Clucas, L.; Schulin, R.; Robinson, B. Cadmium concentrations in New Zealand pastures: Relationships to soil and climate variables. J. Environ. Qual. 2014, 43, 917–925. [CrossRef]
106. Oorts, K. Copper. In Heavy Metals in Soils: Trace Metals and Metalloids in Soils and Their Bioavailability; Alloway, B.J., Ed.; Springer: Berlin/Heidelberg, Germany, 2013; pp. 367–394. [CrossRef]
107. Wierzbowska, J.; Sienkiewicz, S.; Zalewska, M.; Zarczy´nski, P.; Krzebietke, S. Phosphorus fractions in soil fertilised with organic˙ waste. Environ. Monit. Assess. 2020, 192, 315. [CrossRef]
108. Németh, T.; Kiss, Z.; Kismányoky, T.; Lehoczky, É. Effect of Long-Term Fertilization on the Strontium Content of Soil. Commun. Soil Sci. Plant Anal. 2006, 37, 2751–2758. [CrossRef]
109. Born, I.; Jansson, G.; Johnsson, L. A field study on the influence of soil pH on trace element levels in spring wheat (Triticum aestivum), potatoes (Solanum tuberosum) and carrots (Daucus carota). Water Air Soil Pollut. 1995, 85, 835–840. [CrossRef]
110. Liu, W.; Yang, X.; Duan, L.; Naidu, R.; Yan, K.; Liu, Y.; Wang, X.; Gao, Y.; Chen, Y. Variability in plant trace element uptake across different crops, soil contamination levels and soil properties in the Xinjiang Uygur Autonomous Region of northwest China. Sci. Rep. 2021, 11, 2064. [CrossRef] [PubMed]
111. Kim, K.-R.; Kim, J.-G.; Park, J.-S.; Kim, M.-S.; Owens, G.; Youn, G.-H.; Lee, J.-S. Immobilizer-assisted management of metalcontaminated agricultural soils for safer food production. J. Environ. Manag. 2012, 102, 88–95. [CrossRef] [PubMed]
112. Kim, M.-S.; Min, H.-G.; Lee, S.-H.; Kim, J.-G. The effects of various amendments on trace element stabilization in acidic, neutral, and alkali soil with similar pollution index. PLoS ONE 2016, 11, e0166335. [CrossRef] [PubMed]
Disclaimer/Publisher’s Note: The statements, opinions and data contained in all publications are solely those of the individual author(s) and contributor(s) and not of MDPI and/or the editor(s). MDPI and/or the editor(s) disclaim responsibility for any injury to people or property resulting from any ideas, methods, instructions or products referred to in the content.