Article
Claudia Garcés-Hernández 1,*, Brett Robinson 1, Claudio Bravo-Linares 2 , Hamish Lowe 3, Seinalyn Villanueva 4, Jennifer Prosser 3 and María-Jesús Gutiérrez-Ginés 4,5
1 School of Physical and Chemical Sciences, University of Canterbury, Christchurch 8041, New Zealand
1 坎特伯雷大学物理与化学科学学院,基督城 8041,新西兰
2 Facultad de Ciencias, Instituto de Ciencias Químicas, Universidad Austral de Chile, Independencia 631, Valdivia 5090000, Chile
2 智利南方大学理学院化学科学研究所,Independencia 631,Valdivia 5090000,智利
3 Lowe Environmental Impact (LEI), Palmerston North 4410, New Zealand
3 Lowe Environmental Impact (LEI),Palmerston North 4410,新西兰
4 Institute of Environmental Science and Research (ESR), Christchurch 8041, New Zealand
4 环境科学与研究所(ESR),基督城 8041,新西兰
5 School of Earth and Environment, University of Canterbury, Christchurch 8041, New Zealand
5 坎特伯雷大学地球与环境学院,基督城 8041,新西兰
* Correspondence: claudia.garceshernandez@pg.canterbury.ac.nz
Abstract: Disposal of biosolids, the solid fraction of sewage treatment, is a global environmental issue. Biosolids contain valuable organic matter and plant nutrients; however, they also contain contaminants including trace elements, xenobiotics, and pathogens. The quality of the biosolids greatly depends on the source of wastewater (i.e., industrial vs. domestic) and the treatment processes. We aimed to determine the potential of three distinct biosolids and one pond sludge to grow indigenous plants for ecosystem restoration. For each amendment, we tested six indigenous species, Veronica salicifolia, Corokia cheesemanii, Griselinia littoralis, Phormium tenax, Poa cita, and Cordyline australis in bark mixed with biosolids and/or pond sludge at rates of 0–50%. There was a significant positive correlation between plant growth and biosolid addition up to a species-dependent plateau. Growth decreased at the highest rates. At a rate of 10% for fresh biosolids and 30% for aged biosolids provided consistent optimal growth across all species. The pond sludge was unsuitable for the establishment of indigenous seedlings. At the optimal rates, there were significant increases in foliar N, P, K, S, and Zn. None of the trace elements accumulated in the plants at phytotoxic concentrations or levels that presented a risk to ecosystems. Future work should determine how plants raised with biosolids perform once planted out in the field.
摘要:生物固体(污泥)是污水处理产生的固体部分,其处置是一个全球性的环境问题。生物固体含有宝贵的有机质和植物养分,但同时也含有微量元素、外源性化合物和病原体等污染物。生物固体的质量在很大程度上取决于废水来源(即工业废水与生活污水)及处理工艺。本研究旨在确定三种不同生物固体和一种氧化塘污泥用于培育本土植物以开展生态系统恢复的潜力。针对每种改良剂,在以0–50%比例掺混生物固体和/或氧化塘污泥的树皮基质中测试了六种本土植物:Veronica salicifolia、Corokia cheesemanii、Griselinia littoralis、Phormium tenax、Poa cita和Cordyline australis。植物生长与生物固体添加量之间呈显著正相关,直至达到一个因物种而异的平台期;在最高添加比例下生长下降。新鲜生物固体10%和陈化生物固体30%的添加比例可使所有物种均获得稳定的最佳生长。氧化塘污泥不适于本土幼苗的定植。在最佳添加比例下,叶片N、P、K、S和Zn含量显著增加。植物中各微量元素的积累均未达到植物毒性浓度或对生态系统构成风险的水平。今后的工作应明确以生物固体培育的植物移栽至田间后的表现。
Keywords: biosolids; indigenous plants; nurseries; nitrogen; optimal rate; fertiliser; ecosystem restoration; seedlings
关键词:生物固体;本土植物;苗圃;氮;最佳施用量;肥料;生态系统恢复;幼苗
Academic Editors: Roberta Ferrentino and Michela Langone
Received: 15 March 2024 Revised: 9 April 2024 Accepted: 22 April 2024 Published: 25 April 2024
Copyright: © 2024 by the authors. Licensee MDPI, Basel, Switzerland. This article is an open access article distributed under the terms and conditions of the Creative Commons Attribution (CC BY) license (https:// creativecommons.org/licenses/by/ 4.0/).
版权:© 2024 作者所有。被许可方MDPI,巴塞尔,瑞士。本文为开放获取文章,依据知识共享署名(CC BY)许可协议(https:// creativecommons.org/licenses/by/ 4.0/)条款发布。
1Introduction引言
Biosolids are a treated, secondary by-product from the wastewater treatment process [1]. Continuous growth of the global population combined with increased inflows to wastewater treatment plants (WWTPs) facilities results in increasing amounts of biosolids produced [2]. Jones et al. 2021 and Di Giacomo and Romano 2022 [3,4] estimated between 360 and 380 km3 of wastewater are generated globally every year, resulting in 45 million t yr−1 of sludge on a dry matter basis [5]. New Zealand (NZ) produces ca. 66,000 t yr−1 biosolids (363,000 t yr−1 fresh weight) [6].
生物固体是废水处理过程中经处理的二次副产物[1]。全球人口的持续增长以及污水处理厂(WWTPs)进水量的增加,导致生物固体产量不断上升[2]。Jones et al. 2021和Di Giacomo and Romano 2022 [3,4]估计,全球每年产生360–380 km3废水,按干物质计产生污泥45 million t yr−1 [5]。新西兰(NZ)每年产生生物固体约66,000 t yr−1(鲜重363,000 t yr−1)[6]。
The moisture content of biosolids ranges from 4 to 85% [7], with organic matter comprising 50 to 70% of the solid fraction [8]. Biosolids have significant amounts of plant macronutrients, especially N, P, K, S, Ca and Mg [9]. Variation of plant nutrients in biosolids are affected by age and the origin of the influent and stabilisation processes [8,10,11]. As an example, younger or fresh biosolids typically contain a higher concentration of valuable plant nutrients than older and/or composted biosolids [12,13]. Total N ranges from 1.9 to 8%, with decreasing content as the biosolids age [13]. Phosphorus concentrations average 2% [14–16]. Biosolids can have biologically significant concentrations of both essential and non-essential trace elements (TEs) that can affect plant growth positively or deleteriously [17]. Other contaminants in biosolids include pathogens, per- and polyfluoroalkyl substances (PFAS), microplastics, pharmaceuticals, personal care products, or endocrine disruptors [2,18–20].
生物固体的含水率为4%–85% [7],其中有机质占固体部分的50%–70% [8]。生物固体含有大量植物大量营养元素,尤其是N、P、K、S、Ca和Mg [9]。生物固体中植物养分的差异受其陈化时间、进水来源及稳定化工艺的影响[8,10,11]。例如,较新或新鲜的生物固体通常比较陈旧和/或经堆肥处理的生物固体含有更高浓度的宝贵植物养分[12,13]。全氮含量为1.9%–8%,并随生物固体陈化而降低[13]。磷浓度平均为2% [14–16]。生物固体中必需和非必需微量元素(TEs)的浓度可能具有生物学意义,对植物生长产生正面或有害的影响[17]。生物固体中的其他污染物包括病原体、全氟和多氟烷基物质(PFAS)、微塑料、药品、个人护理品或内分泌干扰物[2,18–20]。
Current practices for biosolid management vary between countries and include incineration [21], landfilling [22], ocean discharge [6], construction materials [23], and land application [24]. The application to agricultural soil was a widely used option [9,13,15,24,25] in the early 2000s. In the EU and USA, more than 50% of the biosolids were applied to agricultural soils [26]. Land application has decreased in some European countries due to changes in environmental regulation [25]. In New Zealand, biosolid reuse is restricted by cultural and social concerns of contaminants present in the biosolids entering the food chain [27]. Therefore, some 75% of biosolids are disposed of in landfills, monofills, or discharged into the ocean, and just 3% are used in agriculture [6]. Forestry and land restoration are alternative strategies for biosolid management [28,29]. These methods not only facilitate sustainable biosolid management, but they also contribute to environmental conservation.
目前各国的生物固体管理方式不尽相同,包括焚烧[21]、填埋[22]、海洋排放[6]、用作建筑材料[23]以及土地利用[24]。在21世纪初,施用于农业土壤曾是一种广泛采用的方式[9,13,15,24,25]。在欧盟和美国,超过50%的生物固体被施用于农业土壤[26]。由于环境法规的变化,一些欧洲国家的土地利用量已有所下降[25]。在新西兰,出于对生物固体中污染物进入食物链的文化和社会顾虑,生物固体的再利用受到限制[27]。因此,约75%的生物固体被填埋、单一填埋或排入海洋,仅3%用于农业[6]。林业和土地恢复是生物固体管理的替代策略[28,29]。这些方式不仅有助于实现生物固体的可持续管理,也有利于环境保护。
Biosolid reuse can extend beyond large-scale land restoration into more controlled environments such as nurseries [30,31]. The incorporation of organic waste materials, including biosolids, to replace classic growing media as peat or commercial substrate has been gaining attention since 1984 [30,32]. This approach is particularly relevant for non-food production such as ornamental or forestry plants [30,33–36]. Studies in the past have explored the benefits of this practice in nurseries, highlighting its potential as an efficient alternative for growing healthy plants [37].
生物固体的再利用可从大规模土地恢复延伸至苗圃等更可控的环境[30,31]。自1984年以来,利用包括生物固体在内的有机废弃物替代泥炭或商品基质等传统栽培基质日益受到关注[30,32]。该方法尤其适用于观赏植物或林木等非食用作物的生产[30,33–36]。以往研究探讨了这一做法在苗圃中的益处,强调其作为培育健康植株的高效替代方案的潜力[37]。
The incorporation of biosolids as a part of potting mix can reduce the need for artificial fertilisers for the supplement of plant nutrients. However, the uptake of trace elements may negatively affect local ecosystems and possibly breach local regulations. High concentrations of trace elements, such as Zn, may lead to phytotoxicity [38], where the indigenous Brazilian species Myracrodruon urundeuva, in combination with other factors such as biosolids not being properly treated/stabilised, has led to a total plant mortality. This highlights the importance of choosing appropriate biosolids, considering the origin and appropriate application rates.
将生物固体作为盆栽基质的组分,可减少为补充植物养分而对化学肥料的需求。然而,微量元素的吸收可能对当地生态系统产生负面影响,并可能违反当地法规。高浓度的微量元素(如Zn)可能导致植物毒性[38];巴西本土物种Myracrodruon urundeuva在此类因素与生物固体未经妥善处理/稳定化等其他因素共同作用下,出现了植株全部死亡。这凸显了在考虑来源和适宜施用量的基础上选择合适生物固体的重要性。
In New Zealand, many indigenous plants are adapted to low fertility soil [39,40]. Studies with biosolids in combination with low fertility soil under several application types showed that biosolids can promote plant growth at increasing rates of application; however, at rates over 12% w/w, the biosolid application may be detrimental for indigenous plants. For example, it hindered the plant growth of Leptospermum scoparium [41]. Similarly, Reis et al., 2017, and Seyedalikhani et al., 2019 [42,43], showed improved nutrient status and increased plant biomass after indigenous plants were grown in low fertility soils with biosolid incorporation. This also led to an increased uptake of Zn and Cd. However, the foliar concentrations were below threshold values for both phytotoxic and animal consumption. Most research has focused on incorporating biosolids to low fertility soil for potential land reforestation. However, the use of biosolids to create substrates in nurseries and their potential for seedlings has been less investigated.
在新西兰,许多本土植物适应于低肥力土壤[39,40]。将生物固体与低肥力土壤结合并采用多种施用方式的研究表明,随着施用量的增加,生物固体可促进植物生长;然而,当施用量超过12% w/w时,生物固体可能对本土植物有害。例如,其抑制了Leptospermum scoparium的生长[41]。类似地,Reis et al., 2017和Seyedalikhani et al., 2019 [42,43]的研究表明,本土植物在掺入生物固体的低肥力土壤中生长后,养分状况得到改善,植物生物量增加。这同时也导致Zn和Cd吸收量的增加,但叶片浓度均低于植物毒性阈值和动物食用阈值。大多数研究侧重于将生物固体掺入低肥力土壤以用于潜在的土地再造林,而利用生物固体制备苗圃基质及其对幼苗的潜在作用则研究较少。
In addition, given the wide variety of biosolids being produced, with contrasting chemical composition and characteristics, as mentioned previously, there is a lack of knowledge (or missed opportunity) on comparing the response of a range of indigenous species to several kinds of biosolids.
此外,如前所述,所产生的生物固体种类繁多,化学组成和特性差异显著,而关于一系列本土物种对多种生物固体响应的比较,目前尚缺乏认识(或者说是一个尚未把握的机会)。
Previous research [39,41–43] has shown that increasing the concentration of contrasting biosolids will increase plant growth to a certain rate, from where higher application rates will have a deleterious effect on plant growth.
以往研究[39,41–43]表明,提高不同生物固体的浓度会使植物生长增加至某一施用量,超过该施用量后,更高的施用量将对植物生长产生有害影响。
We hypothesise that the optimum rate of biosolid application will depend on the type of biosolids and the plant species. The second hypothesis is that plant nutrients and trace elements will be higher in biosolid substrates compared with substrates without biosolids. Subsequently, this will allow us to assess the nutritional status of the plants as well as to identify the potential risks of trace element uptake by the plants at the optimal application rate.
我们假设,生物固体的最佳施用量取决于生物固体的类型和植物物种。第二个假设是,与不含生物固体的基质相比,含生物固体基质中植物的养分和微量元素含量更高。据此,我们可以评估植物的营养状况,并识别在最佳施用量下植物吸收微量元素的潜在风险。
This research aimed to identify an optimal application rate for indigenous plants based on diverse biosolids in a controlled environment, specifically, by analysing the produced dry biomass of indigenous plants. We also aimed to assess the chemical composition on leaves of indigenous NZ species.
本研究旨在于可控环境中,通过分析本土植物的干生物量,确定基于多种生物固体的本土植物最佳施用量。我们还旨在评估新西兰本土物种叶片的化学组成。
2Materials and Methods材料与方法
2.1. Experimental Setup2.1. 试验设置
Twenty-five kg of three distinct biosolids and pond sludge was obtained from various wastewater treatment plants in New Zealand. Biosolids 1 and 2 (B1 and B2) were anaerobically digested biosolids from two cities. Biosolids 3 (B3) were anaerobically digested and composted, and pond sludge (PS) was 60-year-old geobag pond sludge. Composted bark fines from Natural Bark & Compost (Foxton, Manawatu, New Zealand) were used as a substrate to be mixed with the biosolids due to their low nutrient and high moisture retention capacity [44,45] (Table 1).
从新西兰多个污水处理厂获取三种不同生物固体和氧化塘污泥各25 kg。生物固体1和2(B1和B2)为来自两个城市的厌氧消化生物固体。生物固体3(B3)经厌氧消化并堆肥处理,氧化塘污泥(PS)为已有60年历史的土工袋氧化塘污泥。由于堆肥化树皮细料养分含量低且持水能力高[44,45](表1),选用Natural Bark & Compost公司(Foxton, Manawatu, 新西兰)的堆肥化树皮细料作为与生物固体混合的基质。
Two of the biosolids were basic (B1 and B2), while two were acidic (B3 and pond sludge). The biosolids, but not the pond sludge, were rich in C, N, P, S, and K relative to the bark. All the materials contained elevated concentrations of Cu and Zn relative to the bark and to background concentrations of these elements in the soils [46].
其中两种生物固体呈碱性(B1和B2),另两种呈酸性(B3和氧化塘污泥)。与树皮相比,各生物固体(氧化塘污泥除外)富含C、N、P、S和K。相对于树皮以及土壤中这些元素的背景浓度,所有材料的Cu和Zn浓度均较高[46]。
| Parameter参数 | B1 | B2 | B3 | PS | Bark Fines树皮细料 | Biosolid Guidelines *生物固体 指南值 * |
|---|---|---|---|---|---|---|
| Moisture content (%) | 80 | 21 | 66 | 39 | 53 | - |
| Electrical Conductivity (mS m_−_1) | 248 | 618 | 419 | 54.5 | 13.2 | - |
pH | 8.1 | 7.2 | 6.4 | 4.2 | 5.6 | - |
| Organic matter (%) | 72 | 75 | 39 | 8.1 | 58 | - |
| Total Organic Carbon (%) | 34 | 39 | 20 | 3.1 | 23 | - |
| Total Nitrogen (%) | 6 | 4.9 | 1.89 | 0.35 | 0.26 | - |
NH4-N | 12,500 | 3700 | 6 | 240 | 6 | - |
| NO3-N | <3.4 | 15.2 | 2400 | 3.2 | 5.7 | - |
| Ca | 18,000 | 24,000 | 21,000 | 2000 | 8700 | - |
| Mg | 10,900 | 2000 | 3100 | 2900 | 1580 | - |
| P | 27,000 | 8900 | 13,300 | 1090 | 520 | - |
| K | 2000 | 760 | 10,200 | 940 | 1590 | - |
| Na | 720 | 4200 | 1550 | 108 | 300 | - |
| Mn | 139 | 1170 | 350 | 240 | 165 | - |
| As | 5 | 5 | 11 | 5 | 2 | 20–30 |
| Cd | 0.81 | 0.39 | 0.51 | 0.028 | <0.10 | 0.1–10 |
| Cr | 21 | 17,300 | 19 | 19 | 6 | 600–1500 |
| Cu | 240 | 108 | 61 | 128 | 8 | 100–1250 |
| Pb | 19.9 | 12.2 | 66 | 23 | 4.8 | 300 |
| Ni | 18 | 28 | 8 | 12 | 5 | 60–135 |
| Zn | 620 | 380 | 300 | 175 | 41 | 300–1500 |
Note: * The lower limit indicates maximum concentration for class a biosolids (unrestricted use) while the higher limit indicates maximum concentration for class b biosolids, a limit above which biosolids are not suitable for reuse on land [48].
注:* 下限表示A级生物固体(无限制使用)的最高浓度,上限表示B级生物固体的最高浓度,超过该限值的生物固体不适于土地再利用[48]。
The biosolids and compost were passed through a 12 mm sieve and homogenised for 20 min. Subsamples of the homogenised biosolids and bark fines were collected for further analysis. Six indigenous species with different ecological requirements (Supplementary Material—Table S1) were selected from those commonly grown in nurseries to be used in indigenous plantings along the country. These were collected from the Garner Park nursery (Levin). The species grown were the following: Veronica salicifolia
生物固体和堆肥过12 mm筛并混匀20 min。采集混匀后的生物固体和树皮细料子样品用于后续分析。从苗圃中常见栽培、用于全国各地本土植被种植的物种中,选取了六种生态需求各异的本土物种(补充材料—表S1)。这些植物采自Garner Park苗圃(Levin)。所栽培的物种如下:Veronica salicifolia
G.Forst [49,50], Poa cita Edgar [51–53], Corokia cheesemanii Turril [54,55], Phormium tenax J.R.Forst & G.Forst [49,56,57], Griselinia littoralis Raoul [51], and Cordyline australis (G.Forst.) Endl. [56,58].
G.Forst [49,50]、Poa cita Edgar [51–53]、Corokia cheesemanii Turril [54,55]、Phormium tenax J.R.Forst & G.Forst [49,56,57]、Griselinia littoralis Raoul [51]以及Cordyline australis (G.Forst.) Endl. [56,58]。
The plants were exposed to increasing concentrations of biosolids mixed with bark based on dry weight, resulting in five treatments per biosolids. The fresh biosolids were B1 and B2 (both at 0%, 5%, 10%, 15%, 25% biosolid concentration), and the aged biosolids were B3 and PS (both at 0%, 10%, 20%, 30%, 50%).
按干重计,植物暴露于与树皮混合的生物固体浓度梯度中,每种生物固体设五个处理。新鲜生物固体为B1和B2(生物固体浓度均为0%、5%、10%、15%、25%),陈化生物固体为B3和PS(均为0%、10%、20%、30%、50%)。
The plants were potted into 36-well trays with each plant potted into approx. 150 g of bark or bark + biosolids, with one row for each biosolid concentration and one plant type per tray. Six replicates of each plant species were planted in each biosolid/bark ratio, totalling 720 planted seedlings. A control treatment (bark without biosolids or amendment) was added in each tray to account for differences in the time since planting or placement in the greenhouse.
将植物栽入36孔穴盘,每株植于约150 g树皮或树皮+生物固体中,每个生物固体浓度占一行,每盘一种植物。每种植物在每个生物固体/树皮比例下种植6个重复,共种植720株幼苗。每个穴盘均设一个对照处理(不含生物固体或改良剂的树皮),以校正种植时间或温室摆放位置的差异。
2.2. Plant Monitoring2.2. 植物监测
The trays with plants were evenly spread into two separate greenhouses, one for biosolids B1 and B2 and another for B3 and PS for even irrigation. Average temperatures at the greenhouses during the day and night were 21.4 ◦C and 9.2 ◦C (minimum 9.5 ◦C and maximum 33 ◦C). Plants were watered twice a day to pot capacity, and the trays were randomsied around the greenhouses twice a week. The plants were grown until they required more irrigation than twice daily. Hence, the experiment ran for four months during the summer period from late 2018 to early 2019. Plant height and overall health was monitored every two weeks (Supplementary Material).
为保证灌溉均匀,将栽有植物的穴盘均匀分放于两个独立温室中,一个用于生物固体B1和B2,另一个用于B3和PS。温室日间和夜间平均温度分别为21.4 ◦C和9.2 ◦C(最低9.5 ◦C,最高33 ◦C)。植物每天浇水两次至盆容量,每周两次在温室内随机调换穴盘位置。植物一直培养至每天两次灌溉已不能满足其需水为止。因此,试验于2018年末至2019年初的夏季期间进行了四个月。每两周监测一次株高和整体健康状况(补充材料)。
2.3. Plant Sample Collection2.3. 植物样品采集
At the end of the experiment, all aerial parts of the plants were harvested and dried to determine aerial dry weight and then put into paper bags and dried in an oven at 60 ◦C until constant weight (4 days). The leaves of P. cita, P. tenax and C. australis were cut with stainless steel scissors into 2 cm fractions to facilitate grinding. As for the dicot species, leaves were separated from the stem and ground in a Breville coffee and spice grinder (model: BCG200BSS) and stored in zip-lock bags until analysis.
试验结束时,收获所有植株地上部分并干燥以测定地上部干重,随后装入纸袋,于60 ◦C烘箱中烘干至恒重(4天)。用不锈钢剪刀将P. cita、P. tenax和C. australis的叶片剪成2 cm小段以便研磨。对于双子叶物种,将叶片与茎分离,用Breville咖啡香料研磨机(型号:BCG200BSS)研磨,并储存于自封袋中待分析。
2.4. Biosolid, Pond Sludge, and Bark Analysis2.4. 生物固体、氧化塘污泥及树皮分析
One sample of bark and each biosolid and pond sludge was sent to a commercial laboratory for chemical analysis (Hills Laboratories, Hamilton, New Zealand). The moisture content of the samples was determined by drying a subsample at 103 ◦C until a constant weight was achieved. Air drying of the samples was performed at 35 ◦C and then sieved down to <2 mm. The electrical conductivity and pH were analysed at 1:2 and 1:5 (w:v), respectively, on sample:water ratios on air dried samples. The total organic carbon (TOC) was analysed using an elemental analyser after acid pretreatment to remove present carbonates [59]. The total N was determined by catalytic combustion using an elemental analyser. The ammonium and nitrate were determined on fresh samples by extraction with 2 M KCl and analysed using colourimetric and flow injection analysers [60,61]. The dried samples were acid digested using a microwave digester for further determination of the total elements (Ca, Mg, Mn, P, K, Na, As, Cd, Cr, Cu, Ni, Pb, and Zn) present by ICP-MS [62].
将树皮以及每种生物固体和氧化塘污泥各一个样品送至商业实验室(Hills Laboratories, Hamilton, 新西兰)进行化学分析。样品含水率通过将子样品于103 ◦C烘干至恒重测定。样品于35 ◦C风干后过<2 mm筛。风干样品的电导率和pH分别按样品与水1:2和1:5(w:v)的比例测定。总有机碳(TOC)在酸预处理去除碳酸盐后用元素分析仪测定[59]。全氮采用元素分析仪催化燃烧法测定。铵态氮和硝态氮以新鲜样品经2 M KCl浸提后,用比色分析仪和流动注射分析仪测定[60,61]。干燥样品经微波消解仪酸消解后,采用ICP-MS测定其中的总元素(Ca、Mg、Mn、P、K、Na、As、Cd、Cr、Cu、Ni、Pb和Zn)[62]。
2.5. Plant Analysis2.5. 植物分析
Some 0.2000 (±0.0001) g of ground plant material was weighed into 15 mL borosilicate digestion tubes. Five mL of HNO3 (Analar 67%) was added to the tubes and then digested using an ultraWAVE microwave acid digester (Milestone Srl, Sorisole, Italy) at 220 ◦C and 110 bar. Each run included quality control samples (certified reference material, NIST 15739, tomato leaves) and blanks. Elemental concentrations were determined using ICP-MS (7500cx, Agilent Technologies, Santa Clara, CA, USA). A LECO CN828 carbon/nitrogen analyser (LECO, St. Joseph, MI, USA) was used to determine total C and N in the ground plant samples. Before each run, certified reference material was read to assure the quality of the measurements (Orchard leaves LCRM, LECO corporation, St. Joseph, MI, USA). Recoveries ranged from 72 to 115% of the published values.
称取约0.2000(±0.0001)g研磨后的植物样品于15 mL硼硅酸盐消解管中。向管中加入5 mL HNO3(Analar 67%),然后用ultraWAVE微波酸消解仪(Milestone Srl, Sorisole, Italy)在220 ◦C和110 bar条件下消解。每批次均包括质量控制样品(有证标准物质NIST 15739,番茄叶)和空白。元素浓度采用ICP-MS(7500cx, Agilent Technologies, Santa Clara, CA, USA)测定。采用LECO CN828碳/氮分析仪(LECO, St. Joseph, MI, USA)测定研磨植物样品中的全C和全N。每批次测定前均测定有证标准物质以保证测定质量(Orchard leaves LCRM, LECO corporation, St. Joseph, MI, USA)。回收率为公布值的72%–115%。
2.6. Biomass Index (BI)2.6. 生物量指数(BI)
The plant biomass index (BI) was obtained as the quotient of the dry biomass of the plant grown on each treatment (Bt) divided by the average dry biomass plant grown on control (Bc, bark with no amendment) [63], show in the following equation:
植物生物量指数(BI)为各处理下生长植物的干生物量(Bt)与对照(Bc,未添加改良剂的树皮)下生长植物平均干生物量之商[63],如下式所示:
BI = Bt/Bc.
The biomass index of the control is, by definition, 1. Results for the biomass index have been split into fresh biosolids and aged biosolids, given the similarities in results obtained between biosolids and pond sludge for each category.
根据定义,对照的生物量指数为1。鉴于同一类别中生物固体与氧化塘污泥所得结果相似,生物量指数结果按新鲜生物固体和陈化生物固体分别列出。
2.7. Statistical Analysis2.7. 统计分析
To account for differences in plant age when planting or other covariables, such as location in the greenhouse, results were compared with each control treatment in each tray. The data were analysed with R-studio [64]. A one-way ANOVA was performed to determine significant differences in plant biomass for each species at increasing ratios of biosolids. Residuals were plotted and tested for normality and homoscedasticity assumptions. Data were log transformed when assumptions were not met. Tukey’s post hoc test was used where significant differences were found using the package multcomp [65]. An independent two-sample t-test was used to compare each individual ratio of biosolids against the control group (no biosolids). The significance level of the results was at p < 0.05.
为校正种植时植株苗龄差异或温室位置等其他协变量的影响,将结果与每个穴盘中的对照处理进行比较。数据采用R-studio进行分析[64]。采用单因素ANOVA确定各物种在生物固体比例递增条件下植物生物量的显著差异。绘制残差图并检验正态性和方差齐性假设;当不满足假设时对数据进行对数转换。发现显著差异时,使用multcomp程序包[65]进行Tukey事后检验。采用独立双样本t检验将各生物固体比例分别与对照组(无生物固体)进行比较。结果的显著性水平为p < 0.05。
3Results结果
3.1. Biosolid Effect on Plant Biomass3.1. 生物固体对植物生物量的影响
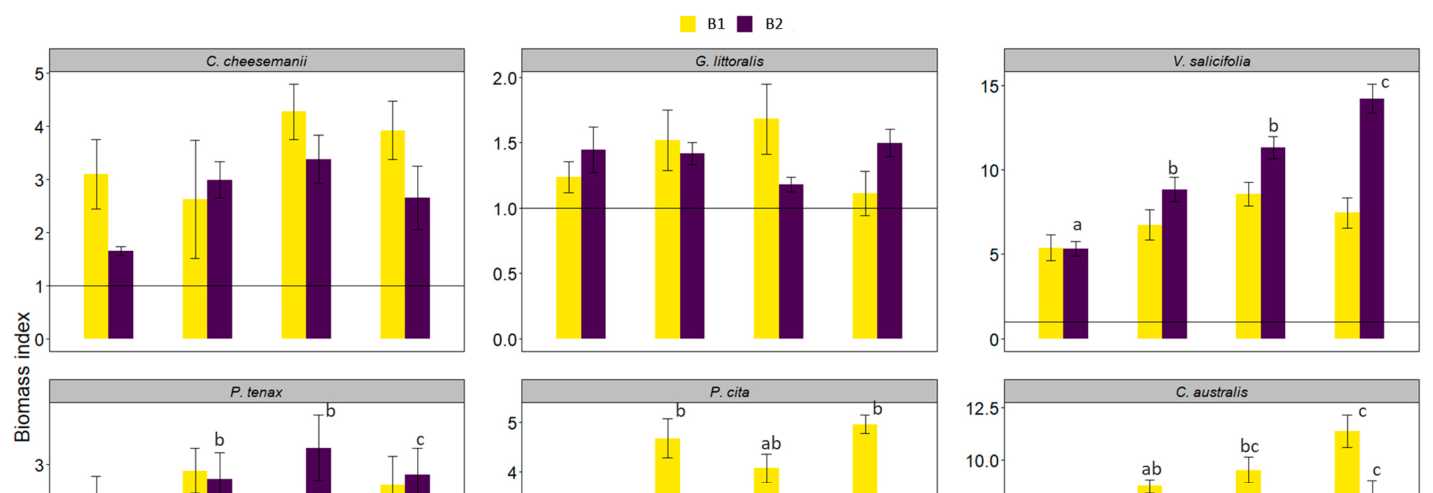
Plants grown on fresh biosolids (B1 and B2), which have high concentrations of macronutrients (Table 1), resulted in consistent plant growth using both biosolids at lower to medium rates. The increasing application rates of fresh biosolids led to a significant increase in plant biomass (p ≤ 0.05) compared to no biosolid application (BI = 1.0) for most species (Figure 1). The biomass of G. littoralis and C. cheesemanii were significantly lower at the 25% application rate for both fresh biosolids (B1 and B2). At the 25% rate, P. cita developed chlorosis in B2, but this did not occur in the other treatments. V. salicifolia had the greatest response for increased biomass among the dicot species and C. australis in the case of monocot plants. Both species showed a consistent increase in biomass production while increasing the biosolid rate. P. cita developed significantly more biomass at increased rates compared to the control samples (BI = 1.0).
在大量营养元素浓度较高的新鲜生物固体(B1和B2)(表1)上生长的植物,在两种生物固体的低至中等施用量下均生长稳定。对于大多数物种,与不施用生物固体(BI = 1.0)相比,新鲜生物固体施用量的增加导致植物生物量显著增加(p ≤ 0.05)(图1)。在两种新鲜生物固体(B1和B2)25%施用量下,G. littoralis和C. cheesemanii的生物量显著降低。在25%施用量下,P. cita在B2中出现黄化,而在其他处理中未出现。在双子叶物种中,V. salicifolia的生物量增加响应最大;在单子叶植物中则为C. australis。两种植物的生物量均随生物固体施用量的提高而持续增加。与对照样品(BI = 1.0)相比,P. cita在较高施用量下生物量显著增加。
The maximum biomass production occurred at rates of 10–25% in B1 and B2 for all plant species (Table 2). An application rate of 10% B1 and B2, equivalent to 75 kg N ha−1 and 242 kg N ha−1, respectively, would provide adequate N for all plant species. In both the B1 and B2 treatments at 10%, C. australis and V. salicifolia showed a 700% increase in biomass compared to the control (BI = 1.0). In contrast, G. littoralis increased its biomass by just 50%.
所有植物物种在B1和B2中的最大生物量出现在10%–25%的施用量下(表2)。B1和B2的10%施用量分别相当于75 kg N ha−1和242 kg N ha−1,可为所有植物物种提供充足的N。在B1和B2的10%处理中,C. australis和V. salicifolia的生物量较对照(BI = 1.0)增加了700%。相比之下,G. littoralis的生物量仅增加了50%。
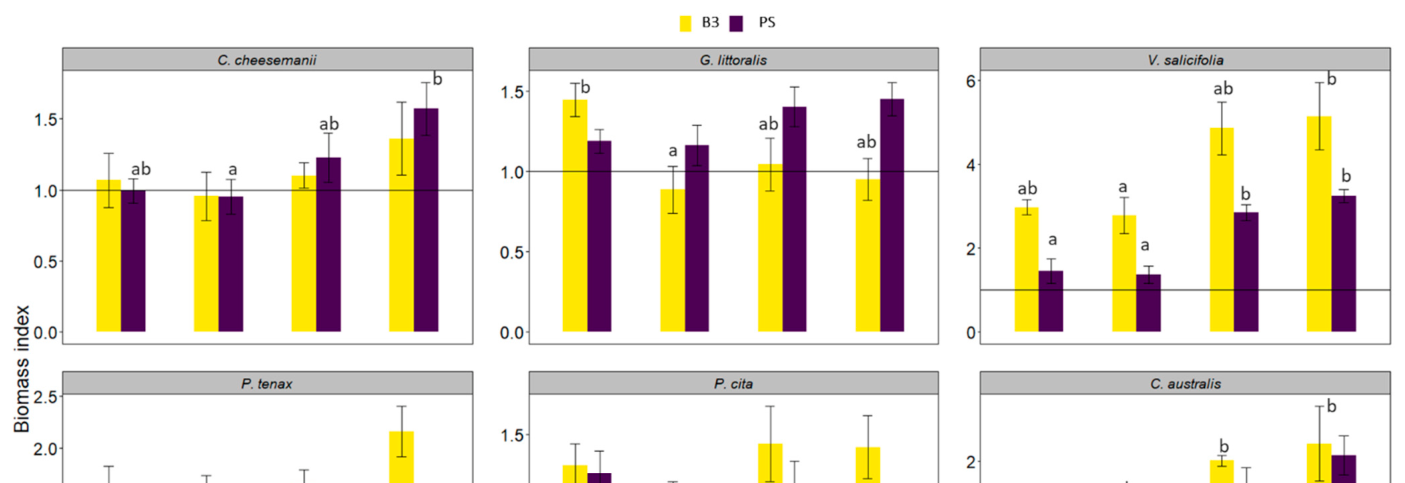
In the aged treatments (B3 and PS, Figure 2), plant response varied, where some plants had no significant growth response; however, at rates between 20% and 30% of B3, the biomass decreased. P. tenax and P. cita did not respond to B3 or PS. For P. tenax, plant biomass was consistently lower than the control in PS. G. littoralis had no response in the PS treatment; however, at rates > 20% B3, it decreased the biomass. C. cheesemanii and C. australis seemed to have similar responses to both biosolids, having a significant increase at higher ratios. V. salicifolia produced significantly more biomass (67%) in B3 compared to PS. However, the leaves of this species developed chlorosis during the trial in PS at the highest rate (50%) [47]. Overall, plants in B3 were not negatively affected at the highest rates, while PS was phytotoxic at high rates (Table 2). An optimal application rate of 30% of aged biosolids (B3) or PS was equivalent to 121 kg N ha−1 and 40 kg N ha−1, respectively.
在陈化处理(B3和PS,图2)中,植物响应各异,部分植物无显著生长响应;而在B3的20%–30%施用量下,生物量下降。P. tenax和P. cita对B3和PS均无响应。对于P. tenax,PS中的植物生物量始终低于对照。G. littoralis在PS处理中无响应,但在B3施用量> 20%时生物量下降。C. cheesemanii和C. australis对两种生物固体的响应似乎相似,在较高比例下显著增加。V. salicifolia在B3中产生的生物量显著高于PS(高67%)。然而,该物种的叶片在试验期间于PS最高施用量(50%)下出现黄化[47]。总体而言,B3中的植物在最高施用量下未受到负面影响,而PS在高施用量下具有植物毒性(表2)。陈化生物固体(B3)或PS的最佳施用量30%分别相当于121 kg N ha−1和40 kg N ha−1。


| Plant sp.植物种 | B1 (%) | B2 (%) | B3 (%) | PS (%) |
|---|---|---|---|---|
| C. cheesemanii | 15 | 15 | 30 | 30 |
| V. salicifolia | 15 | 25 | 30 | 50 * |
| G. littoralis | 15 | 10 | 30 | 30 |
| P. tenax | 10 | 15 | 50 | 50 |
| C. australis | 15 | 25 | 50 | 50 |
| P. cita | 25 | 25 * | 30 | 30 |
Note: * Treatments that produced chlorosis in V. salicifolia and P. cita.
注:* 导致V. salicifolia和P. cita出现黄化的处理。
3.2. Plant Nutrition and Trace Elements at the Optimal Biomass Production of Biosolid Addition3.2. 生物固体添加最佳生物量产量下的植物营养与微量元素
The concentration of macro elements in the leaves of the six indigenous species increased significantly for most plants, except for P. cita which had a negligible response among all the species and across all the biosolids/pond sludge. Foliar concentrations of N, P, and S responded similarly to biosolid addition, increasing significantly by 360%, 170%, and 880%, respectively (Table 3). In the case of K, even though there was a slight increase in concentration for some species, the opposite was observed in most plants grown under B1 (Table 3). Other major elements such as Ca and Mg increased greatly for some species and, mainly, when B1 was applied (Table S2). The total N and P increased significantly while using B2 biosolid at the optimal rate. However, most of the other elements were not significantly different from the unamended samples.
六种本土物种叶片中大量元素的浓度在大多数植物中显著增加,但P. cita除外,其在所有物种中以及在所有生物固体/氧化塘污泥处理下响应均可忽略。叶片N、P和S浓度对生物固体添加的响应相似,分别显著增加360%、170%和880%(表3)。对于K,尽管部分物种浓度略有增加,但在B1下生长的大多数植物中观察到相反的情况(表3)。其他主要元素如Ca和Mg在部分物种中大幅增加,且主要出现在施用B1时(表S2)。在最佳施用量下使用B2生物固体时,全N和全P显著增加,但大多数其他元素与未改良样品相比无显著差异。
| N ControlN 对照 | (%) Optimal(%) 最佳 | Control对照 | P OptimalP 最佳 | Control对照 | K OptimalK 最佳 | Control对照 | S OptimalS 最佳 | |
|---|---|---|---|---|---|---|---|---|
| Biosolids 1 | ||||||||
| C. australis | 0.32 (0.05) | 1.48 (0.05) * | 1727 (169) | 3588 (203) * | 9429 (150) | 6391 (288) * | 439 (9) | 1048 (36) * |
| C. cheesemanii | 0.55 (0.04) | 1.48 (0.04) * | 1272 (282) | 1811 (153) | 12,893 (554) | 10,017 (143) * | 131 (10) | 1293 (167) |
| G. littoralis | 0.49 (0.04) | 1.19 (0.03) * | 1656 (60) | 4107 (260) | 14,677 (1462) | 11,235 (359) | 1022 (102) | 2121 (109) |
| P. cita | 0.31 (0.09) | 0.3 (0.03) | 1802 (246) | 1724 (117) | 7437 (610) | 9072 (250) * | 1242 (168) | 1251 (50) |
| P. tenax V. salicifolia | 0.50 (0.04) 0.37 (0.01) | 1.48 (0.09) * 1.55 (0.22) * | 1658 (29) 1692 (84) | 4129 (423) 3299 (303) | 9829 (574) 14,454 (1098) | 9393 (641) 11,288 (1185) | 733 (53) 1070 (121) | 1951 (105) * 3024 (711) * |
| Biosolids 2 | ||||||||
| C. australis | 0.20 (0.12) | 0.79 (0.03) * | 1301 (133) | 2876 (153) * | 6385 (903) | 11,777 (552) | 288 (12) | 619 (30) |
| C. cheesemanii | 0.55 (0.07) | 1.4 (0.08) * | 1005 (121) | 1843 (83) * | 12,047 (799) | 12,183 (287) | 593 (34) | 2011 (420) |
| G. littoralis P. cita | 0.35 (0.05) 0.23 (0.02) | 0.71 (0.05) * 0.5 (0.05) | 1484 (98) 1026 (43) | 2637 (184) * 2142 (190) | 14,807 (1227) 6439 (347) | 17,780 (404) 10,088 (750) | 912 (72) 934 (43) | 1823 (156) 1533 (25) |
| P. tenax V. salicifolia | 0.20 (0.01) 0.49 (0.06) | 1.01 (0.05) * 0.73 (0.04) | 1267 (79) 1918 (359) | 3431 (256) * 1904 (100) | 7567 (343) 18,172 (1097) | 13,554 (776) * 15,463 (1680) | 563 (35) 1356 (188) | 1648 (183) 2041 (133) |
| Biosolids 3 | ||||||||
| C. australis | 0.21 (0.04) | 0.51 (0.08) * | 1635 (72) | 2794 (74) * | 7889 (990) | 11,943 (584) * | 513 (82) | 483 (26) |
| C. cheesemanii | 0.55 (0.03) | 0.77 (0.06) | 856 (46) | 935 (135) | 9676 (575) | 10,171 (643) | 656 (33) | 912 (147) |
| G. littoralis | 0.67 (0.06) | 0.72 (0.05) | 1492 (175) | 1884 (65) * | 10,867 (1448) | 16,490 (579) | 1292 (119) | 1294 (52) |
| P. cita | 0.37 (0.03) | 0.38 (0.02) | 1334 (109) | 1527 (69) | 8936 (775) | 10,469 (444) | 938 (31) | 1102 (68) * |
| P. tenax V. salicifolia | 0.30 (0.04) 0.38 (0.02) | 0.57 (0.05) 0.54 (0.07) | 1491 (105) 1473 (54) | 3019 (269) 2323 (114) * | 8179 (98) 9328 (313) | 16,012 (946) * 17,480 (1093) * | 688 (6) 915 (105) | 904 (25) * 1703 (158) |
| Pond sludge | ||||||||
| C. australis | 0.15 (0.04) | 0.38 (0.04) * | 2184 (49) | 1733 (115) | 9639 (582) | 9929 (1115) | 403 (53) | 410 (8) |
| C. cheesemanii | 0.58 (0.08) | 0.82 (0.04) | 1319 (178) | 1645 (197) * | 12,602 (1210) | 14,171 (296) | 540 (21) | 952 (16) * |
| G. littoralis | 0.35 (0.01) | 0.39 (0.01) * | 1323 (67) | 1796 (133) * | 11,495 (768) | 15,616 (1860) | 932 (15) | 2056 (93) * |
| P. cita | 0.28 (0.02) | 0.27 (0.01) | 1255 (115) | 1332 (52) | 8279 (738) | 8621 (211) | 815 (62) | 891 (32) |
| P. tenax | 0.20 (0.03) | 0.19 (0.04) | 1777 (84) | 2374 (167) * | 10,345 (331) | 13,801 (790) | 628 (23) | 866 (112) |
| V. salicifolia | 0.38 (0.03) | 0.54 (0.04) | 1801 (176) | 1957 (142) | 11,763 (1303) | 13,655 (1146) | 817 (87) | 1774 (154) * |
The leaf concentration of trace elements, mostly Cd, Cr and Zn, in indigenous NZ plants varied from one species to another (Table 4). In the case of V. salicifolia, Cr significantly decreased by 30% when using B1 and B2. For Cu, slight changes were observed in some cases. Other trace elements are listed in the Supplementary Data (Table S2). The concentration of these was mostly unaffected by biosolid addition at selected rates.
新西兰本土植物叶片中微量元素(主要为Cd、Cr和Zn)的浓度因物种而异(表4)。对于V. salicifolia,使用B1和B2时Cr显著降低了30%。Cu在部分情况下出现轻微变化。其他微量元素列于补充数据(表S2)中,其浓度在所选施用量下基本不受生物固体添加的影响。
| Control对照 | Cr OptimalCr 最佳 | Control对照 | Cu OptimalCu 最佳 | Control对照 | Ni OptimalNi 最佳 | Control对照 | Zn OptimalZn 最佳 | |
|---|---|---|---|---|---|---|---|---|
| Biosolids 1 | ||||||||
| C. australis | 1.1 (0.14) | 1.27 (0.101) | 10.9 (0.72) | 20.7 (1.96) | 0.26 (0.04) | 0.73 (0.046) * | 50.9 (6.43) | 119 (7.32) * |
| C. cheesemanii | 0.26 (0.05) | 0.32 (0.036) | 14.1 (1.63) | 9.9 (1.43) * | 0.24 (0.1) | 0.32 (0.089) | 53.8 (4.86) | 70.3 (7.56) |
| G. littoralis | 0.25 (0.06) | 0.21 (0.035) | 22.6 (2.41) | 29 (1.92) | 0.28 (0.04) | 0.41 (0.045) | 97.1 (7.4) | 156 (14.1) |
| P. cita | 1.45 (0.35) | 1.77 (0.134) | 36.7 (9.93) | 35.2 (3.48) | 0.82 (0.15) | 1.02 (0.079) | 37.0 (5.29) | 24.3 (1.26) * |
| P. tenax | 0.68 (0.07) | 0.81 (0.065) | 11.5 (0.95) | 14.8 (0.53) * | 0.4 (0.05) | 0.31 (0.06) | 80.9 (6.21) | 106 (6.18) * |
| V. salicifolia | 10.1 (1.16) | 3.4 (0.366) * | 18.8 (0.58) | 18.9 (0.54) | 0.3 (0.01) | 0.35 (0.029) | 29.9 (1.78) | 61.2 (6.32) * |
| Biosolids 2 | ||||||||
| C. australis | 1.38 (0.2) | 3.36 (0.958) | 17.9 (4.74) | 21.7 (2.25) | 0.08 (0.04) | 0.42 (0.025) | 60.6 (0.38) | 76.4 (5.9) * |
| C. cheesemanii | 6.91 (4.08) | 3.66 (0.767) | 22.6 (3) | 14.2 (1.23) * | 0.25 (0.12) | 0.36 (0.026) | 62.9 (19.7) | 48.1 (2.34) |
| G. littoralis | 0.49 (0.09) | 1.68 (0.441) * | 22.6 (1.64) | 21.5 (1.5) | 0.2 (0.02) | 0.54 (0.057) * | 124 (18.5) | 99.5 (10.4) |
| P. cita | 3.6 (0.37) | 8.1 (3.12) | 25.9 (3.28) | 25.9 (4.21) | 1.3 (0.13) | 1.58 (0.301) | 28.7 (2.29) | 28.8 (3.79) |
| P. tenax | 3.65 (0.23) | 7.15 (1.748) | 18.5 (1.03) | 19.4 (0.99) | 0.45 (0.04) | 0.73 (0.051) | 86.0 (3.13) | 87 (3.23) |
| V. salicifolia | 5.48 (0.26) | 2.35 (0.242) * | 21.5 (1.76) | 18.1 (0.89) | 0.3 (0.02) | 0.32 (0.018) | 38.5 (2.76) | 34 (4.09) |
| Biosolids 3 | ||||||||
| C. australis | 0.42 (0.02) | 0.468 (0.169) | 13.6 (1.02) | 15.5 (3.24) | 0.06 (0.01) | 0.248 (0.072) | 51.8 (4.71) | 53 (3.01) |
| C. cheesemanii | 1.81 (0.51) | 0.441 (0.092) * | 13.4 (1.6) | 12.7 (0.99) | 0.77 (0.26) | 0.136 (0.02) | 48.9 (3.99) | 46.7 (9.63) |
| G. littoralis | 0.36 (0.02) | 0.188 (0.029) | 22.6 (1.89) | 23.7 (0.92) | 0.34 (0.1) | 0.304 (0.06) | 119 (14.1) | 126 (15.9) |
| P. cita | 2.78 (0.44) | 4.21 (0.78) | 19.4 (3.31) | 13.3 (2.21) | 1.41 (0.21) | 1.95 (0.301) | 28.7 (2.66) | 26.5 (4.06) |
| P. tenax | 0.79 (0.06) | 0.513 (0.039) | 20.6 (2.77) | 17.2 (1.16) | 0.49 (0.04) | 0.291 (0.023) | 69.1 (3.38) | 59.8 (4.05) |
| V. salicifolia | 0.93 (0.12) | 0.478 (0.077) | 21.5 (1.91) | 20.7 (3.52) | 0.27 (0.02) | 0.107 (0.011) * | 41.9 (4.31) | 27.6 (3.23) |
| Pond sludge | ||||||||
| C. australis | 0.42 (0.04) | 0.427 (0.081) | 12.4 (0.97) | 11 (0.79) | 0.22 (0.01) | 0.25 (0.04) | 50.1 (1.21) | 57.8 (5.06) |
| C. cheesemanii | 0.49 (0.05) | 0.551 (0.045) | 16.6 (1.71) | 28.3 (2.94) | 0.34 (0.07) | 0.469 (0.051) | 60.5 (3.82) | 67.1 (2.77) |
| G. littoralis | 0.36 (0.09) | 0.33 (0.057) | 16.9 (1.18) | 14.8 (0.83) | 0.15 (0.01) | 0.324 (0.068) * | 121 (6.78) | 124 (3.71) |
| P. cita | 4.7 (1.57) | 3.88 (0.408) | 23.2 (2.28) | 24.8 (1.92) | 2.23 (0.7) | 1.85 (0.141) | 29 (3.7) | 27.2 (0.67) |
| P. tenax | 1.21 (0.14) | 1.15 (0.211) | 14.3 (0.891) | 22.2 (3.35) * | 0.23 (0.07) | 0.604 (0.082) * | 100 (12.8) | 104 (15.5) |
| V. salicifolia | 0.54 (0.07) | 0.325 (0.039) * | 31.5 (4.46) | 28.7 (3.12) | 0.21 (0.03) | 0.308 (0.03) * | 39.7 (4.58) | 59 (6.21) * |
4Discussion讨论
The increased growth of V. salicifolia, P. tenax, G. litteralis, and C. australis with the addition of all three biosolids and pond sludge is consistent with previous research [39,66–68], following the addition of biosolids at 10% w/w in degraded soils [39,66], irrigated with treated municipal wastewater [67], and under nitrogen loading in the form of urea [68].
添加全部三种生物固体和氧化塘污泥后,V. salicifolia、P. tenax、G. litteralis和C. australis生长增加,这与以往研究结果一致[39,66–68],这些研究包括在退化土壤中以10% w/w添加生物固体[39,66]、以处理后的城市污水灌溉[67]以及以尿素形式施加氮负荷[68]。
For the other species, C. cheesemanii and P. cita, there is no record of studies using organic amendments with these plants, and there is a lack of knowledge about their nutrient requirements. Their non-significant response to the amendments may be due to the plants being naturally adapted to low fertility environments [69,70]. Other indigenous NZ plants that did not respond to biosolids in previous studies [39] include Phormium cookianum Ozothamnus leptophyllus, Coprosma acerosa, and V. salicifolia, which had no significant biomass increase when biosolids were incorporated into two low-fertility soils, an Orthic brown soil and sand [39].
对于其他物种C. cheesemanii和P. cita,尚无针对这些植物施用有机改良剂的研究记录,对其养分需求也缺乏了解。它们对改良剂无显著响应,可能是由于这些植物天然适应低肥力环境[69,70]。在以往研究中[39]对生物固体无响应的其他新西兰本土植物包括Phormium cookianum Ozothamnus leptophyllus、Coprosma acerosa和V. salicifolia,当生物固体掺入两种低肥力土壤(一种正常棕壤和一种砂土)时,这些植物的生物量均无显著增加[39]。
The aerial biomass (total dry weight) differed between rates of biosolid application and type of biosolids. While at higher rates, generally, more biomass was produced in some species, this led to chlorosis or reduced growth. V. salicifolia and P. cita developed chlorosis at rates of 50 and 25% of PS and B2, respectively (Table 2). At the application rate (25% of B1 and B2), there was a significant reduction in the biomass of C. cheesemanii and G. littoralis. This is likely due to the high concentration of trace elements present in both biosolids, in which B1, Zn, and Cu exceed the current biosolids guidelines for land application [48]. For B2 biosolids, in addition to Zn and Cu being above the NZ guidelines values, the high salinity ([Na] = 4200 mg kg−1; 619 mS cm−1) could have contributed to a decrease in plant biomass for both plants, as previously mentioned by other author [41]. Salinity can reduce plant growth by reducing the ability of plants to take up water [71]. Salinity has been shown to be a factor reducing growth in soils amended with biosolids and composts [72].
地上部生物量(总干重)因生物固体施用量和类型而异。虽然一般而言在较高施用量下部分物种产生了更多生物量,但这也导致了黄化或生长减缓。V. salicifolia和P. cita分别在PS 50%和B2 25%施用量下出现黄化(表2)。在该施用量(B1和B2的25%)下,C. cheesemanii和G. littoralis的生物量显著降低。这可能是由于两种生物固体中存在高浓度的微量元素,其中B1的Zn和Cu超过了现行生物固体土地利用指南值[48]。对于B2生物固体,除Zn和Cu高于新西兰指南值外,其高盐度([Na] = 4200 mg kg−1;619 mS cm−1)也可能导致了两种植物生物量的下降,这一点其他作者此前亦有提及[41]。盐分可通过降低植物吸水能力而抑制植物生长[71]。已有研究表明,盐分是施用生物固体和堆肥土壤中导致生长下降的一个因素[72]。
The optimal application rate for all plant species for fresh (B1 and B2) and aged (B3 and PS) biosolids was 10% and 30%, respectively. At this optimal rate, the plants can produce significantly higher biomass compared with no biosolid addition (control, only bark) and without signs of chlorosis and/or hindered growth, at least in their early stages.
对于所有植物物种,新鲜(B1和B2)和陈化(B3和PS)生物固体的最佳施用量分别为10%和30%。在该最佳施用量下,与不添加生物固体(对照,仅树皮)相比,植物可产生显著更高的生物量,且至少在其生长早期未出现黄化和/或生长受阻迹象。
Chlorosis is a general response of plants to stress [73] and can occur from elevated concentrations in biosolids, including Cu or Zn [73,74], as well as from deficiencies of essential macronutrients and micronutrients such as N, Mn, Fe, Cu, or Zn [74,75]. The indigenous species that showed a positive response could potentially be established for ecological restoration on biosolid-treated soil; however, further research needs to be conducted to better assess their potential in field conditions, particularly their interaction with weeds.
黄化是植物对胁迫的一种普遍响应[73],可由生物固体中Cu或Zn等元素的高浓度引起[73,74],也可由N、Mn、Fe、Cu或Zn等必需大量和微量营养元素的缺乏引起[74,75]。表现出正响应的本土物种有望在施用生物固体的土壤上定植以用于生态恢复;然而,仍需进一步研究以更好地评估其在田间条件下的潜力,尤其是其与杂草的相互作用。
Biosolid addition can result in a paradoxical decrease in some nutrient concentrations, even though these elements occur at high concentrations in the biosolids. If the increase in growth of the plant exceeds the increase in the rate of uptake, then the nutrient can be “diluted by growth” [76].
添加生物固体可能导致某些养分浓度出现反常的下降,即便这些元素在生物固体中浓度很高。如果植物生长的增加超过了吸收速率的增加,则养分可能被“生长稀释”[76]。
The nutrient concentrations in most of the species tested (Table 3), fell within the range of previously reported concentrations for plants growing in their natural environment [51]. However, in some cases, nutrient concentrations exceeded other reported concentrations. While this may be the result of luxury uptake [68], it may also indicate excessive uptake resulting in plant stress.
大多数受试物种的养分浓度(表3)处于先前报道的自然环境中生长植物的浓度范围内[51]。然而,在某些情况下,养分浓度超过了其他已报道的浓度。这可能是奢侈吸收的结果[68],但也可能表明过量吸收导致了植物胁迫。
The macronutrients N, P, K, and S were significantly higher on the leaves of plants growing at the selected optimal rates of biosolid application compared with controls, except for K under B1 biosolid, in which case it was lower in most species, except for P. cita and P. tenax, probably due to different nutrient uptake mechanisms of these species or a dilution effect due to increased biomass [76]. Biosolid 1 had elevated concentrations of NH4+, which could have induced a K+ decrease due to ion competition in the root uptake as monovalent cations with similar hydrated atomic radius [75,77]. Nevertheless, we did not observe K deficiency signs (less leaf area), since the concentrations of K were similar to those that support adequate plant growth (10,000–50,000 mg kg−1) [75].
与对照相比,在所选生物固体最佳施用量下生长的植物叶片中大量营养元素N、P、K和S显著较高,但B1生物固体下的K除外,此时大多数物种的K较低,P. cita和P. tenax除外,这可能是由于这些物种的养分吸收机制不同,或生物量增加导致的稀释效应[76]。生物固体1的NH4+浓度较高,由于二者同为水合原子半径相近的一价阳离子,在根系吸收中存在离子竞争,可能导致了K+的降低[75,77]。尽管如此,我们并未观察到缺K症状(叶面积减小),因为K浓度与支持植物正常生长的浓度(10,000–50,000 mg kg−1)相近[75]。
The foliar concentrations of other macronutrients, such as Ca and Mg, were dependent on both the types of biosolids and the plant species. In the case of B1 (Table S2), Ca and Mg concentrations were significantly higher on C. australis, P. tenax, and V. salicifolia compared to the control, meaning these may be limiting elements. Similar findings were reported by other authors [41,42] measuring L. scoparium leaves grown on biosolids incorporated into degraded, low fertility soils.
其他大量营养元素(如Ca和Mg)的叶片浓度同时取决于生物固体类型和植物物种。在B1的情况下(表S2),与对照相比,C. australis、P. tenax和V. salicifolia的Ca和Mg浓度显著较高,表明这些元素可能是限制性元素。其他作者[41,42]测定在掺入生物固体的退化低肥力土壤中生长的L. scoparium叶片时,也报道了类似结果。
For trace elements, foliar Zn was significantly higher (30–135% increase) in the plants growing in biosolid B1 than in the control. The responses of foliar Zn varied between plant species and biosolid type. B2, B3, and PS had lower Zn concentrations than B1. Such differences can be attributed to both the substrate chemistry and the plant physiology [66] and how much exchangeable Zn was available for each substrate (not tested). In all cases, the concentrations at optimal rates were below threshold values for phytotoxicity and animal tolerance levels [75,78] (<100–300 mg kg−1; <300–500 mg kg−1, respectively); this indicates that Zn is unlikely to cause food chain toxicity if plants were used in the field for ecological restoration. Non-essential trace elements (As, Cd, and Pb) in leaves were found below phytotoxic ranges for plant growth (3–10 mg As kg−1, <0.280 mg Cd kg−1, and <5 mg Pb kg−1 [74,78]. The occasional monitoring of Cd concentrations could ensure food chain protection from this toxic element [74]. Although some trace elements were present in high concentrations in most of the biosolids (Cr, Cu, and Zn), previous research has shown that trace elements contained in biosolids are less available for soil and plant systems; hence, they are less likely to enter the food chain [79].
对于微量元素,在生物固体B1中生长的植物叶片Zn显著高于对照(增加30%–135%)。叶片Zn的响应因植物物种和生物固体类型而异。B2、B3和PS的Zn浓度低于B1。此类差异可归因于基质化学性质和植物生理特性[66],以及各基质中可交换态Zn的有效量(未测定)。在所有情况下,最佳施用量下的浓度均低于植物毒性阈值和动物耐受水平[75,78](分别为<100–300 mg kg−1和<300–500 mg kg−1);这表明若将这些植物用于田间生态恢复,Zn不太可能引起食物链毒性。叶片中非必需微量元素(As、Cd和Pb)均低于植物生长的毒性范围(3–10 mg As kg−1、<0.280 mg Cd kg−1和<5 mg Pb kg−1 [74,78]。定期监测Cd浓度可确保食物链免受这一有毒元素的危害[74]。尽管大多数生物固体中部分微量元素(Cr、Cu和Zn)浓度较高,但以往研究表明,生物固体中所含微量元素对土壤和植物系统的有效性较低,因此不太可能进入食物链[79]。
Previous NZ studies on native vegetation interacting with biosolids (stockpiled biosolids and/or mixed with sawdust) showed similar trace element concentrations in plant foliage to those presented in this work, especially Zn and Cu [39,40,42]. Although these concentrations generally increase in the leaves of plants exposed to biosolids, the foliar concentration is mostly below phytotoxic values. The response, however, is highly variable depending on the species physiology, along with the chemistry of the biosolids and substrate/soil used. As an example, Dickinson et al. [66] found no significant effect on trace elements and nutrients after biosolid addition in the foliage of G. littoralis and P. tenax. Overseas studies have reported an improvement in the nutritional status of species on contaminated soils amended with biosolids while reducing the transfer of TE to the aerial portions of the plants [28,80,81].
以往新西兰关于本土植被与生物固体(堆存生物固体和/或与锯末混合的生物固体)相互作用的研究显示,植物叶片中微量元素浓度与本研究结果相似,尤其是Zn和Cu [39,40,42]。尽管暴露于生物固体的植物叶片中这些元素的浓度通常会升高,但叶片浓度大多低于植物毒性值。然而,其响应因物种生理特性以及所用生物固体和基质/土壤的化学性质不同而差异很大。例如,Dickinson et al. [66]发现添加生物固体对G. littoralis和P. tenax.叶片中的微量元素和养分无显著影响。国外研究报道,在施用生物固体改良的污染土壤上,物种的营养状况得到改善,同时TE向植物地上部的转移减少[28,80,81]。
Whereas this study used bark as a substrate, which is commonly used in nurseries, other materials can be used including sand, pumice, or perlite [82,83], and their use with biosolids needs to be addressed. Sand is mostly used to increase the bulk density of the media and can contain a high salt content [82], whereas pumice and perlite are used to improve water retention and decrease the bulk density of the mixtures. Depending on the source, these amendments can have variable pH and cation exchange capacity (CEC), affecting the chemistry of the final mixture [82].
本研究采用苗圃中常用的树皮作为基质,而其他材料如砂、浮石或珍珠岩也可使用[82,83],其与生物固体的配合使用有待研究。砂主要用于提高基质容重,且可能含盐量较高[82];而浮石和珍珠岩则用于提高持水性和降低混合物的容重。根据来源不同,这些改良材料的pH和阳离子交换量(CEC)可能各异,从而影响最终混合物的化学性质[82]。
The diverse plant response towards biosolid mixtures, especially at higher rates, suggests that land application of biosolids could lead to an increase in weed or exotic species growth, and, potentially, indigenous species may perform similarly or worse than exotic species [84]. Additionally, biosolid incorporation might alter soil microbial communities either positively or negatively [85]. This strongly depends on the biosolid composition (pH and trace elements particularly), application types/rates, existing microorganisms, and soil type [86].
植物对生物固体混合基质的响应各异,尤其是在较高施用量下,这表明生物固体的土地利用可能导致杂草或外来物种生长增加,且本土物种的表现可能与外来物种相当甚至更差[84]。此外,掺入生物固体可能对土壤微生物群落产生正面或负面的改变[85]。这在很大程度上取决于生物固体的组成(尤其是pH和微量元素)、施用方式/施用量、现有微生物以及土壤类型[86]。
The beneficial use of biosolids in nurseries can have positive economic outcomes. Using NZ as a case study, where ca. 40,000,000 seedlings yr−1 [87] are grown in 0.5 L pots, the reuse in nurseries would result in the consumption of 3000 tonnes of biosolids (at 10% (w/w) application rate), representing 3% of the annual biosolid production in NZ [6]. Landfilling the equivalent amount of biosolids would cost NZD ~1 million per year [88]. In addition, using biosolids would reduce fertiliser consumption by 100 tonnes (e.g., Osmocote) at a value of NZD ~1 million [87,89]. This option for reusing biosolids would save about NZD 2 million per year from landfilling costs and fertiliser usage.
在苗圃中有益利用生物固体可带来积极的经济效益。以新西兰为例,每年约有40,000,000株幼苗(seedlings yr−1)[87]在0.5 L盆中培育,在苗圃中再利用生物固体将消耗3000吨生物固体(按10%(w/w)施用量计),占新西兰生物固体年产量的3% [6]。填埋同等数量的生物固体每年约需花费NZD ~1 million [88]。此外,使用生物固体可减少100吨肥料(如Osmocote)的消耗,价值约NZD ~1 million [87,89]。这一生物固体再利用方案每年可节省填埋成本和肥料费用约NZD 2 million。
5Conclusions结论
Contrasting biosolids mixed with bark at rates of 0–50% produced distinct effects on indigenous NZ plants in terms of biomass production and plant chemistry. While two species (V. salicifolia and C. australis) benefited from consistent growth and enhanced nutrient status on most biosolids, others (P. cita and G. littoralis) had no response to these amendments. Our results indicated that the selection of an appropriate rate of 10–30% on a range of biosolids can accelerate the growth of indigenous species on nurseries without increasing trace element concentrations to phytotoxic ranges that could facilitate contaminant entry into the food chain. In the case of using the plants in this research into field trials, the appropriate selection of species is encouraged, as well as prior biosolid and substrate characterisation to apply appropriate amendments rates. The low organic matter, plant nutrients, low pH, and the comparatively high concentration of trace elements of the pond sludge made this an unsuitable substrate for growing indigenous seedlings in nurseries, unless it is further blended with other nutrient-rich material.
以0–50%比例与树皮混合的不同生物固体,在生物量生产和植物化学组成方面对新西兰本土植物产生了不同的影响。其中两个物种(V. salicifolia和C. australis)在大多数生物固体上生长稳定、营养状况改善,而其他物种(P. cita和G. littoralis)对这些改良剂无响应。我们的结果表明,在一系列生物固体上选择10%–30%的适宜施用量,可加速本土物种在苗圃中的生长,且不会使微量元素浓度增加至可能促使污染物进入食物链的植物毒性范围。若将本研究中的植物用于田间试验,建议合理选择物种,并预先对生物固体和基质进行表征,以确定适宜的改良剂施用量。氧化塘污泥有机质和植物养分含量低、pH低且微量元素浓度相对较高,因此不适于作为苗圃培育本土幼苗的基质,除非进一步与其他富含养分的材料混合。
While our research demonstrates that biosolids can be effectively used to raise indigenous plants in nursery conditions, future research should delineate the long-term performance of plants raised with biosolids compared to those raised in other growth media.
虽然本研究表明生物固体可有效用于苗圃条件下本土植物的培育,但今后的研究应阐明以生物固体培育的植物与以其他栽培基质培育的植物相比的长期表现。
Supplementary Materials: The following supporting information can be downloaded at: https://www.mdpi.com/article/10.3390/w16091226/s1 Table S1: Ecological requirement by indigenous species used in the greenhouse experiment [49–58]; Table S2: Elemental concentration of macro/micro elements in mg kg−1 (dw) in control plants versus elemental concentration at the optimal ratio for biosolids B1-PS; Figure S1: plant height during the experiment using B1. (A) V. salicifolia, (B) C. cheesemanii, (C) G. littoralis, (D) P. tenax, (E) C. australis, (F) P. cita; Figure S2: plant height during the experiment using B2. (A) V. salicifolia, (B) C. cheesemanii, (C) G. littoralis, (D) P. tenax, (E) C. australis, (F) P. cita; Figure S3: plant height during the experiment using B3. (A) V. salicifolia, (B) C. cheesemanii, (C) G. littoralis, (D) P. tenax, (E) C. australis, (F) P. cita; Figure S4: plant height during the experiment using PS. (A) V. salicifolia, (B) C. cheesemanii, (C) G. littoralis, (D) P. tenax, (E) C. australis, (F) P. cita; Figure S5: Plants growing in different treatments using B1 at the end of the experiment; Figure S6: Plants growing in different treatments from B2 at the end of the experiment; Figure S7: Plants growing in different treatments using B3 at the end of the experiment; Figure S8: Plants growing in different treatments using PS at the end of the experiment.
补充材料:以下支持信息可从https://www.mdpi.com/article/10.3390/w16091226/s1下载。表S1:温室试验所用本土物种的生态需求[49–58];表S2:对照植物与生物固体B1–PS最佳比例下植物中大量/微量元素浓度的比较,单位为mg kg−1(干重);图S1:使用B1时试验期间的株高。(A) V. salicifolia,(B) C. cheesemanii,(C) G. littoralis,(D) P. tenax,(E) C. australis,(F) P. cita;图S2:使用B2时试验期间的株高。(A) V. salicifolia,(B) C. cheesemanii,(C) G. littoralis,(D) P. tenax,(E) C. australis,(F) P. cita;图S3:使用B3时试验期间的株高。(A) V. salicifolia,(B) C. cheesemanii,(C) G. littoralis,(D) P. tenax,(E) C. australis,(F) P. cita;图S4:使用PS时试验期间的株高。(A) V. salicifolia,(B) C. cheesemanii,(C) G. littoralis,(D) P. tenax,(E) C. australis,(F) P. cita;图S5:试验结束时使用B1的不同处理中生长的植物;图S6:试验结束时B2不同处理中生长的植物;图S7:试验结束时使用B3的不同处理中生长的植物;图S8:试验结束时使用PS的不同处理中生长的植物。
Author Contributions: Conceptualisation, M.-J.G.-G. and H.L.; methodology, S.V., J.P. and C.G.-H.; formal analysis, C.G.-H., M.-J.G.-G. and B.R.; investigation, S.V., J.P. and C.G.-H.; data curation, C.G.-H.; writing—original draft preparation, C.G.-H.; writing—review and editing, B.R., M.-J.G.-G., S.V., J.P., H.L. and C.B.-L.; supervision, B.R., M.-J.G.-G. and C.B.-L.; funding acquisition, M.-J.G.-G. and H.L. All authors have read and agreed to the published version of the manuscript.
作者贡献:构思,M.-J.G.-G.和H.L.;方法,S.V.、J.P.和C.G.-H.;形式分析,C.G.-H.、M.-J.G.-G.和B.R.;调查研究,S.V.、J.P.和C.G.-H.;数据整理,C.G.-H.;初稿撰写,C.G.-H.;审阅与修改,B.R.、M.-J.G.-G.、S.V.、J.P.、H.L.和C.B.-L.;指导,B.R.、M.-J.G.-G.和C.B.-L.;经费获取,M.-J.G.-G.和H.L.。全体作者均已阅读并同意本文的出版版本。
Funding: This project was funded by the Ministry for the Environment of New Zealand’s Waste Minimisation Fund “Regional Biosolids Strategy—Lower North Island” (deed number 21685), and by ESR’s Strategic Science Investment Fund from the Ministry of Business, Innovation, and Employment (C03X1701), under the projects “Centre for Integrated Biowaste Research” and “Indigenous Ecosystems”. C.G.-H. received a doctoral scholarship from the University of Canterbury.
基金:本项目由新西兰环境部废物最小化基金“Regional Biosolids Strategy—Lower North Island”(合同编号21685)以及商业、创新与就业部ESR战略科学投资基金(C03X1701)资助,隶属“Centre for Integrated Biowaste Research”和“Indigenous Ecosystems”项目。C.G.-H.获得坎特伯雷大学博士奖学金资助。
Data Availability Statement: Data will be made available on https://www.kiwiscience.com/journalarticles.html.
数据可用性声明:数据将在https://www.kiwiscience.com/journalarticles.html上提供。
Acknowledgments: We are grateful for the significant amount of work that Pauline Penny, from ESR, performed setting up the experiment, caring for the plants, and harvesting them.
致谢:感谢ESR的Pauline Penny在试验设置、植物养护和收获方面所做的大量工作。
Conflicts of Interest: The authors declare no conflicts of interest.
利益冲突:作者声明无利益冲突。
References参考文献
1. Rigby, H.; Clarke, B.O.; Pritchard, D.L.; Meehan, B.; Beshah, F.; Smith, S.R.; Porter, N.A. A Critical Review of Nitrogen Mineralization in Biosolids-Amended Soil, the Associated Fertilizer Value for Crop Production and Potential for Emissions to the Environment. Sci. Total Environ. 2016, 541, 1310–1338. [CrossRef] [PubMed]
2. Popoola, L.T.; Olawale, T.O.; Salami, L. A Review on the Fate and Effects of Contaminants in Biosolids Applied on Land: Hazards and Government Regulatory Policies. Heliyon 2023, 9, e19788. [CrossRef]
3. Jones, E.R.; van Vliet, M.T.H.; Qadir, M.; Bierkens, M.F.P. Country-Level and Gridded Estimates of Wastewater Production, Collection, Treatment and Reuse. Earth Syst. Sci. Data 2021, 13, 237–254. [CrossRef]
4. Di Giacomo, G.; Romano, P. Evolution and Prospects in Managing Sewage Sludge Resulting from Municipal Wastewater Purification. Energies 2022, 15, 5633. [CrossRef]
5. Zhang, Q.; Hu, J.; Lee, D.-J.; Chang, Y.; Lee, Y.-J. Sludge Treatment: Current Research Trends. Bioresour. Technol. 2017, 243, 1159–1172. [CrossRef] [PubMed]
6. ANZBP Australian Biosolids Statistics. Australian and New Zealand Biosolids Partnership; Stantec: Christchurch, New Zealand, 2021.
7. Jones-Lepp, T.L.; Stevens, R. Pharmaceuticals and Personal Care Products in Biosolids/Sewage Sludge: The Interface between Analytical Chemistry and Regulation. Anal. Bioanal. Chem. 2007, 387, 1173–1183. [CrossRef] [PubMed]
8. Kanteraki, A.E.; Isari, E.A.; Svarnas, P.; Kalavrouziotis, I.K. Biosolids: The Trojan Horse or the Beautiful Helen for Soil Fertilization? Sci. Total Environ. 2022, 839, 156270. [CrossRef] [PubMed]
9. Marchuk, S.; Tait, S.; Sinha, P.; Harris, P.; Antille, D.L.; McCabe, B.K. Biosolids-Derived Fertilisers: A Review of Challenges and Opportunities. Sci. Total Environ. 2023, 875, 162555. [CrossRef] [PubMed]
10. Nunes, N.; Ragonezi, C.; Gouveia, C.S.S.; Pinheiro de Carvalho, M.Â.A. Review of Sewage Sludge as a Soil Amendment in Relation to Current International Guidelines: A Heavy Metal Perspective. Sustainability 2021, 13, 2317. [CrossRef]
11. Bernal, M.P.; Navarro, A.F.; Sánchez-Monedero, M.A.; Roig, A.; Cegarra, J. Influence of Sewage Sludge Compost Stability and Maturity on Carbon and Nitrogen Mineralization in Soil. Soil Biol. Biochem. 1998, 30, 305–313. [CrossRef]
12. Ramírez, W.A.; Domene, X.; Ortiz, O.; Alcañiz, J.M. Toxic Effects of Digested, Composted and Thermally-Dried Sewage Sludge on Three Plants. Bioresour. Technol. 2008, 99, 7168–7175. [CrossRef] [PubMed]
13. Mantovi, P.; Baldoni, G.; Toderi, G. Reuse of Liquid, Dewatered, and Composted Sewage Sludge on Agricultural Land: Effects of Long-Term Application on Soil and Crop. Water Res. 2005, 39, 289–296. [CrossRef] [PubMed]
14. Wang, H.; Brown, S.L.; Magesan, G.N.; Slade, A.H.; Quintern, M.; Clinton, P.W.; Payn, T.W. Technological Options for the Management of Biosolids. Environ. Sci. Pollut. Res. 2008, 15, 308–317. [CrossRef]
15. Patel, S.; Kundu, S.; Halder, P.; Ratnnayake, N.; Marzbali, M.H.; Aktar, S.; Selezneva, E.; Paz-Ferreiro, J.; Surapaneni, A.; de Figueiredo, C.C.; et al. A Critical Literature Review on Biosolids to Biochar: An Alternative Biosolids Management Option. Rev. Environ. Sci. Biotechnol. 2020, 19, 807–841. [CrossRef]
16. Sommers, L.E. Chemical Composition of Sewage Sludges and Analysis of Their Potential Use as Fertilizers. J. Environ. Qual. 1977, 6, 225–232. [CrossRef]
17. Riaz, U.; Murtaza, G.; Saifullah; Farooq, M.; Aziz, H.; Qadir, A.A.; Mehdi, S.M.; Qazi, M.A. Chemical Fractionation and Risk Assessment of Trace Elements in Sewage Sludge Generated from Various States of Pakistan. Environ. Sci. Pollut. Res. 2020, 27, 39742–39752. [CrossRef] [PubMed]
18. Liu, Z.; Kanjo, Y.; Mizutani, S. Removal Mechanisms for Endocrine Disrupting Compounds (EDCs) in Wastewater Treatment—Physical Means, Biodegradation, and Chemical Advanced Oxidation: A Review. Sci. Total Environ. 2009, 407, 731–748. [CrossRef] [PubMed]
19. Haynes, R.J.; Murtaza, G.; Naidu, R. Chapter 4 Inorganic and Organic Constituents and Contaminants of Biosolids: Implications for Land Application. In Advances in Agronomy; Academic Press: Cambridge, MA, USA, 2009; Volume 104, pp. 165–267.
20. Wu, C.; Spongberg, A.L.; Witter, J.D.; Fang, M.; Czajkowski, K.P. Uptake of Pharmaceutical and Personal Care Products by Soybean Plants from Soils Applied with Biosolids and Irrigated with Contaminated Water. Environ. Sci. Technol. 2010, 44, 6157–6161. [CrossRef] [PubMed]
21. Roy, M.M.; Dutta, A.; Corscadden, K.; Havard, P.; Dickie, L. Review of Biosolids Management Options and Co-Incineration of a Biosolid-Derived Fuel. Waste Manag. 2011, 31, 2228–2235. [CrossRef] [PubMed]
22. Paramashivam, D.; Dickinson, N.M.; Clough, T.J.; Horswell, J.; Robinson, B.H. Potential Environmental Benefits from Blending Biosolids with Other Organic Amendments before Application to Land. J. Environ. Qual. 2017, 46, 481–489. [CrossRef] [PubMed] 23. Roychand, R.; Patel, S.; Halder, P.; Kundu, S.; Hampton, J.; Bergmann, D.; Surapaneni, A.; Shah, K.; Pramanik, B.K. Recycling Biosolids as Cement Composites in Raw, Pyrolyzed and Ashed Forms: A Waste Utilisation Approach to Support Circular Economy. J. Build. Eng. 2021, 38, 102199. [CrossRef]
24. Joo, S.H.; Monaco, F.D.; Antmann, E.; Chorath, P. Sustainable Approaches for Minimizing Biosolids Production and Maximizing Reuse Options in Sludge Management: A Review. J. Environ. Manag. 2015, 158, 133–145. [CrossRef] [PubMed]
25. Collivignarelli, M.C.; Canato, M.; Abbà, A.; Carnevale Miino, M. Biosolids: What Are the Different Types of Reuse? J. Clean. Prod. 2019, 238, 117844. [CrossRef]
26. Matthews, P.; Richard, R.P.; LeBlanc, R.J. Global Atlas of Excreta, Wastewater Sludge, and Biosolids Management: Moving Forward the Sustainable and Welcome Uses of a Global Resource. Available online: https://unhabitat.org/global-atlas-ofexcreta-wastewater-sludge-and-biosolids-management (accessed on 5 February 2021).
27. Ataria, J.; Baker, V.; Goven, J.; Langer, E.R.; Leckie, A.; Ross, M.; Horswell, J. From Tapu to Noa-Maori Cultural Views on Biowastes¯ Management: A Focus on Biosolids; Institute of Environmental Science and Research: Wellington, New Zealand, 2019.
28. Brown, S.L.; Henry, C.L.; Chaney, R.; Compton, H.; DeVolder, P.S. Using Municipal Biosolids in Combination with Other Residuals to Restore Metal-Contaminated Mining Areas. Plant Soil 2003, 249, 203–215. [CrossRef]
29. Campos, T.; Chaer, G.; Leles, P.d.S.; Silva, M.; Santos, F. Leaching of Heavy Metals in Soils Conditioned with Biosolids from Sewage Sludge. Floresta Ambient. 2019, 26, e20180399. [CrossRef]
30. Ingelmo, F.; Canet, R.; Ibañez, M.A.; Pomares, F.; García, J. Use of MSW Compost, Dried Sewage Sludge and Other Wastes as Partial Substitutes for Peat and Soil. Bioresour. Technol. 1998, 63, 123–129. [CrossRef]
31. Bonnet, B.R.P.; Wisniewski, C.; Reissmann, C.B.; Nogueira, A.C.; Andreoli, C.V.; Barbieri, S.J. Effects of Substrates Composed of Biosolids on the Production of Eucalyptus Viminalis, Schinus Terebinthifolius and Mimosa Scabrella Seedlings and on the Nutritional Status of Schinus Terebinthifolius Seedlings. Water Sci. Technol. 2002, 46, 239–246. [CrossRef] [PubMed]
32. Freeman, T.M.; Cawthon, D.L. Use of Composted Dairy Cattle Solid Biomass, Poultry Litter and Municipal Biosolids as Greenhouse Growth Media. Compost. Sci. Util. 1999, 7, 66. [CrossRef]
33. Abad, M.; Noguera, P.; Burés, S. National Inventory of Organic Wastes for Use as Growing Media for Ornamental Potted Plant Production: Case Study in Spain. Bioresour. Technol. 2001, 77, 197–200. [CrossRef] [PubMed]
34. Hernández-Apaolaza, L.; Gascó, A.M.; Gascó, J.M.; Guerrero, F. Reuse of Waste Materials as Growing Media for Ornamental Plants. Bioresour. Technol. 2005, 96, 125–131. [CrossRef] [PubMed]
35. Bugbee, G.J. Growth of Ornamental Plants in Container Media Amended with Biosolids Compost. Compost. Sci. Util. 2002, 10, 92. [CrossRef]
36. Scheer, M.B.; Carneiro, C.; Bressan, O.A.; Santos, K.G.D. Crescimento e Nutrição de Mudas de Lafoensia pacari com Lodo de Esgoto. Floram 2012, 19, 55–65. [CrossRef] 37. Dede, O.H.; Dede, G.; Ozdemir, S. Agricultural and Municipal Wastes as Container Media Component for Ornamental Nurseries. Int. J. Environ. Res. 2010, 4, 193–200. [CrossRef] 38. Kratka, P.C.; Correia, C.R.M.d.A. Crescimento inicial de aroeira do sertão (Myracrodruon urundeuva Allemão) em diferentes substratos. Rev. Árvore 2015, 39, 551–559. [CrossRef] 39. Gutiérrez-Ginés, M.J.; Robinson, B.H.; Esperschuetz, J.; Madejón, E.; Horswell, J.; McLenaghen, R. Potential Use of Biosolids to Reforest Degraded Areas with New Zealand Native Vegetation. J. Environ. Qual. 2017, 46, 906–914. [CrossRef] [PubMed] 40. Esperschuetz, J.; Anderson, C.; Bulman, S.; Katamian, O.; Horswell, J.; Dickinson, N.M.; Robinson, B.H. Response of Leptospermum scoparium, Kunzea robusta and Pinus radiata to Contrasting Biowastes. Sci. Total Environ. 2017, 587–588, 258–265. [CrossRef] [PubMed] 41. Gutiérrez-Ginés, M.J.; Madejón, E.; Lehto, N.J.; McLenaghen, R.D.; Horswell, J.; Dickinson, N.; Robinson, B.H. Response of a Pioneering Species (Leptospermum scoparium J.R.Forst. & G.Forst.) to Heterogeneity in a Low-Fertility Soil. Front. Plant Sci. 2019, 10, 93. [CrossRef]
42. Reis, F.V.P.; Gutiérrez-Ginés, M.J.; Smith, C.M.S.; Lehto, N.J.; Robinson, B.H. Manuka (¯Leptospermum scoparium) Roots Forage Biosolids in Low Fertility Soil. Environ. Exp. Bot. 2017, 133, 151–158. [CrossRef]
43. Seyedalikhani, S.; Esperschuetz, J.; Dickinson, N.M.; Hofmann, R.; Breitmeyer, J.; Horswell, J.; Robinson, B.H. Biowastes to Augment the Essential Oil Production of Leptospermum scoparium and Kunzea robusta in Low-Fertility Soil. Plant Physiol. Biochem. 2019, 137, 213–221. [CrossRef] [PubMed] 44. Madrid-Aispuro, R.E.; Prieto-Ruíz, J.Á.; Aldrete, A.; Hernández-Díaz, J.C.; Wehenkel, C.; Chávez-Simental, J.A.; Mexal, J.G. Alternative Substrates and Fertilization Doses in the Production of Pinus Cembroides Zucc. in Nursery. Forests 2020, 11, 71. [CrossRef] 45. Beaulieu, J.; Belayneh, B.; Lea-Cox, J.D.; Swett, C.L. Improving Containerized Nursery Crop Sustainability: Effects of Conservation- Driven Adaptations in Soilless Substrate and Water Use on Plant Growth and Soil-Borne Disease Development. HortScience 2022, 57, 674–683. [CrossRef] 46. Cavanagh, J.; McNeill, S.; Arienti, C.; Rattenbury, M. Background Soil Concentrations of Selected Trace Elements and Organic Contaminants in New Zealand; Landcare Research: Lincoln, New Zealand, 2015. 47. Lowe Environmental Impact Limited. Report 6: Biosolids Processing Trials; Trial for Assessing the Reuse of Biosolids as a Growing Substrate for Nursery Plants; Regional Biosolids Strategy: Palmerston North, New Zealand, 2018.
48. Water New Zealand Guidelines for Beneficial Use of Organic Materials on Land (Draft for Public Comments). Available online: https://www.waternz.org.nz/Article?Action=View&Article_id=1212 (accessed on 29 June 2021).
49. KCDC (K¯apiti Coast District Council). A Guide to Growing Native Plants in Kapiti; KCDC: Paraparaumu, New Zealand, 1999. 50. Ward, M.D. Veronica Salicifolia Fact Sheet. Available online: https://www.nzpcn.org.nz/flora/species/veronica-salicifolia/ (accessed on 8 April 2024). 51. Wardle, P. Vegetation of New Zealand; Cambridge University Press: Cambridge, UK, 1991. 52. Hutchinson, M.; Lloyd, K. Priorities for Indigenous Biodiversity Protection in Waimakariri District: Significant Vegetation and Habitat Types and Indigenous Plant Species. 2021.
53. Alan, F.M. “Grasslands”. Available online: https://teara.govt.nz/en/grasslands/print (accessed on 8 April 2024). 54. Manaaki Whenua—Landcare Research New Zealand Plant Names Database—Corokia × cheesemanii Carse. Available online: https://biotanz.landcareresearch.co.nz/scientificnames/af2bf9f9-8b9c-49d8-bc04-ccc607cb4c90 (accessed on 2 April 2024). 55. Manaaki Whenua—Landcare Research New Zealand Plant Names Database—Corokia × virgata Turrill. Available online: https://biotanz.landcareresearch.co.nz/scientific-names/922a0f41-58d7-42b2-8c0a-5259fedd9ad3 (accessed on 2 April 2024). 56. Webb, C.J.; Johnson, P.; Sykes, B. Flowering Plants of New Zealand; DSIR Botany: Palmerston North, New Zealand, 1990. 57. Lange, P.J. Phormium Tenax Fact Sheet. Available online: https://www.nzpcn.org.nz/flora/species/phormium-tenax/ (accessed on 8 April 2024).
58. Lange, P.J. Cordyline Australis Fact Sheet. Available online: https://www.nzpcn.org.nz/flora/species/cordyline-australis/ (accessed on 8 April 2024).
59. U.S. Environmental Protection Agency. SW-846 Test Method 3550C: Ultrasonic Extraction. Available online: https://www.epa. gov/hw-sw846/sw-846-test-method-3550c-ultrasonic-extraction (accessed on 12 March 2024).
60. O’Dell, J.W. Determination of ammonia nitrogen by semi-automated colorimetry. In Methods for the Determination of Metals in Environmental Samples; Elsevier: Amsterdam, The Netherlands, 1996; pp. 434–448. ISBN 978-0-8155-1398-8.
61. O’Dell, J.W. Determination of nitrate-nitrite nitrogen by automated colorimetry. In Methods for the Determination of Metals in Environmental Samples; Elsevier: Amsterdam, The Netherlands, 1996; pp. 464–478. ISBN 978-0-8155-1398-8.
62. US EPA. Sample preparation procedure for spectrochemical determination of total recoverable elements. In Methods for the Determination of Metals in Environmental Samples; Elsevier: Amsterdam, The Netherlands, 1996; pp. 12–23. ISBN 978-0-8155-1398-8. 63. Jensen, H.; Lehto, N.; Almond, P.; Gaw, S.; Robinson, B. The Uptake of Rare Trace Elements by Perennial Ryegrass (Lolium perenne L.). Toxics 2023, 11, 929. [CrossRef] [PubMed]
64. R Core Team. R: A Language and Environment for Statistical Computing; R Foundation for Statistical Computing: Vienna, Austria, 2021.
65. Hothorn, T.; Bretz, F.; Westfall, P. Simultaneous Inference in General Parametric Models. Biom. J. 2008, 50, 346–463. [CrossRef] [PubMed]
66. Dickinson, N.; Marmiroli, M.; Das, B.; McLaughlin, D.; Leung, D.; Robinson, B. Endemic Plants as Browse Crops in Agricultural Landscapes of New Zealand. Agroecol. Sustain. Food Syst. 2015, 39, 224–242. [CrossRef]
67. Meister, A.; Li, F.; Gutierrez-Gines, M.J.; Dickinson, N.; Gaw, S.; Bourke, M.; Robinson, B. Interactions of Treated Municipal Wastewater with Native Plant Species. Ecol. Eng. 2022, 183, 106741. [CrossRef]
68. Franklin, H.M.; Dickinson, N.M.; Esnault, C.J.D.; Robinson, B.H. Native Plants and Nitrogen in Agricultural Landscapes of New Zealand. Plant Soil 2015, 394, 407–420. [CrossRef]
69. Wei, Z.; Maxwell, T.; Robinson, B.; Dickinson, N. Plant Species Complementarity in Low-Fertility Degraded Soil. Plants 2022, 11, 1370. [CrossRef] [PubMed]
70. Wardle, P. Environmental Influences on the Vegetation of New Zealand. N. Z. J. Bot. 1985, 23, 773–788. [CrossRef]
71. Munns, R.; Tester, M. Mechanisms of Salinity Tolerance. Annu. Rev. Plant Biol. 2008, 59, 651–681. [CrossRef]
72. Barker, A.V. Composition and Uses of Compost. In Agricultural Uses of By-Products and Wastes; ACS Symposium Series; American Chemical Society: Washington, DC, USA, 1997; Volume 668, pp. 140–162. ISBN 978-0-8412-3514-4.
73. Emamverdian, A.; Ding, Y.; Mokhberdoran, F.; Xie, Y. Heavy Metal Stress and Some Mechanisms of Plant Defense Response. Sci. World J. 2015, 2015, e756120. [CrossRef]
74. Kabata-Pendias, A. Trace Elements in Soils and Plants, 4th ed.; CRC Press: Boca Raton, FL, USA, 2011; ISBN 978-1-4200-9368-1.
75. Marschner, P. Marschner’s Mineral Nutrition of Higher Plants; Academic Press: Cambridge, MA, USA, 2012.
76. Jarrell, W.M.; Beverly, R.B. The Dilution Effect in Plant Nutrition Studies. In Advances in Agronomy; Brady, N.C., Ed.; Academic Press: Cambridge, MA, USA, 1981; Volume 34, pp. 197–224.
77. ten Hoopen, F.; Cuin, T.A.; Pedas, P.; Hegelund, J.N.; Shabala, S.; Schjoerring, J.K.; Jahn, T.P. Competition between Uptake of Ammonium and Potassium in Barley and Arabidopsis Roots: Molecular Mechanisms and Physiological Consequences. J. Exp. Bot. 2010, 61, 2303–2315. [CrossRef] [PubMed]
78. Chaney, R.L. Toxic Element Accumulation in Soils and Crops: Protecting Soil Fertility and Agricultural Food-Chains. In Proceedings of the Inorganic Contaminants in the Vadose Zone; Bar-Yosef, B., Barrow, N.J., Goldshmid, J., Eds.; Springer: Berlin/Heidelberg, Germany, 1989; pp. 140–158.
79. Brown, S.L.; Chaney, R.L.; Angle, J.S.; Ryan, J.A. The Phytoavailability of Cadmium to Lettuce in Long-Term Biosolids-Amended Soils. J. Environ. Qual. 1998, 27, 1071–1078. [CrossRef]
80. Madejón, E.; de Mora, A.P.; Felipe, E.; Burgos, P.; Cabrera, F. Soil Amendments Reduce Trace Element Solubility in a Contaminated Soil and Allow Regrowth of Natural Vegetation. Environ. Pollut. 2006, 139, 40–52. [CrossRef]
81. Madejón, P.; Domínguez, M.T.; Gil-Martínez, M.; Navarro-Fernández, C.M.; Montiel-Rozas, M.M.; Madejón, E.; Murillo, J.M.; Cabrera, F.; Marañón, T. Evaluation of Amendment Addition and Tree Planting as Measures to Remediate Contaminated Soils: The Guadiamar Case Study (SW Spain). Catena 2018, 166, 34–43. [CrossRef]
82. Pascual, J.A.; Ceglie, F.; Tuzel, Y.; Koller, M.; Koren, A.; Hitchings, R.; Tittarelli, F. Organic Substrate for Transplant Production in Organic Nurseries. A Review. Agron. Sustain. Dev. 2018, 38, 35. [CrossRef]
83. Fiasconaro, M.L.; Abrile, M.G.; Hintermeister, L.; Antolin, M.D.C.; Lovato, M.E. Application of Different Doses of Compost as a Substitution of the Commercial Substrate in Nursery for Pepper and Tomato Seedlings. Int. J. Recycl. Org. Waste Agric. 2022, 11, 411–426. [CrossRef]
84. Cieraad, E.; Burrows, L.; Monks, A.; Walker, S. Woody Native and Exotic Species Respond Differently to New Zealand Dryland Soil Nutrient and Moisture Gradients. N. Z. J. Ecol. 2015, 39, 198–207.
85. Soedarjo, M.; Habte, M. Vesicular-Arbuscular Mycorrhizal Effectiveness in an Acid Soil Amended with Fresh Organic Matter. Plant Soil 1993, 149, 197–203. [CrossRef]
86. Giller, K.E.; Witter, E.; Mcgrath, S.P. Toxicity of Heavy Metals to Microorganisms and Microbial Processes in Agricultural Soils: A Review. Soil Biol. Biochem. 1998, 30, 1389–1414. [CrossRef]
87. Ministry for Primary Industries. Available online: https://www.mpi.govt.nz/dmsdocument/58294-Native-Nursery-Survey-20 22-Main-Report (accessed on 12 March 2024).
88. Lowe, H. A Cost Analysis Summary for End-Use Options in the Lower North Island; Lowe Environmental Impact (LEI): Palmerston North, New Zealand, 2020.
89. CANNA. New Zealand Terra InfoPaper—Using Potting Mixes. Available online: https://www.canna.co.nz/things_to_be_ aware_of_when_using_potting_mixes (accessed on 12 March 2024).
Disclaimer/Publisher’s Note: The statements, opinions and data contained in all publications are solely those of the individual author(s) and contributor(s) and not of MDPI and/or the editor(s). MDPI and/or the editor(s) disclaim responsibility for any injury to people or property resulting from any ideas, methods, instructions or products referred to in the content.