CSIRO PUBLISHING
www.publish.csiro.au/journals/ajsr
Australian Journal of Soil Research, 2003, 41, 335–350
T. ThayalakumaranA,B,D, I. VogelerA, D. R. ScotterA,B, H. J. PercivalC, B. H. RobinsonA, and B. E. ClothierA
AEnvironment and Risk Management Group, HortResearch, Private Bag 11030, Palmerston North, New Zealand.
BInstitute of Natural Resources, Massey University, Private Bag 11222, Palmerston North, New Zealand.
CLandcare Research, Private Bag 11052, Palmerston North, New Zealand.
DCorresponding author; present address, CSIRO Land & Water, Davies Laboratory, Private Mail Bag, PO Aitkenvale, Qld 4814, Australia; email: thabo.kumaran@csiro.au
1Abstract摘要
In Part I, we proposed a model for EDTA-facilitated transport of copper, and we tested the robustness of this scheme by reference to experiments with various initial and boundary conditions on a repacked soil. Now we examine a quite different repacked soil, and consider intact cores of the same soil as in Part I.
在第I部分中,我们提出了一个EDTA促进铜迁移的模型,并通过在一种回填土壤上开展的不同初始条件和边界条件的试验检验了该模型的稳健性。本文考察一种性质截然不同的回填土壤,并研究与第I部分相同土壤的原状土柱。
Continuous leaching of an intact core of a contaminated orchard soil of volcanic origin under unsaturated conditions with excess 0.01 M EDTA (510 mm) reduced the copper concentration from 240 down to 80 µg/g in the top 25 mm. When a 480 µmol pulse of 0.001 M EDTA was applied to similar intact cores, 126 µmol of copper came out with immediate leaching, but only 18% of that was leached out from a core that was left for 1 month before leaching. The month’s delay caused an increase in the amount of iron leached from 116 to 286 µmol. An experiment in which daily pulses CuEDTA2– were applied to a non-contaminated soil for 3 months indicated that these changes were due to CuEDTA2– slowly changing to Fe(III)EDTA–, with the re-adsorption of the Cu2+ released.
在非饱和条件下,用过量0.01 M EDTA(510 mm)对一种火山成因的受污染果园土壤原状土柱进行连续淋溶,使表层25 mm土壤中的铜浓度由240 µg/g降至80 µg/g。对类似的原状土柱施加480 µmol的0.001 M EDTA脉冲后,立即淋溶可淋出126 µmol铜,而放置1个月后再淋溶的土柱淋出的铜仅为前者的18%。延迟1个月使淋出的铁量由116 µmol增至286 µmol。对一种未受污染土壤连续3个月每日施加CuEDTA2–脉冲的试验表明,上述变化源于CuEDTA2–缓慢转化为Fe(III)EDTA–,而释放出的Cu2+被重新吸附。
Application of our model from Part I indicated that different rate constants are required for the chemical reactions for different soils, and also for the same volcanic soil when the pH is lower. But by changing just the dispersivity from 3 mm to 23 mm, the model with the same chemical parameters was able to simulate both the repacked columns and the intact core experiments using the volcanic soil.
应用第I部分的模型表明,不同土壤的化学反应需要采用不同的速率常数,同一火山土壤在pH较低时亦是如此。但仅将弥散度由3 mm改为23 mm,采用相同化学参数的模型即可同时模拟该火山土壤的回填土柱试验和原状土柱试验。
Additional keywords: iron, convection–dispersion equation, heavy metals, repacked soil, intact soil.
其他关键词:铁,对流–弥散方程,重金属,回填土壤,原状土壤。
2Introduction引言
In Thayalakumaran et al. (2003), which we will subsequently refer to as Part I, we described the transport, under near-saturated conditions, of copper in repacked columns of a contaminated soil, as well as its temporal stability in the soil solution following the application of EDTA. We described a simple mechanistic model that simulated the experimental results rather well. The usefulness of these data, and the model that we developed from them, depends on whether the scheme can be extrapolated to predict other conditions. For example, can it describe how a different soil behaves? Can it describe what happens if copper is leached from contaminated topsoil into essentially copper-free subsoil? Can it describe how EDTA behaves when it is applied to unsaturated intact soil columns?
在Thayalakumaran et al.(2003)(下文称第I部分)中,我们描述了近饱和条件下铜在一种受污染土壤回填土柱中的迁移,以及施加EDTA后铜在土壤溶液中的时间稳定性。我们提出了一个简单的机理模型,该模型较好地模拟了试验结果。这些数据及据此建立的模型的实用价值,取决于该模型能否外推用于预测其他条件。例如,它能否描述另一种土壤的行为?能否描述铜从受污染表土淋溶进入基本不含铜的底土时所发生的过程?能否描述EDTA施加于非饱和原状土柱时的行为?
We sought to answer these questions by conducting 7 leaching experiments. These we will denote as A–G. Experiments A and B involve an alluvial repacked soil with a quite different mineralogy, and with much less organic matter, than the soil used in Part I. Expts C–G used the same repacked volcanic soil studied in Part I. Expt C involved adding daily aliquots of CuEDTA2– for nearly 3 months, to test the model’s ability to describe the slow reactions this compound undergoes in the soil. Expts D and E examined what happened when EDTA leached copper out of contaminated surface topsoil into soil below, which was essentially free of copper. This physical situation is a common field scenario. Lastly, Expts F and G involved moving another step closer to field conditions. Larger cores of intact soil were used to determine whether or not the model, parameterised using data from the repacked column experiments, could be applied to unsaturated flow in soil with natural structure. Here, there would be quite different geometric relationships between the adsorbed copper and the predominant flow pathways.
为回答上述问题,我们开展了7项淋溶试验,分别记为A–G。试验A和B采用一种冲积回填土壤,其矿物组成与第I部分所用土壤差异很大,有机质含量也低得多。试验C–G采用与第I部分相同的回填火山土壤。试验C连续近3个月每日加入等份CuEDTA2–,以检验模型描述该化合物在土壤中缓慢反应的能力。试验D和E考察EDTA将铜从受污染的表层土壤淋溶至其下基本不含铜的土壤时所发生的过程,这一物理情形在田间十分常见。最后,试验F和G进一步接近田间条件:采用较大的原状土柱,以确定利用回填土柱试验数据参数化的模型能否应用于具有自然结构土壤中的非饱和流。在这种情况下,被吸附的铜与优势水流路径之间的几何关系将大不相同。
*Part I, Aust. J. Soil Res., 2003, 41, 323–333.
*第I部分,Aust. J. Soil Res.,2003,41,323–333。
3Materials and methods材料与方法
The influent EDTA solutions used in all experiments, except C, were prepared by mixing Na2H2EDTA, and either CaCl2 or CaBr2, to give the same molar concentration of halide tracer as EDTA. The solutions were then brought to pH 6.2 by the addition of KOH. The 0.001 M CuEDTA2– solution used in Expt C was made by the stoichiometric addition of copper as CuCl2, and EDTA as Na2H2EDTA (1:1). The mixture was equilibrated for 24 h, then CaBr2 was added, and finally KOH added to raise the pH to 6.2. A summary of the leaching procedures used in all experiments is given in detail in Table 1.
除试验C外,所有试验所用的进水EDTA溶液均由Na2H2EDTA与CaCl2或CaBr2混合配制,使卤素示踪剂的摩尔浓度与EDTA相同,然后加入KOH将溶液pH调至6.2。试验C所用的0.001 M CuEDTA2–溶液按化学计量比(1:1)加入CuCl2形式的铜和Na2H2EDTA形式的EDTA配制而成。混合液平衡24 h后加入CaBr2,最后加入KOH将pH提高至6.2。所有试验的淋溶程序详见表1。
The 2 soils used were both collected from the A horizon of orchards in which copper sprays were used. The volcanic soil used in Part I, Opotiki sandy loam, a Vitric Orthic Allophanic soil (Hewitt 1993), was used in all experiments, except A and B. For these 2 experiments, an alluvial soil, the Manawatu fine sandy loam, a Weathered Fluvial Recent soil (Hewitt 1993) was used. All the experiments were performed in the laboratory under similar conditions.
所用的2种土壤均采自喷施铜制剂果园的A层。除试验A和B外,所有试验均采用第I部分所用的火山土壤Opotiki砂壤土,属玻质正常火山灰土(Vitric Orthic Allophanic soil)(Hewitt 1993)。试验A和B采用一种冲积土壤Manawatu细砂壤土,属风化河流新成土(Weathered Fluvial Recent soil)(Hewitt 1993)。所有试验均在实验室相似条件下进行。
Repacked column experiments回填土柱试验
The 2 different soils used for Expts A–E were passed through a 2-mm nylon sieve while moist, and then homogenised by frequent mixing, but they were not allowed to dry out. A depth of 100 mm of soil was packed into acrylic tubes with an internal diameter of 45 mm and with nylon mesh at the base. In Expts A and B, the Manawatu soil was packed to a bulk density of about 1.0 Mg/m3, whereas in Expts C–E the Opotiki soil was packed to about 0.65 Mg/m3. A peristaltic pump was used to apply the leaching solutions to all the columns at about 46 mL/h, which corresponded to a Darcy flux density of about 29 mm/h. The leachate dripped from the bottom of the columns at atmospheric pressure and was collected in aliquots.
试验A–E所用的2种土壤在湿润状态下过2 mm尼龙筛,然后经反复混合使之均匀,期间不使其干燥。将100 mm深的土壤填入内径45 mm、底部装有尼龙网的丙烯酸管中。试验A和B中Manawatu土壤的填装容重约为1.0 Mg/m3,而试验C–E中Opotiki土壤的填装容重约为0.65 Mg/m3。采用蠕动泵以约46 mL/h的速率向所有土柱施加淋溶液,相当于约29 mm/h的达西通量密度。淋出液在大气压下从土柱底部滴出,并分段收集。
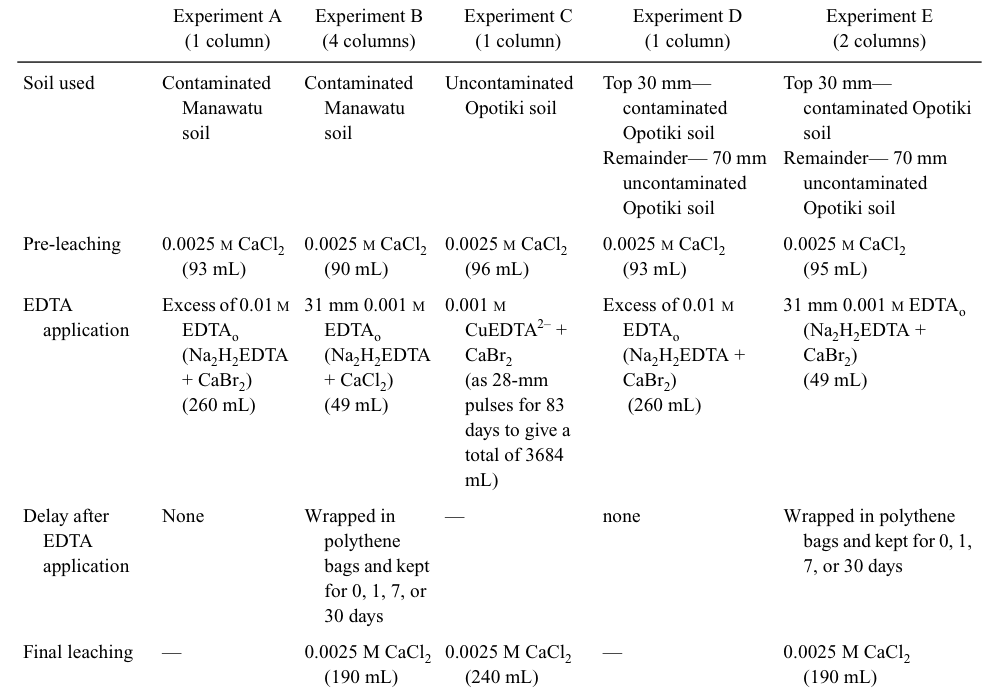
The Manawatu soil for Expts A and B came from 2 different batches, obtained from 2 nearby locations in the same orchard. The samples had different copper and organic matter contents. The acid-extractable copper content in Expt A was 60 mg/kg and the organic matter content was 9%. In Expt B, the copper content was 21 mg/kg and the organic matter content was 5%. Expt A involved pre-leaching with about 1 liquid-filled pore volume (PV) of 0.0025 M CaCl2 solution, and then continuously leaching a soil column with 163 mm (2.8 PV or 260 mL) of 0.01 M EDTAo. In Expt B, after an initial application of about 1 PV of 0.0025 M CaCl2 solution, some 31 mm (0.53 PV or 49 mL) of 0.001 M EDTAo was added to 4 soil columns. The first of these columns was then leached immediately with about 120 mm of 0.0025 M CaCl2 solution. The second was leached with the same solution after a delay of 1 day, the third after a 1-week delay, and the fourth after a 1-month delay. During the delay periods the columns were wrapped in polyethylene to minimise evaporation.
试验A和B所用的Manawatu土壤来自2个不同批次,分别采自同一果园内相邻的2个地点,样品的铜和有机质含量不同。试验A土壤的酸提取态铜含量为60 mg/kg,有机质含量为9%;试验B土壤的铜含量为21 mg/kg,有机质含量为5%。试验A先用约1个充液孔隙体积(PV)的0.0025 M CaCl2溶液预淋溶,然后用163 mm(2.8 PV或260 mL)0.01 M EDTAo连续淋溶土柱。试验B先施加约1 PV的0.0025 M CaCl2溶液,随后向4个土柱各加入约31 mm(0.53 PV或49 mL)0.001 M EDTAo。第一个土柱随即用约120 mm 0.0025 M CaCl2溶液淋溶;第二个土柱在延迟1 d后用相同溶液淋溶,第三个延迟1周,第四个延迟1个月。延迟期间用聚乙烯膜包裹土柱以尽量减少蒸发。
For Expt C, the Opotiki soil was collected from the site where the soil for the experiments in Part I had been obtained; however, it was taken from an adjacent location that had not been subject to copper sprays. The soil at this location had a lower pH than the orchard soil, namely 4.5 compared with 5.6, measured in water. This difference was presumably due to the second soil not having been limed. Its copper content was 13 mg/kg, similar to other reported values for uncontaminated soil (Merry et al. 1983). Its organic matter content was same as that of the contaminated Opotiki soil. The column was pre-leached with 0.0025 M CaCl2 for 1 PV. Then a total of 2316 mm (39 PV) of 0.001 M CuEDTA2– was applied as daily pulses of 28 mm (0.5 PV) over an 83-day period. By this time, the effluent concentration had reached the influent concentration. The column was then again leached with 0.0025 M CaCl2.
试验C所用的Opotiki土壤采自第I部分试验土壤的采样地点,但取自未喷施铜制剂的相邻位置。该处土壤pH(水浸提测定)低于果园土壤,为4.5,而后者为5.6,这一差异可能是由于前者未施用石灰所致。其铜含量为13 mg/kg,与其他报道的未污染土壤数值相近(Merry et al. 1983);有机质含量与受污染的Opotiki土壤相同。土柱先用0.0025 M CaCl2预淋溶1 PV,然后在83 d内以每日28 mm(0.5 PV)脉冲的方式共施加2316 mm(39 PV)0.001 M CuEDTA2–。此时出水浓度已达到进水浓度。随后再用0.0025 M CaCl2淋溶土柱。
In Expts D and E, the bottom 70 mm in each column was Opotiki soil that was uncontaminated, as used in Expt C, and the top 30 mm was contaminated Opotiki soil containing 340 mg/kg of copper. In all other respects, Expts D and E were the same as Expts A and B.
试验D和E中,各土柱下部70 mm为试验C所用的未污染Opotiki土壤,上部30 mm为含铜340 mg/kg的受污染Opotiki土壤。除此之外,试验D和E与试验A和B完全相同。
At the conclusion of Expts A–E, the soil was extruded from each column, cut into sections, and weighed, and then water content and copper concentration were measured as described in Part I.
试验A–E结束时,将土壤从各土柱中推出,分段切割并称重,然后按第I部分所述方法测定含水量和铜浓度。
Intact soil columns原状土柱
Three soil cores were collected in close proximity to each other at the copper-contaminated Opotiki site. After the grass cover had been removed, plastic tubes 100 mm in internal diameter and 150 mm long were pressed into the soil. The cores were then retrieved by excavation and transported to the laboratory. Several smaller 35-mm-diameter soil cores were taken close to the larger diameter cores in order to measure the copper distribution in the soil profile.
在受铜污染的Opotiki样地彼此邻近处采集3个土柱。除去草被后,将内径100 mm、长150 mm的塑料管压入土壤,然后挖掘取出土柱并运回实验室。在大直径土柱附近另取若干直径35 mm的小土芯,用于测定土壤剖面中铜的分布。
An apparatus similar to that described by Magesan et al. (1995) was used for the application, and collection, of the influent and effluent solutions under unsaturated conditions. In brief, a disk permeameter sat atop each soil column to allow solution entry at a given pre-set pressure potential maintained by a bubbling tower and vacuum system. A similar porous disk and suction apparatus underneath allowed solution removal while maintaining the same pressure potential at the base. The imposed pressure potential at the top, and bottom, was –100 mm. This resulted in a flow rate of about 24 mm/h for the core used in Expt F, and 14 and 7 mm/h for the 2 cores used in Expt G. A thin layer of sand (<2 mm) was used to ensure the contact between the disk and the soil.
采用与Magesan et al.(1995)所述类似的装置,在非饱和条件下施加和收集进水与出水溶液。简言之,每个土柱顶部放置一个圆盘渗透仪,通过鼓泡塔和真空系统维持预设的压力势,使溶液在该压力势下入渗。底部设有类似的多孔圆盘和抽吸装置,在维持底部相同压力势的同时排出溶液。顶部和底部施加的压力势均为–100 mm。由此,试验F所用土柱的流速约为24 mm/h,试验G所用2个土柱的流速分别为14 mm/h和7 mm/h。在圆盘与土壤之间铺一薄层砂(<2 mm)以保证二者接触良好。
Each core was first pre-leached with 0.0025 M CaSO4 solution for about 87 mm (1 PV or 680 mL). In Expt F the infiltrating solution was then quickly changed to 0.01 M EDTAo solution, and this was applied continuously for about 5 PV. In Expt G, 61 mm (0.7 PV) of 0.001 M EDTAo was applied to the 2 cores. After the application of EDTAo solution, the treatment of the cores differed. The first core was immediately leached with about 4 PV of 0.0025 M CaSO4 solution, and it was then allowed to drain. The second core was removed from the leaching apparatus, covered to prevent evaporation, and left for a month. Then 4 PV of 0.0025 M CaSO4 solution was applied. Throughout the experiments, effluent aliquots were obtained using an automatic leachate collector and analysed for copper, iron, manganese, and aluminium as described in Part I.
各土柱先用0.0025 M CaSO4溶液预淋溶约87 mm(1 PV或680 mL)。试验F随后迅速将入渗溶液换为0.01 M EDTAo溶液,并连续施加约5 PV。试验G对2个土柱施加61 mm(0.7 PV)0.001 M EDTAo。施加EDTAo溶液后,两土柱的处理有所不同:第一个土柱立即用约4 PV的0.0025 M CaSO4溶液淋溶,然后令其排水;第二个土柱从淋溶装置上取下,加盖防止蒸发,放置1个月后再施加4 PV的0.0025 M CaSO4溶液。整个试验期间用自动淋出液收集器收集出水样品,并按第I部分所述方法分析铜、铁、锰和铝。
At the conclusion of leaching, each core was extruded from its plastic tube, cut into sections, and weighed, and then water content and copper concentration were measured, as described in Part I.
淋溶结束后,将各土柱从塑料管中推出,分段切割并称重,然后按第I部分所述方法测定含水量和铜浓度。
4Results and discussion结果与讨论
EDTA and hydraulic conductivityEDTA与导水率
The air-filled porosity, as calculated from the gravimetric water content and bulk density, assuming a particle density of 2.5 Mg/m3, was 0.07–0.09 m3/m3 in the repacked Manawatu soil, and 0.10–0.15 m3/m3 for the repacked Opotiki soil, indicating better aeration in the latter. This reflects the less-developed structure, and lower saturated hydraulic conductivity, in the alluvial Manawatu soil, compared with the volcanic allophanic Opotiki soil.
根据质量含水量和容重(假定颗粒密度为2.5 Mg/m3)计算,回填Manawatu土壤的充气孔隙度为0.07–0.09 m3/m3,回填Opotiki土壤为0.10–0.15 m3/m3,表明后者通气性较好。这反映出与火山灰质Opotiki土壤相比,冲积Manawatu土壤的结构发育较差,饱和导水率较低。
In the repacked soil columns used in Expts A–E, we observed no ponding, except in the Expt B column with 1 month’s delay between the EDTAo application and leaching it with CaCl2. In this case, the Manawatu fine sandy loam soil ponded during the final leaching phase. However, similar columns kept for 1 month after applying water or CaCl2 solution, but with no EDTA application, also ponded. Therefore, we suggest that the probable cause of the ponding was clogging of macropores by gums produced by localised anaerobic microbial activity in the poorly aerated soil, rather than dissolution, or dispersion, due to the addition of EDTA or sodium (Allison 1947).
在试验A–E所用的回填土柱中,除试验B中施加EDTAo后延迟1个月再用CaCl2淋溶的土柱外,均未观察到积水。该土柱中的Manawatu细砂壤土在最后淋溶阶段出现积水。然而,施加水或CaCl2溶液但未施加EDTA、同样放置1个月的类似土柱也出现了积水。因此,我们认为积水的可能原因是通气不良土壤中局部厌氧微生物活动产生的胶质堵塞了大孔隙,而非EDTA或钠的加入导致的溶解或分散作用(Allison 1947)。
During the intact core Expts F and G using the Opotiki soil, the gravity-induced flow at –100 mm pressure head varied by <15%, except for the core in which leaching was delayed for 1 month after EDTA application. In that core, the flow rate during the final leaching dropped to 3 mm/h from 7 mm/h found during pre-leaching and EDTA application 1 month earlier. Simply removing and replacing the disk permeameter could itself induce such changes. So we conclude that the effect of the EDTA on unsaturated hydraulic conductivity was negligible, or at worst slight.
在采用Opotiki土壤的原状土柱试验F和G中,–100 mm压力水头下的重力流变化幅度<15%,唯有施加EDTA后延迟1个月淋溶的土柱例外。该土柱最后淋溶阶段的流速从1个月前预淋溶和施加EDTA期间的7 mm/h降至3 mm/h。而仅仅拆装圆盘渗透仪本身即可引起此类变化。因此我们认为,EDTA对非饱和导水率的影响可以忽略,至多是轻微的。
EDTA application to repacked Manawatu fine sandy loam: Expts A and B对回填Manawatu细砂壤土施加EDTA:试验A和B
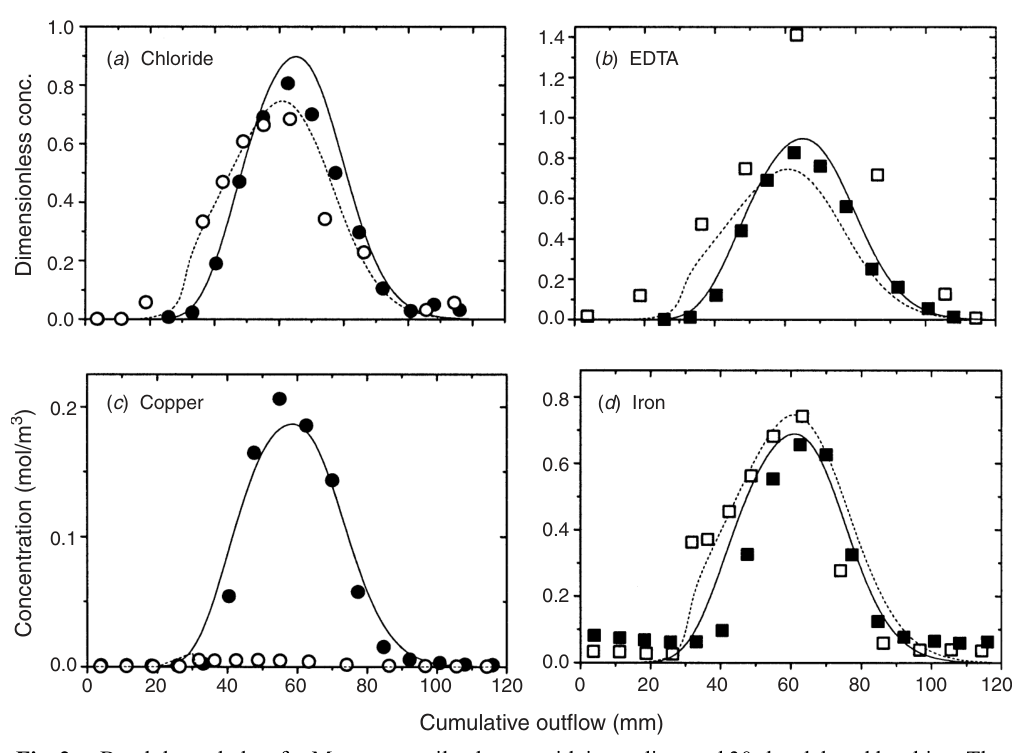
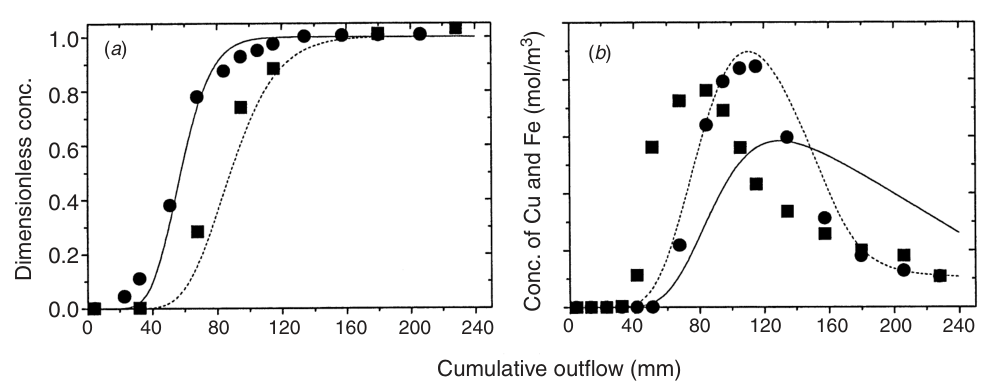
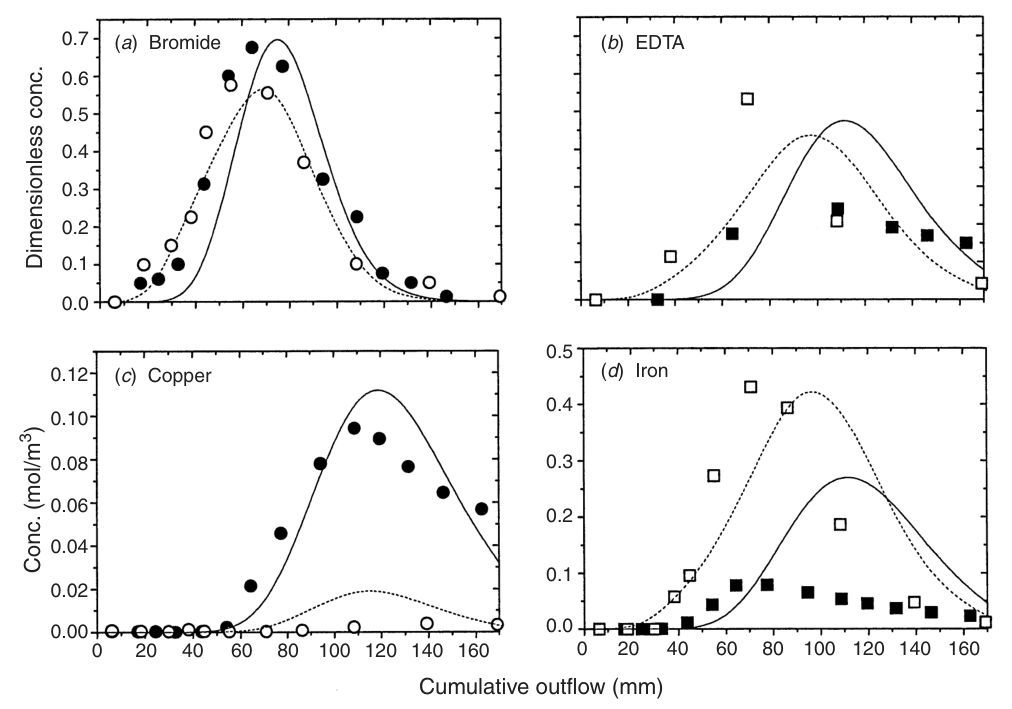
The results for Expts A and B are shown in Figs 1 and 2. The dimensionless concentrations shown were calculated as (C – C1)/(C2 –C1), whereC is the measured effluent concentration, C1 is the concentration in the pre-leaching solution, andC2 is the concentration applied in the treatment. Figs 1a and 2a and b show that the EDTA was not adsorbed, as the breakthrough curves for EDTA show no retardation relative to non-reactive tracer (bromide or chloride). This is consistent with the Opotiki sandy loam data in Part I.
试验A和B的结果见图1和图2。图中无量纲浓度按(C – C1)/(C2 – C1)计算,其中C为实测出水浓度,C1为预淋溶溶液浓度,C2为处理施加的浓度。图1a及图2a和b表明EDTA未被吸附,因为EDTA的穿透曲线相对于非反应性示踪剂(溴离子或氯离子)没有出现阻滞。这与第I部分Opotiki砂壤土的数据一致。
In Expt B, where 50 µmol of EDTA was applied, there was an apparent anomaly in the mass balance. The DOC analyses suggest that 52 µmol of EDTA was lost by immediate leaching, but 64 µmol was removed when leaching was delayed by 1 month. Also for the column with 1 month’s delay, the peak EDTA concentration in the leachate was twice that found with immediate leaching (Fig. 2b). In contrast, the month-long pause had little effect on the EDTA breakthrough curve of the second experiment in Part I, except for a slight lowering of the peak value with a 1-month delay. Presumably this was due to molecular diffusion. In the experiments of Part I, and Expt A in this paper, pre-leaching would have removed any DOC initially present in the soil solution. Also, the relatively high copper concentration in the soil solution would have inhibited microbial reactions during the experiments. Thus, almost all DOC in the effluent was probably EDTA. Loveday (1974) suggested a copper concentration in solution of 2 mol/m3 was sufficient to inhibit the activity of most microorganisms. Our soil solutions mostly contained copper concentrations of around this value. However, as Fig. 2c shows, the copper concentration in the soil solution dropped to 0.005 mol/m3 during the 1-month delay in Expt B. This apparently allowed biological activity to produce a significant amount of additional soluble carbon, and hence showed an increase in the amount of DOC leached. So in this case the assumption of a 1:1 correspondence between DOC and EDTA is not reasonable.
在施加50 µmol EDTA的试验B中,质量平衡出现了明显的异常。DOC分析表明,立即淋溶损失的EDTA为52 µmol,而延迟1个月淋溶时则去除了64 µmol。此外,延迟1个月土柱淋出液中的EDTA峰值浓度为立即淋溶时的2倍(图2b)。相比之下,在第I部分的第二项试验中,放置1个月对EDTA穿透曲线影响很小,仅峰值略有降低,这可能是分子扩散所致。在第I部分的试验和本文试验A中,预淋溶可去除土壤溶液中原有的DOC;而且土壤溶液中较高的铜浓度会在试验期间抑制微生物反应。因此,出水中的DOC几乎全部可能为EDTA。Loveday(1974)认为,溶液中2 mol/m3的铜浓度足以抑制大多数微生物的活性,而本研究土壤溶液中的铜浓度大多在该值附近。然而,如图2c所示,试验B中在延迟1个月期间土壤溶液的铜浓度降至0.005 mol/m3。这显然使生物活动产生了大量额外的可溶性碳,从而使淋出的DOC量增加。因此,在这种情况下假定DOC与EDTA呈1:1对应关系是不合理的。
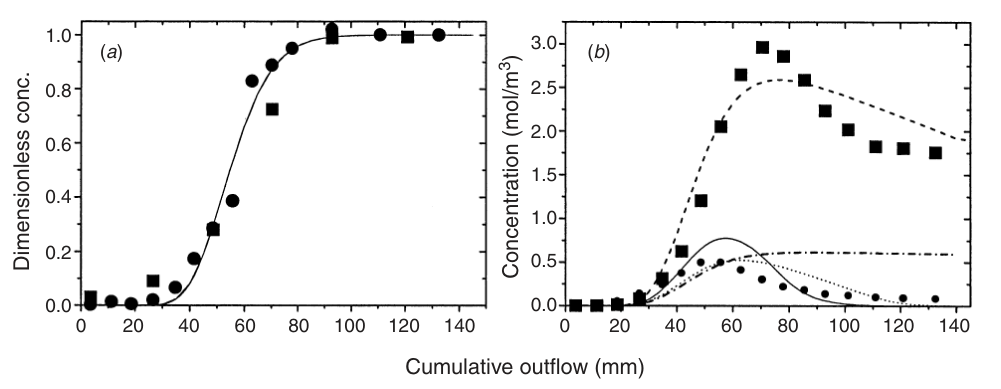
The effluent concentrations for copper and iron in Expt A are shown in Fig. 1b. Because insignificant amounts of copper and iron were found in the leachate during pre-leaching, virtually all the copper and iron present in the leachate must have been brought into solution by complexation with EDTA. This was confirmed by a speciation analysis of the effluent chemistry using GEOCHEM-PC (Parker et al. 1995). EDTA that was not complexed with copper or iron apparently leached with calcium, because insignificant amounts of aluminium and manganese were found in the effluent.
试验A出水中铜和铁的浓度见图1b。由于预淋溶期间淋出液中的铜和铁含量微不足道,淋出液中几乎所有的铜和铁必定是通过与EDTA络合而进入溶液的。利用GEOCHEM-PC(Parker et al. 1995)对出水化学进行的形态分析证实了这一点。由于出水中铝和锰的含量极少,未与铜或铁络合的EDTA显然是与钙一同淋出的。
The 2600 µmol of EDTAo applied in Expt A leached out 45 µmol of copper and 369 µmol of iron. Even though the amount of EDTA applied was well in excess of the amount needed to complex all the copper present in the soil, only 35% of the soil copper was leached during the experiment. About 40 mg/kg of copper was found to have remained, spread quite uniformly throughout the soil. This contrasts with the 90 mg/kg remaining after the analogous experiment using the Opotiki soil in Part I, and demonstrates how organic matter content and clay mineralogy can affect the binding strength for copper of different soils (McGrath et al. 1988; Barona et al. 2001)
试验A中施加的2600 µmol EDTAo淋出了45 µmol铜和369 µmol铁。尽管施加的EDTA量远超络合土壤中全部铜所需的量,试验期间仅有35%的土壤铜被淋出。约40 mg/kg的铜残留于土壤中,且在整个土层中分布相当均匀。这与第I部分采用Opotiki土壤的类似试验后残留的90 mg/kg形成对比,说明有机质含量和黏土矿物组成可影响不同土壤对铜的结合强度(McGrath et al. 1988; Barona et al. 2001)。
Expt B was designed to find out how stable CuEDTA2– is in the Manawatu soil. Four columns were set up in which 50 mL (31 mm) pulses of 0.001 M EDTAo were applied and then left for different time periods before leaching was resumed with 0.0025 M CaCl2. Fig. 2c and d show the effluent copper and iron concentrations for columns leached immediately and 30 days after the application of 50 µmol of EDTAo. Table 2 gives the amounts leached with the different delay times. The amount of copper leached declined markedly as the time the EDTA was left in the soil increased. With a delay of a week or more, little copper was leached. In all cases, >80% of the applied EDTA apparently left the soil complexed with iron. In contrast to Expt A, in Expt B most of the leached copper was removed from the top half of the column, due to the much smaller amount of EDTA added.
试验B旨在查明CuEDTA2–在Manawatu土壤中的稳定性。设置4个土柱,各施加50 mL(31 mm)0.001 M EDTAo脉冲,放置不同时间后再用0.0025 M CaCl2恢复淋溶。图2c和d给出了施加50 µmol EDTAo后立即淋溶和30 d后淋溶的土柱出水中铜和铁的浓度。表2列出了不同延迟时间下的淋出量。随着EDTA在土壤中停留时间的延长,铜的淋出量显著下降;延迟1周或更长时间时,淋出的铜很少。在所有情况下,所施加EDTA的>80%显然是以与铁络合的形式离开土壤的。与试验A不同,由于试验B加入的EDTA量少得多,淋出的铜大部分来自土柱上半部。
In order to use the model developed in Part I to simulate these experiments, new values for some parameters had to be found, as a different soil was used. For the Darcy flux density (q) and volumetric water content (θ), the measured values were used. The water content in the Manawatu soil ranged from 0.49 to 0.58 m3/m3, and in the Opotiki soil it ranged from 0.57 to 0.62 m3/ m3. Values for Do,a, and n were the same as those used in Part I.
为利用第I部分建立的模型模拟这些试验,由于所用土壤不同,需要确定部分参数的新值。达西通量密度(q)和体积含水量(θ)采用实测值。Manawatu土壤的含水量为0.49–0.58 m3/m3,Opotiki土壤为0.57–0.62 m3/ m3。Do、a和n的取值与第I部分相同。
An average dispersivity (λ) of 3 mm was found by fitting the bromide data in Figs 1a and 2a to the appropriate analytical solutions of the convection–dispersion equation. This value is similar to that found for the repacked Opotiki soil in Part I. Optimisation for R in the Manawatu soil experiments gave a value close to unity, indicating that neither adsorption nor exclusion of chloride occurred. The measured and modelled bromide data in Fig. 1a and chloride data in Fig. 2a are in close agreement. This clearly demonstrates how molecular diffusion during the 1-month pause in leaching reduced the amplitude of the pulse, and spread it out.
将图1a和图2a中的溴离子数据拟合至对流–弥散方程的相应解析解,得到平均弥散度(λ)为3 mm,与第I部分回填Opotiki土壤的结果相近。对Manawatu土壤试验的R进行优化,得到接近1的值,表明氯离子既未被吸附也未被排斥。图1a中溴离子和图2a中氯离子的实测与模拟数据吻合良好。这清楚地表明,淋溶暂停1个月期间的分子扩散使脉冲振幅降低并使其展宽。
The simulations for EDTA transport were successful (Figs 1a, 2b), except for the column with a 1-month delay. The probable reason for this exception is the uncertainty, in this case, of using the DOC data to infer EDTA concentration, as discussed above. Again, as the model with R = 1 describes the data; little or no adsorption of EDTA occurred.
除延迟1个月的土柱外,EDTA迁移的模拟均获成功(图1a、2b)。该例外的可能原因在于,如上所述,在此情况下用DOC数据推断EDTA浓度存在不确定性。同样,由于R = 1的模型能够描述这些数据,EDTA几乎未发生吸附。
| Residence time停留时间 | Cu leachCu淋出量 | ed | Fe leacheFe淋出量 | d |
|---|---|---|---|---|
| (days) | Experiment | Model | Experiment | Model |
| 00 | 10 | 11 | 42 | 41 |
| 01 | 4.4 | 06 | 59 | 57 |
| 07 | 0.8 | 00.5 | 55 | 50 |
| 30 | 0.3 | 00.1 | 44 | 50 |
As in Part I, we assumed in Expt A that all the copper that could be removed by leaching with EDTA had been removed. So the 40 mg/kg (0.63 mmol/kg) remaining in the soil was effectively too strongly bound to be extracted. Thus, the initial value of MCu in Expt A was taken as the acid-extractable value, less 0.63 mmol/kg. However, as the soil used for Expt B was collected from a different spot, the same value for MCu could not be used here. Therefore, the copper concentration measured in the top layer of column leached immediately after the EDTAo application in Expt B was taken as the EDTA non-extractable copper. This was found to be 0.20 mmol/kg. A value for the EDTA-leachable iron of 4.2 mmol/kg was obtained from an experiment similar to Expt A. Here, enough EDTA was added to leach from the soil all iron that was EDTA extractable under the prevailing conditions. Note that this EDTA-leachable iron was 3.3 times greater than the value found for the Opotiki soil.
与第I部分相同,我们假定在试验A中所有可被EDTA淋溶去除的铜均已被去除。因此,土壤中残留的40 mg/kg(0.63 mmol/kg)铜实际上结合过于牢固而无法被提取。据此,试验A中MCu的初始值取为酸提取态铜含量减去0.63 mmol/kg。然而,由于试验B所用土壤采自不同地点,此处不能采用相同的MCu值。因此,将试验B中施加EDTAo后立即淋溶的土柱表层实测铜浓度作为EDTA不可提取态铜,其值为0.20 mmol/kg。EDTA可淋溶态铁的值为4.2 mmol/kg,由与试验A类似的试验获得;该试验中加入了足量EDTA,以淋出土壤中在当时条件下所有EDTA可提取的铁。注意该EDTA可淋溶态铁为Opotiki土壤相应值的3.3倍。
Simulation of the copper and iron leachate concentrations in Expt A, using the values for the rate-constants K1,K2, andK3 used for the Opotiki soil in Part I, grossly underestimated the iron concentration in the leachate (Fig. 1b, dot–dash line), and also predicted slower leaching of copper (Fig. 1b, dotted line) than was observed. We attribute this to the copper and iron being adsorbed with different strengths in the Opotiki and Manawatu soils. Therefore, we looked for a factor that we could apply to these rate constants to obtain new values which would better describe the data of Expt A (Fig. 1b, Fe, dashed line; Cu, solid line). We found that assuming all 3 rate constants were 2.5 times greater in the Manawatu soil than in the Opotiki soil greatly improved the simulations. Thus, the values used for K1,K2, andK3 were 1 × 10⁻⁴ s–1, 2.3 × 10⁻⁵ s–1, and 5.5 × 10⁻⁷ s–1, respectively. The faster rate constants in the Manawatu soil are probably due to its lower organic matter content.
采用第I部分中Opotiki土壤的速率常数K1、K2和K3模拟试验A淋出液中的铜和铁浓度,结果严重低估了淋出液中的铁浓度(图1b,点划线),并预测铜的淋出速度慢于实测值(图1b,点线)。我们将其归因于铜和铁在Opotiki土壤与Manawatu土壤中的吸附强度不同。因此,我们寻找一个可应用于这些速率常数的系数,以获得能更好描述试验A数据的新值(图1b,Fe为虚线,Cu为实线)。结果发现,假定Manawatu土壤中3个速率常数均为Opotiki土壤的2.5倍,可显著改善模拟效果。因此,K1、K2和K3的取值分别为1 × 10⁻⁴ s–1、2.3 × 10⁻⁵ s–1和5.5 × 10⁻⁷ s–1。Manawatu土壤中速率常数较大,可能是由于其有机质含量较低。
Using the parameters described above, the model simulated the copper, iron, and EDTA concentrations in the leachate reasonably well for Expt A (Fig. 1a, b). It also successfully simulated the results for copper and iron in Expt B (Fig. 2c, d; Table 2), despite the much lower concentration, and smaller amount, of EDTA applied, and the varying periods it was left in the soil. Thus, the simple model developed appears quite robust, for it is capable of predicting the results of experiments done in a quite different soil, given that the values for the key parameters are adjusted appropriately.
采用上述参数,模型较好地模拟了试验A淋出液中铜、铁和EDTA的浓度(图1a、b)。尽管试验B施加的EDTA浓度低得多、用量少得多,且在土壤中的停留时间各不相同,模型仍成功模拟了该试验中铜和铁的结果(图2c、d;表2)。由此可见,所建立的简单模型相当稳健,只要对关键参数值作适当调整,便能预测在性质截然不同的土壤中开展的试验结果。
Leaching the repacked Opotiki soil with CuEDTA2–: Expt C用CuEDTA2–淋溶回填Opotiki土壤:试验C
To investigate specifically the time-dependent reaction of CuEDTA2– with iron, CuEDTA2– solution was applied to a column of Opotiki sandy loam soil obtained from an area that had not been contaminated with copper sprays. Each day for 83 days, some 28 mm of CuEDTA2– solution (44.5 µmol) was added. Figure 3a shows the average daily bromide, copper, and iron concentrations in the leachate. Of the 3685 µmol of copper applied in total, 2860 µmol was leached, and 720 µmol remained in the soil. The soil ended up with an average copper concentration of 444 µg/g. This left just 105 µmol of copper unaccounted for. The 726 µmol of iron in the leachate equalled the amount of copper staying in the soil, indicating that the transformation of CuEDTA2– to Fe(III)EDTA– was the only significant reaction involving EDTA, and that none of the Fe(III)EDTA– was adsorbed. As the iron concentration in the leachate during pre-leaching was only 0.0002 mol/m3, it is reasonable to assume that virtually all the iron eluted was complexed with EDTA.
为专门研究CuEDTA2–与铁的时间依赖性反应,将CuEDTA2–溶液施加于采自未受铜制剂污染区域的Opotiki砂壤土土柱。连续83 d每天加入约28 mm CuEDTA2–溶液(44.5 µmol)。图3a给出了淋出液中溴离子、铜和铁的日平均浓度。在总共施加的3685 µmol铜中,2860 µmol被淋出,720 µmol残留于土壤中,土壤最终平均铜浓度为444 µg/g,仅有105 µmol铜去向不明。淋出液中的726 µmol铁与留在土壤中的铜量相当,表明CuEDTA2–向Fe(III)EDTA–的转化是涉及EDTA的唯一显著反应,且Fe(III)EDTA–均未被吸附。由于预淋溶期间淋出液中的铁浓度仅为0.0002 mol/m3,可以合理地假定洗脱出的铁几乎全部与EDTA络合。
The application of the CuEDTA2– for only about 1 h per day, with a 23-h break between applications, and the collection of each day’s leachate in 3 aliquots, allowed the rate dependence of the chemical reactions to be observed. Fig. 3b shows the copper and iron leachate concentrations in each aliquot during the first 12 days (300 h) of the experiment. As expected, there was an increase in the copper concentration in the 3 aliquots collected on each day. However, the concentration in the first aliquot on the following day was lower than in the last aliquot on the previous day. The iron concentration shows complementary behaviour, decreasing during each flow event, and then increasing immediately after non-flow periods. We attribute this behaviour to the gradual replacement of CuEDTA2– with Fe(III)EDTA– during the 23-h non-flow periods. The behaviour became less pronounced with increasing time, as the system approached equilibrium with the invading CuEDTA2– solution.
每天仅施加CuEDTA2–约1 h,两次施加之间间隔23 h,并将每天的淋出液分3份收集,从而可以观察化学反应的速率依赖性。图3b给出了试验前12 d(300 h)各份淋出液中铜和铁的浓度。正如预期,每天收集的3份样品中铜浓度依次升高;然而,次日第一份样品的浓度低于前一日最后一份样品。铁浓度表现出互补的变化:在每次水流过程中下降,而在无流期之后立即升高。我们将这一行为归因于在23 h无流期内CuEDTA2–逐渐被Fe(III)EDTA–取代。随着时间推移,系统逐渐与入侵的CuEDTA2–溶液达到平衡,这一现象也随之减弱。
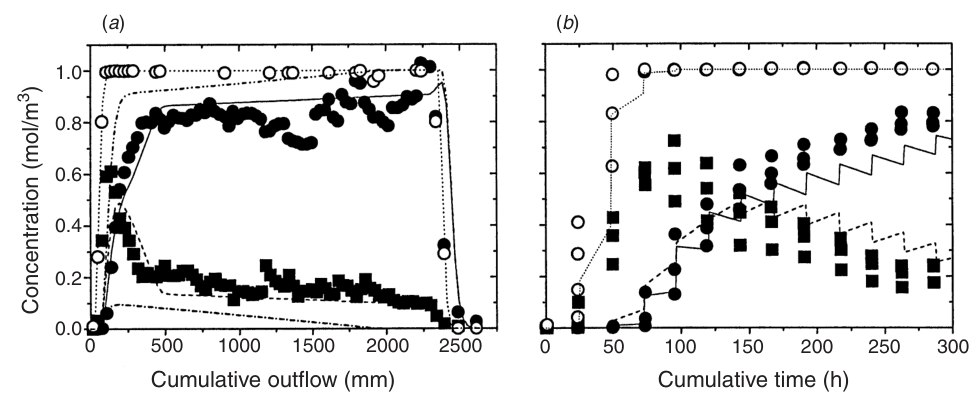
Figure 3a and b show that during the first 80 h of the experiment, the molar concentration of copper plus iron was less than the concentration of bromide, indicating that some adsorption of CuEDTA2– occurred. But, in contrast, during the final step of leaching with 0.0025 M CaCl2, Fig. 3a shows the decline in copper tracked that of the non-reactive bromide tracer. Also the copper leached during this final phase was 110 µmol, which is only slightly higher than 99 µmol, which would have been in the soil solution prior to the application of the CaCl2. These results indicate that negligible desorption of CuEDTA2– occurred during this final leaching. This contrasting behaviour at the beginning and end of the experiment was probably due to the gradual increase in pH brought about by the transformation of CuEDTA2– to Fe(III)EDTA–. We noted that the first effluent aliquot had a pH of 4.5, and the last, some 83 days later, had a pH of 6.2. As Brooks et al. (1996) showed, the higher the pH, the less likely it is that EDTA is adsorbed. So we suggest the CuEDTA2– that was adsorbed had gradually come back into solution as the pH rose.
图3a和b表明,在试验最初80 h内,铜与铁的摩尔浓度之和低于溴离子浓度,表明发生了一定程度的CuEDTA2–吸附。但与此相反,在最后用0.0025 M CaCl2淋溶的阶段,图3a显示铜浓度的下降与非反应性溴示踪剂同步。此外,该最后阶段淋出的铜为110 µmol,仅略高于施加CaCl2之前土壤溶液中应有的99 µmol。这些结果表明,最后淋溶阶段CuEDTA2–的解吸可以忽略。试验开始与结束时的这种相反行为,可能是由于CuEDTA2–转化为Fe(III)EDTA–导致pH逐渐升高。我们注意到,第一份出水样品的pH为4.5,而约83 d后的最后一份为6.2。正如Brooks et al.(1996)所示,pH越高,EDTA越不易被吸附。因此我们认为,随着pH升高,被吸附的CuEDTA2–逐渐重新进入溶液。
In Expt C, the only significant reaction taking place was the transformation of CuEDTA2– to Fe(III)EDTA–. This allows us to study this aspect of the model in some detail. The model, with the values for MFe, andK3 used for experiments in Part I and using the same Opotiki sandy loam but from a contaminated area, grossly underestimated the amount of iron leached (Fig. 3a dot-dash line), and so the reaction rate of the CuEDTA2– formed. We believe this was due to the soil’s pH, which was 4.5. This is significantly lower than the 5.6 of the contaminated soil. The lower pH would have made iron in the soil more easily extracted by EDTA (Brooks et al. 1996), and so it would necessitate the use of a higher value for K3 at the lower pH. It also seems likely that more iron would have been extractable by EDTA, implying a higher value for MFe. However, the shape of the iron breakthrough curve with an initial sharp peak of 0.6 mol/m3, followed by a long plateau of around 0.2 mol/m3 (Fig. 3a), suggests another approach. We propose 2 EDTA-extractable iron fractions: a smaller and rapidly reacting fraction (MFe) and a larger, more slowly reacting one (MFe*). The introduction of this second iron fraction implies that 2 additional terms are required in the model. One describes the reaction between EDTAo and MFe*, and the other describes the reaction between CuEDTA2– and MFe*. Thus, Eqns 3 and 4 in Part I now become:
在试验C中,唯一显著的反应是CuEDTA2–向Fe(III)EDTA–的转化,这使我们能够较详细地研究模型的这一方面。采用第I部分试验(同为Opotiki砂壤土,但取自受污染区域)所用的MFe和K3值,模型严重低估了铁的淋出量(图3a点划线),因而也低估了所形成的CuEDTA2–的反应速率。我们认为这是由于该土壤的pH为4.5,显著低于受污染土壤的5.6。较低的pH会使土壤中的铁更易被EDTA提取(Brooks et al. 1996),因此在较低pH下需采用较高的K3值。同时,可被EDTA提取的铁似乎也可能更多,意味着MFe值应更高。然而,铁穿透曲线的形状——初期出现0.6 mol/m3的尖峰,随后为约0.2 mol/m3的长平台(图3a)——提示了另一种处理方法。我们提出2个EDTA可提取态铁组分:一个较小且快速反应的组分(MFe)和一个较大、反应较慢的组分(MFe*)。引入第二个铁组分意味着模型中需增加2项:一项描述EDTAo与MFe*之间的反应,另一项描述CuEDTA2–与MFe*之间的反应。于是,第I部分中的式3和式4变为:


Here K4 is the rate constant for the reaction between EDTAo and the slowly extractable soil iron, and K5 is the rate constant for the reaction between CuEDTA2– and the slowly extractable soil iron. Both have units of s–1. The other symbols are defined in Part I.
式中K4为EDTAo与土壤缓慢可提取态铁之间反应的速率常数,K5为CuEDTA2–与土壤缓慢可提取态铁之间反应的速率常数,二者单位均为s–1。其他符号的定义见第I部分。
To use this modified model to simulate the data in Fig. 3, we need values for MFe* and K5. We also need a new value for K3, which we expect to be higher in the more acid soil. The protracted, slow decline in the iron concentration in the leachate suggests a relatively high value for MFe*, and a relatively low value forK5. Fitting by eye provided values of 6.3 mmol/kg for MFe*, 1.3 × 10⁻⁶ s–1 forK3, and 1.3 × 10⁻⁷ s–1 for K5. We also expect some adsorption of EDTA in the soil at pH 4.5 soils, in which we assumed an R-value of 2, for reasons discussed below in the relation to Expt D. As in this experiment the only significant reaction taking place was the transformation of CuEDTA2– to Fe(III)EDTA–, values for rate constants K2 andK4 were not required.
要用该修正模型模拟图3中的数据,需要确定MFe*和K5的值,还需要一个新的K3值,预计其在酸性较强的土壤中较高。淋出液中铁浓度长期缓慢下降,提示MFe*值相对较高,而K5值相对较低。目视拟合得到MFe*为6.3 mmol/kg,K3为1.3 × 10–6 s–1,K5为1.3 × 10⁻⁷ s–1。我们还预计pH 4.5的土壤中会发生一定的EDTA吸附,出于下文结合试验D讨论的原因,假定R值为2。由于本试验中唯一显著的反应是CuEDTA2–向Fe(III)EDTA–的转化,因此无需速率常数K2和K4的值。
The saw-tooth shape of the simulated curves in Fig. 3b fit the observed behaviour nicely. However, during the first 100 h, the iron concentrations were much higher than simulated. This suggests that there was some iron in the soil that was more readily available, and/or reacted more quickly, than assumed in our simple model, which divided the soil iron into just 2 fractions.
图3b中模拟曲线的锯齿形状与观测行为吻合良好。然而,在最初100 h内,铁浓度远高于模拟值。这表明土壤中存在部分比我们简单模型(仅将土壤铁分为2个组分)所假定的更易获得和/或反应更快的铁。
EDTA application to non-uniformly contaminated repacked Opotiki sandy loam: Expts D and E
对非均匀污染的回填Opotiki砂壤土施加EDTA:试验D和E
Experiments D and E involved identical treatments to Expts A and B, but for a different soil. The top 30 mm depth in the columns consisted of the copper-contaminated Opotiki soil used in Part I, and the underlying 70 mm of soil was the uncontaminated Opotiki soil used in Expt C.
试验D和E的处理与试验A和B相同,但所用土壤不同。土柱上部30 mm为第I部分所用的受铜污染Opotiki土壤,其下70 mm为试验C所用的未污染Opotiki土壤。
For Expt D, the EDTA breakthrough curve in Fig. 4a shows obvious retardation compared with the non-reactive halide tracer, indicating some adsorption of EDTA by the soil. This is in contrast to findings in Part I where, in an analogous experiment, EDTA was not adsorbed. We believe that this difference is due to the low pH of 4.5 in the uncontaminated soil relative to that of the contaminated soil, which was 5.6. The pH of the effluent reflected this observed difference in soil pH. In Experiment D, it was between 4.5 and 4.6, whereas the effluent pH for the comparable experiment in Part I fell between 5.3 and 5.6. Brooks et al. (1996) also reported greater retardation of the cobalt complexes Co(II)EDTA2– and Co(III)EDTA– through ferrihydrite when the pH was decreased.
对于试验D,图4a中EDTA的穿透曲线相对于非反应性卤素示踪剂表现出明显阻滞,表明土壤对EDTA有一定吸附。这与第I部分的结果不同,在第I部分的类似试验中EDTA未被吸附。我们认为这一差异是由于未污染土壤的pH(4.5)低于受污染土壤(5.6)。出水pH也反映了土壤pH的这一差异:试验D中出水pH为4.5–4.6,而第I部分可比试验的出水pH在5.3–5.6之间。Brooks et al.(1996)也报道,pH降低时,钴络合物Co(II)EDTA2–和Co(III)EDTA–在水铁矿中的阻滞增强。
Due to the smaller amount of copper in the soil compared with the first experiment in Part I, much less copper was leached, namely 110 µmol compared with 295 µmol. The copper concentration in the soil at the end of leaching (data not shown) showed that little, or none, of the copper removed from the top 30 mm was re-adsorbed in the almost copper-free soil below. We attribute this to the short residence time of the CuEDTA2– in the soil, and the relative slowness of the reaction involved.
由于土壤中的铜量少于第I部分的第一项试验,淋出的铜也少得多,为110 µmol,而后者为295 µmol。淋溶结束时土壤中的铜浓度(数据未列出)表明,从上部30 mm去除的铜很少或没有在下方几乎不含铜的土壤中被重新吸附。我们将此归因于CuEDTA2–在土壤中停留时间短,以及相关反应相对缓慢。
Figure 5 shows the results of Expt E where 50-mL (31 mm) pulses of 0.001 M EDTAo (50 µmol) were left in soil columns for 0 and 30 days before leaching with 0.0025 M CaCl2. The amounts of copper leached were 12 µmol with continuous leaching, and 0.6 µmol with delayed leaching. The corresponding amounts of iron leached were 10 µmol and 40 µmol. Also 9 µmol of zinc was eluted from the column leached immediately, but virtually none from the column with 1 month’s delay.图5给出了试验E的结果,该试验将50 mL(31 mm)0.001 M EDTAo(50 µmol)脉冲在土柱中分别放置0 d和30 d后,再用0.0025 M CaCl2淋溶。连续淋溶时铜的淋出量为12 µmol,延迟淋溶时为0.6 µmol;相应的铁淋出量分别为10 µmol和40 µmol。此外,立即淋溶的土柱洗脱出9 µmol锌,而延迟1个月的土柱几乎没有。
To apply the model to Expts D and E, we need to take into account the greater availability of the iron at the lower pH in the soil used in the bottom 70 mm of the columns. As discussed above, in relation to Expt C, soil iron becomes more reactive as the pH decreases. So we now assume that the values for K2 andK4 changed with pH in the same way as we assumed earlier for K3 andK5. Thus, for both Expts D and E, we tookK2 as 6 × 10⁻⁵ s–1 and K4 as 6 × 10⁻⁶ s–1 in the bottom 70 mm of soil. For the copper-contaminated soil in the top 30 mm of the columns, the K values used were those found in Part I.
将模型应用于试验D和E时,需要考虑土柱下部70 mm所用土壤因pH较低而具有更高的铁有效性。如上文结合试验C所述,土壤铁的反应活性随pH降低而增强。因此,我们现假定K2和K4随pH的变化方式与前文对K3和K5的假定相同。据此,对于试验D和E,下部70 mm土壤中K2取6 × 10⁻⁵ s–1,K4取6 × 10⁻⁶ s–1。对于土柱上部30 mm的受铜污染土壤,K值采用第I部分的结果。
As discussed above, in Expt D the breakthrough of EDTA was retarded relative to bromide as a result of the lower pH in the bottom 70 mm of soil. Fitting by eye showed that an R value of 2 described this retardation for EDTA movement through the lower 70 mm of the columns reasonably well (Fig. 4a). This value was also assumed in the lower pH soil used in Expts C and E.
如上所述,试验D中由于下部70 mm土壤pH较低,EDTA的穿透相对于溴离子出现阻滞。目视拟合表明,R值取2能较好地描述EDTA通过土柱下部70 mm时的阻滞(图4a)。在试验C和E所用的低pH土壤中也假定了该值。
In Expt D, the observed copper breakthrough was more peaked than the simulated curve, and further the iron came out somewhat earlier (Fig. 4b). This could perhaps be due CuEDTA2– and Fe(III)EDTA– being less subject to adsorption than the Na2H2EDTA and calcium-EDTA as they moved through the lower 70 mm of the columns.
在试验D中,观测到的铜穿透曲线比模拟曲线更为尖锐,且铁的出现略早(图4b)。这可能是由于CuEDTA2–和Fe(III)EDTA–在通过土柱下部70 mm时比Na2H2EDTA和钙-EDTA更不易被吸附。
In the immediately leached column of Expt E, although the observed exiting pulse of EDTA from the column had the roughly expected retardation, its amplitude was about half that of the simulation (Fig. 5b). This suggests more adsorption of EDTA than implied by our assumed R value of 2. Our simple model implies a linear adsorption isotherm, whereas isotherms are usually non-linear. This non-linearity is consistent with the R value derived for 0.01 M EDTA underestimating the adsorption of 0.001 M EDTA.
在试验E立即淋溶的土柱中,尽管观测到从土柱流出的EDTA脉冲大致具有预期的阻滞,但其振幅约为模拟值的一半(图5b)。这表明EDTA的吸附多于我们假定的R值2所对应的吸附。我们的简单模型隐含线性吸附等温线,而实际等温线通常是非线性的。这种非线性与由0.01 M EDTA推导的R值低估0.001 M EDTA吸附的现象相一致。
In contrast to the immediately leached column, in Fig. 5b the peak EDTA concentration was greater than the simulated value for the column in which leaching was delayed for a month. We suggest the predictions are too high due to the presence of organic compounds other than EDTA affecting the DOC analyses, as discussed above.
与立即淋溶的土柱相反,图5b中延迟1个月淋溶的土柱EDTA峰值浓度高于模拟值。如前所述,我们认为这是由于EDTA以外的有机化合物影响了DOC分析,使推算值偏高。
Figure 5c shows that the concentrations of copper in the leachate from the immediately leached column in Expt E were closely simulated by the model, but not the column with delayed leaching, where it was overestimated. At these lower concentrations it seems the model underestimated the rate of conversion of CuEDTA2– to Fe(III)EDTA–. In contrast, Fig. 5d shows the model grossly overestimating the iron in the leachate from the immediately leached column, but quite accurately simulating it for the column with delayed leaching. This may be due to our procedure for selecting a value for K2 in the lower pH soil. The simulated iron concentration in the immediately leached column was found to be sensitive to this rate constant.图5c表明,模型较准确地模拟了试验E立即淋溶土柱淋出液中的铜浓度,但对延迟淋溶的土柱则高估了铜浓度。在这些较低浓度下,模型似乎低估了CuEDTA2–向Fe(III)EDTA–的转化速率。相反,图5d显示模型严重高估了立即淋溶土柱淋出液中的铁,但对延迟淋溶土柱的模拟相当准确。这可能与我们为低pH土壤选取K2值的方法有关。立即淋溶土柱的铁浓度模拟值对该速率常数较为敏感。
EDTA application to intact soil cores of Opotiki sandy loam: Expts F and G
对Opotiki砂壤土原状土柱施加EDTA:试验F和G
Experiments F and G again involved the same treatments as Expts A and B, but they entailed intact-soil cores of Opotiki sandy loam, rather than repacked soil columns. We first need to describe how we handled the problem of getting the initial copper concentration with depth, as we had no way of non-destructively measuring the initial copper distribution. We did take several smaller cores adjacent to each large core and measured the copper distribution in them. But due to soil variability, this need not necessarily give an accurate indication of the profiles in the large cores. However, by adding the amount of copper leached to that left in the soil after leaching, we found the total amount of copper that must have been initially present in each of the 3 large soil cores. We then used these total values, in conjunction with the shape of the distribution measured in the smaller soil cores taken adjacent to the large cores, to infer an initial copper distribution for each large core.
试验F和G的处理同样与试验A和B相同,但采用的是Opotiki砂壤土原状土柱,而非回填土柱。首先需要说明我们如何确定铜的初始深度分布,因为我们无法以非破坏性方式测定初始铜分布。我们在每个大土柱旁采集了若干小土芯并测定其中的铜分布,但由于土壤空间变异性,这未必能准确反映大土柱中的剖面分布。不过,将淋出的铜量与淋溶后残留于土壤中的铜量相加,即可得到3个大土柱中各自最初必然存在的铜总量。然后,利用这些总量,结合在大土柱旁所取小土芯中测得的分布形状,推断出每个大土柱的初始铜分布。
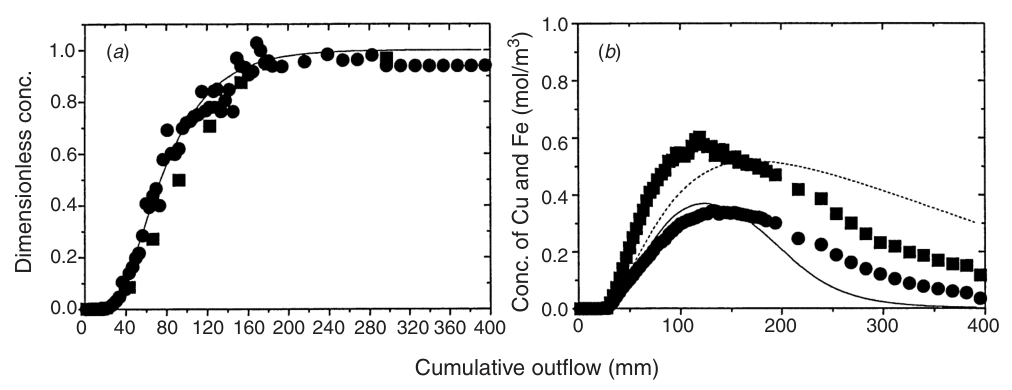
Figure 6a shows the dimensionless effluent concentrations of bromide and EDTA as a function of cumulative outflow when 0.01 M EDTAo was applied. In contrast to Fig. 4a, the EDTA data are only slightly retarded relative to the bromide, indicating little or no EDTA adsorption. This is probably due to the soil pH in the lower part of the intact soil core being higher than in Expt D (a pH of 5.0, compared with 4.5)图6a给出了施加0.01 M EDTAo时溴离子和EDTA无量纲出水浓度随累积出流量的变化。与图4a不同,EDTA数据相对于溴离子仅有轻微阻滞,表明EDTA吸附很少或没有。这可能是由于原状土柱下部的土壤pH高于试验D(pH 5.0,而试验D为4.5)。
The 40 mmol of EDTA applied in Expt F only extracted 641 µmol of copper, 75 µmol of zinc (data not shown), and 1076 µmol of iron in a cumulative volume of about 7 PV of leachate (Fig. 6b). The 641 µmol of copper was 54% of that present in the soil.
在试验F中施加的40 mmol EDTA,在累计约7 PV的淋出液中仅提取出641 µmol铜、75 µmol锌(数据未列出)和1076 µmol铁(图6b)。这641 µmol铜占土壤中铜含量的54%。
The EDTA application brought the copper concentration down from 240 mg/kg to 75 mg/kg in the top 30 mm of soil. In the first experiment in Part I using the same soil, but with a repacked column, the same treatment reduced the copper concentration to a similar value of 90 mg/kg. We were surprised at how effective the EDTA was in removing copper from the intact soil, given the highly non-uniform flow pathways usually found there. We believe this was due to the permeable nature of this soil, and to the flow being under non-ponding flow conditions. If the soil had been less permeable, and if ponding had occurred, we would have expected the flow to be highly preferential, and much less effective in removing the copper.
施用EDTA后,表层30 mm土壤中的铜浓度由240 mg/kg降至75 mg/kg。在第I部分使用同一土壤但为重填土柱的第一个试验中,相同处理使铜浓度降至相近的90 mg/kg。鉴于原状土中通常存在高度不均匀的水流路径,EDTA从原状土中去除铜的效果之好令我们感到意外。我们认为这是由于该土壤渗透性良好,且水流处于非积水条件下。若土壤渗透性较差且出现积水,我们预计水流将以优先流为主,去除铜的效果也会差得多。
Figure 7a and c show bromide, EDTA, copper, and iron effluent concentrations as a function of cumulative outflow for the column leached immediately after the EDTAo application. Figure 7b and d show the comparable data for the column with 1 month’s delay before leaching. The calculated percentages of the applied bromide recovered in the leachate were 115% with immediate leaching and 94% for the delayed leaching. These are reasonable recoveries, considering that some interference from nitrate occurred in the HPLC-AS5 column used to measure bromide concentration. With immediate leaching, the EDTA breakthrough data show significant retardation, and tailing, relative to bromide (Fig. 7a). This indicates some adsorption of EDTA by the soil. This behaviour is less evident for the column in which leaching was delayed for 1 month (Fig. 7b). Likely reasons for this are given below.图7a和c给出了施加EDTAo后立即淋溶的土柱中溴离子、EDTA、铜和铁的流出液浓度随累计出流量的变化。图7b和d给出了淋溶前延迟1个月的土柱的相应数据。经计算,淋出液中回收的溴离子占施加量的百分比在立即淋溶时为115%,在延迟淋溶时为94%。考虑到用于测定溴离子浓度的HPLC-AS5色谱柱受到硝酸根的一定干扰,这些回收率是合理的。立即淋溶时,EDTA穿透数据相对于溴离子表现出明显的滞后和拖尾(图7a),表明土壤对EDTA存在一定吸附。在延迟1个月淋溶的土柱中,这一现象不太明显(图7b),其可能原因见下文。
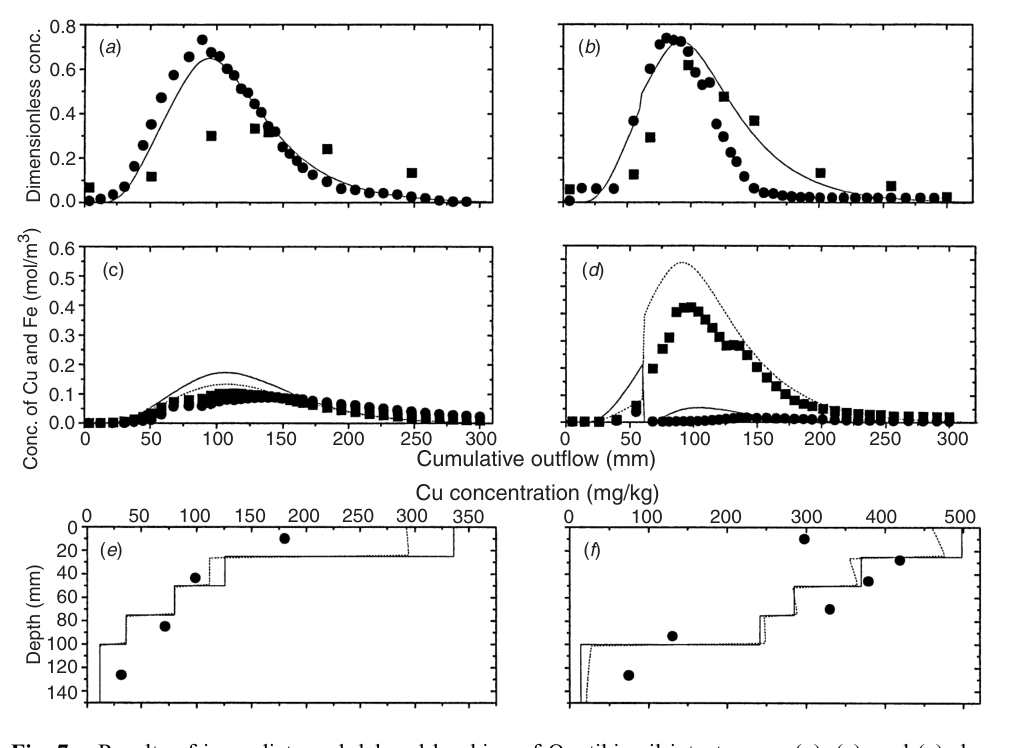
While the 1-month pause in leaching, when the cumulative outflow was 61 mm, did not cause any noticeable discontinuity in the bromide concentration (Fig. 7b), the pause induced a pronounced drop when leaching resumed in the copper concentration, and a large increase in the iron concentration (Fig. 7d). These changes reflect the time-dependent chemical reaction of CuEDTA2–. Flow interruption has frequently been used to study the effects of physical and chemical non-equilibrium in soil (Murali and Aylmore 1980; Brusseau et al. 1989). The absence of a concentration drop in the non-reactive bromide tracer concentration shows that physical non-equilibrium was not a factor in our experiment. Hence, the discontinuity in the copper and iron concentrations was due to the slow chemical reactions described above.
在累计出流量为61 mm时将淋溶暂停1个月,并未使溴离子浓度出现明显的不连续(图7b),但在恢复淋溶时,这一暂停导致铜浓度显著下降、铁浓度大幅上升(图7d)。这些变化反映了CuEDTA2–随时间变化的化学反应。中断水流常被用于研究土壤中物理与化学非平衡的影响(Murali and Aylmore 1980; Brusseau et al. 1989)。非反应性示踪剂溴离子的浓度未出现下降,表明物理非平衡并非本试验的影响因素。因此,铜和铁浓度的不连续是由上述缓慢化学反应所致。
Leaving the 480 µmol of EDTAo pulse in the soil for 1 month caused a decrease from 126 µmol, to 23 µmol, in the amount of copper leached. The associated increase in the iron leached was from 116 µmol to 286 µmol.
将480 µmol的EDTAo脉冲在土壤中保留1个月,使铜的淋出量由126 µmol降至23 µmol,与此相应,铁的淋出量由116 µmol增至286 µmol。
Figure 7e and f show the distributions of copper in the soil after immediate and delayed leaching. Figure 7e shows that the addition of just 61 mm of 0.001 M EDTA, followed within a few days by rain or irrigation, could reduce the copper concentration in the top 20 mm of the soil from 330 mg/kg to 180 mg/kg. In the delayed leaching experiment (Fig. 7f), except in the top 20 mm, the final copper concentration was greater than that initially present. Following the application of the 61 mm EDTAo pulse, some copper, after complexing with the EDTA, would have travelled to the end of the column, given the high图7e和f给出了立即淋溶和延迟淋溶后土壤中铜的分布。图7e表明,仅施加61 mm的0.001 M EDTA,并在随后数天内降雨或灌溉,即可使表层20 mm土壤中的铜浓度由330 mg/kg降至180 mg/kg。在延迟淋溶试验中(图7f),除表层20 mm外,最终铜浓度均高于初始值。施加61 mm EDTAo脉冲后,鉴于较高的
dispersivity of 23 mm. The presence of some EDTA and copper in the first 61 mm of leachate confirms this. Hence, in contrast to the second experiment in Part I using repacked soil, where most of the copper was re-adsorbed in a narrow band at a depth of 35 mm, Fig. 7d shows that in the intact soil, the copper was re-adsorbed over the whole 150 mm column depth.
弥散度(23 mm),部分铜在与EDTA络合后会迁移至土柱底端。最初61 mm淋出液中存在一定量的EDTA和铜证实了这一点。因此,与第I部分使用重填土的第二个试验中大部分铜在35 mm深度处的窄带内被重新吸附不同,图7d表明,在原状土中铜在整个150 mm土柱深度范围内被重新吸附。
One of the aims of the study was to see if the model that we developed for the repacked soil could be applied to intact soil. To simulate the intact soil core data from Expt F, the parameters derived from experiments in Part I were used, as the soil used was the same. The only exception was the quite different soil structure, and so flow pathways; hence we expected a very different dispersivity (λ). The bromide breakthrough data in Fig. 6a yielded a fitted value of 23 mm, an order of magnitude greater than the value for the repacked soil. The simulated curve obtained using this value is shown in Fig. 6a. The same curve, which assumes negligible adsorption (R = 1), simulated the EDTA breakthrough. The observed EDTA data for Expt F show only a slight retardation relative to the bromide data, much less than in Fig. 4a, indicating little adsorption. This was expected, as the intact soil pH was much closer to that of the repacked soil used in Part I than that used in Expt D.
本研究的目的之一是检验我们针对重填土建立的模型能否应用于原状土。由于所用土壤相同,模拟试验F的原状土芯数据时采用了第I部分试验得出的参数。唯一的例外是土壤结构及由此决定的水流路径差异很大,因此我们预期弥散度(λ)会有很大不同。根据图6a中的溴离子穿透数据拟合得到的值为23 mm,比重填土的值高一个数量级。采用该值得到的模拟曲线见图6a。同一曲线(假设吸附可忽略,R = 1)也模拟了EDTA的穿透。试验F中观测到的EDTA数据相对于溴离子数据仅略有滞后,远小于图4a中的滞后,表明吸附很少。这在预料之中,因为原状土的pH与第I部分所用重填土的pH更为接近,而与试验D所用土壤相差较大。
The simulated copper and iron breakthrough curves for Expt F in Fig. 6b approximate the observed curves, as does the final copper distribution in the soil, despite the radically different soil structure. This is encouraging, although the amount of copper leached was 640 µmol, whereas the model predicted 480 µmol. This discrepancy can be partly attributed to an overestimation the amount of non-EDTA extractable copper in the soil, as discussed above.
尽管土壤结构截然不同,图6b中试验F的铜和铁模拟穿透曲线与观测曲线大致相符,土壤中铜的最终分布亦是如此。这一结果令人鼓舞,但铜的淋出量为640 µmol,而模型预测值为480 µmol。如上文所述,这一差异可部分归因于对土壤中非EDTA可提取态铜含量的高估。
For the immediately leached column in Expt G, Fig. 7a shows that while the breakthrough of bromide is well described, the measured values for EDTA have a much lower maximum, and the breakthrough is retarded. This suggests that some of the relatively small pulse of EDTA applied was adsorbed. Similar behaviour was observed in Expt E (Fig. 5a). It is interesting, however, that the second experiment in Part I showed no EDTA adsorption. We surmise this result was due to the higher soil pH.
对于试验G中立即淋溶的土柱,图7a表明,溴离子的穿透得到了较好的描述,但EDTA实测值的峰值低得多,且穿透存在滞后。这表明所施加的相对较小的EDTA脉冲中有一部分被吸附。在试验E中也观察到了类似现象(图5a)。然而值得注意的是,第I部分的第二个试验未显示EDTA吸附。我们推测这一结果是由于土壤pH较高所致。
For the immediately leached column, there was only approximate agreement between the measured and simulated values for the copper and iron concentration in the leachate, and for the final copper concentrations in the soil (Figs 7c, e). As might be expected, close agreement was not found between the observed and simulated concentrations of copper and iron in the leachate, due to the discrepancy between the observed and simulated EDTA behaviour evident in Fig. 7a. Also, in the early leachate, the iron concentration was higher than the copper concentration, while the simulation predicted the opposite. We attribute this to the leading edge of the EDTA pulse encountering some very reactive iron as it moves through the soil.
对于立即淋溶的土柱,淋出液中铜和铁浓度以及土壤中最终铜浓度的实测值与模拟值之间仅大致吻合(图7c、e)。正如所预期的,由于图7a中所示EDTA行为的观测值与模拟值存在差异,淋出液中铜和铁浓度的观测值与模拟值之间未能很好吻合。此外,在早期淋出液中,铁浓度高于铜浓度,而模拟结果则相反。我们将此归因于EDTA脉冲前锋在土壤中迁移时遇到了一些反应活性很强的铁。
For the reasons given in the discussion of Expt B, the month’s delay in leaching, coupled with the low soil-solution copper concentration, means that the inferred EDTA values are suspect due to the likelihood of additional organic carbon contributing to the measured DOC. So, the peak EDTA concentration being higher in Fig. 7b than in Fig. 7a might be an artefact. The actual peak EDTA concentration in the leachate was probably somewhat lower than the simulated value, due to adsorption. If so, that would explain the peak iron and copper concentrations found in the leachate being lower than the simulated values (Fig. 7d). The drop in the leachate copper concentration, and the sudden increase in iron concentration following the month-long pause, was simulated reasonably well.
基于讨论试验B时给出的理由,淋溶延迟1个月加之土壤溶液中铜浓度较低,意味着其他有机碳很可能对实测DOC有所贡献,因而推算的EDTA值并不可靠。因此,图7b中EDTA峰值浓度高于图7a可能是一种假象。由于吸附作用,淋出液中实际的EDTA峰值浓度可能略低于模拟值。若果真如此,便可解释淋出液中铁和铜的峰值浓度低于模拟值的现象(图7d)。暂停1个月后淋出液中铜浓度的下降以及铁浓度的骤增得到了较好的模拟。
The simulated, final copper concentrations shown in Fig. 7e and f underestimate the amount of copper removed from the top 20 mm of soil. This could be due to the copper being less strongly bound to the intact soil than the repacked soil, and so the assumed value for K1 was too low.
图7e和f中铜的最终浓度模拟值低估了表层20 mm土壤中铜的去除量。这可能是由于原状土对铜的结合弱于重填土,因而所设定的K1取值过低。
5Conclusions结论
Prolonged leaching with 0.01 M EDTA reduced the copper concentration in a repacked column of Manawatu fine sandy loam from 60 to 40 µg/g. It also reduced the copper concentration in the top 25 mm of an intact core of contaminated Opotiki sandy loam from 240 to 80 µg/g. A substantial amount of iron was also leached in both cases.
用0.01 M EDTA长时间淋溶,使Manawatu细砂壤土重填土柱中的铜浓度由60 µg/g降至40 µg/g,并使受污染的Opotiki砂壤土原状土芯表层25 mm中的铜浓度由240 µg/g降至80 µg/g。两种情况下均有大量铁被淋出。
When a pulse of EDTA was applied to copper-contaminated soil, and left there for up to 1 month before leaching, there was a time-dependent drop in the amount of copper leached, and a corresponding increase in the amount of iron leached. A month’s delay reduced, to a negligible amount, the copper leached in both the repacked Manawatu soil and the intact Opotiki sandy loam cores. Associated with this reduction was an increase in the amount of iron leached. An experiment in which daily pulses CuEDTA2– were applied to a low-copper soil for 3 months showed that this reduction in copper mobilisation was due to CuEDTA2– slowly changing to Fe(III)EDTA–, and the re-adsorption of the Cu2+ released.
向铜污染土壤施加EDTA脉冲并保留最长1个月后再进行淋溶时,铜的淋出量随时间下降,铁的淋出量相应增加。延迟1个月使重填Manawatu土壤和Opotiki砂壤土原状土芯中铜的淋出量均降至可忽略的水平,与此同时铁的淋出量增加。在一项向低铜土壤每日施加CuEDTA2–脉冲、持续3个月的试验中,结果表明铜活化作用的减弱是由于CuEDTA2–缓慢转化为Fe(III)EDTA–,以及释放出的Cu2+被重新吸附。
The features of the experimental results were generally well simulated using the model developed in Part I, but the kinetic rate coefficients were different for the 2 soils, and for the Opotiki soil when the pH was lower. The repacked-soil model was able to simulate reasonably successfully the intact soil core experiments by simply changing the dispersivity from 3 mm to 23 mm. We see the main value of the model as providing a vehicle for discussing the experimental results in terms of the interacting physical and chemical processes involved. However, our simplified model is only appropriate for aerobic soils in which copper is the only heavy metal present in significant amounts. It would not be applicable to soils or sediments under anaerobic conditions and those that have multiple metals as contaminants. In such cases several other metal–EDTA reactions and their interactions would need to be taken into account.
利用第I部分建立的模型,总体上可以较好地模拟试验结果的特征,但2种土壤的动力学速率系数不同,Opotiki土壤在pH较低时的速率系数亦不同。只需将弥散度由3 mm改为23 mm,重填土模型即可较为成功地模拟原状土芯试验。我们认为该模型的主要价值在于为从相互作用的物理和化学过程角度讨论试验结果提供了工具。然而,我们的简化模型仅适用于铜是唯一大量存在的重金属的好氧土壤,不适用于厌氧条件下的土壤或沉积物以及受多种金属污染的土壤或沉积物。在这些情况下,需要考虑其他若干金属–EDTA反应及其相互作用。
The results presented here, and in Part I, show that off-site leaching with an EDTA solution could remove most of the copper from contaminated soil. The copper could then be extracted from the leachate and the EDTA recycled. Whether it is feasible technically and economically remains to be seen. The prospects for using in situ application of EDTA to enhance phytoremediation do not seem good. In a week or so, nearly all the copper initially brought into solution is likely to have been re-adsorbed, leaving only a brief window for enhanced uptake by plants. On the other hand, leaching with EDTA could perhaps be used in some situations to reduce an undesirably high copper concentration in the surface soil, distributing much of that copper throughout the soil profile at a much lower concentration. This would require that the residence time of soil water moving through the profile to the water table to be in excess of a month. Furthermore, the soil would need to contain a reasonable amount of EDTA-extractable iron. Otherwise groundwater contamination is likely.
本文及第I部分的结果表明,采用EDTA溶液进行异位淋洗可去除污染土壤中的大部分铜。随后可从淋出液中提取铜并回收利用EDTA。其技术和经济可行性尚待验证。原位施用EDTA以强化植物修复的前景似乎并不乐观。在一周左右的时间内,最初进入溶液的铜几乎全部可能已被重新吸附,仅留下短暂的窗口期供植物强化吸收。另一方面,在某些情况下,EDTA淋溶或许可用于降低表层土壤中过高的铜浓度,使其中大部分铜以低得多的浓度分布于整个土壤剖面。这要求土壤水穿过剖面到达地下水位的滞留时间超过1个月。此外,土壤还需含有相当数量的EDTA可提取态铁,否则很可能造成地下水污染。
6Acknowledgments致谢
This work was funded by New Zealand’s Foundation for Research Science and Technology through contract C06830 ‘Root-zone Processes and Water Resource Sustainability’ and C06X0004 ‘Knowledge Tools for Environmental Action’. The authors would like to thank Landcare Research New Zealand Ltd (Palmerston North) for the analysis of DOC, and Dr Alan S. Palmer, Massey University for helping with soil identification.
本研究由新西兰科学研究与技术基金会(Foundation for Research Science and Technology)资助,合同编号C06830“Root-zone Processes and Water Resource Sustainability”(根区过程与水资源可持续性)和C06X0004“Knowledge Tools for Environmental Action”(环境行动知识工具)。作者感谢Landcare Research New Zealand Ltd(Palmerston North)对DOC的分析,并感谢梅西大学(Massey University)的Alan S. Palmer博士在土壤鉴定方面给予的帮助。
7References参考文献
Allison LE (1947) Effect of micro-organisms on permeability of soil under prolonged submergence. Soil Science 63, 439–450.
Barona A, Aranguiz I, Elias A (2001) Metal associations in soils before and after EDTA extractive decontamination: implications for the effectiveness of further clean-up procedures. Environmental Pollution 113, 79–85.
Brooks SC, Taylor DL, Jardine PM (1996) Reactive transport of EDTA-complexed cobalt in the presence of ferrihydrite. Geochimica et Cosmochimica Acta 60, 1899–1908.
Brusseau ML, Rao PSC, Jessup RE, Davidson JM (1989) Flow interruption: A method for investigating sorption nonequilibrium. Journal of Contaminant Hydrology 4, 223–240.
Hewitt AE (1993) ‘New Zealand soil classification.’ Landcare Research Science Series No. 1. (Manaaki-Whenua Press: Lincoln, NZ)
Loveday J (1974) ‘Methods for analysis of irrigated soils.’ (CAB International: Wallingford, UK) Magesan GN, Vogeler I, Scotter DR, Clothier BE (1995) Solute movement through two unsaturated soils. Australian Journal of Soil Research 33, 585–596.
McGrath SP, Sanders JR, Shalaby MH (1988) The effects of organic matter levels on soil solution concentrations and extractabilities of manganese, zinc and copper. Geoderma 42, 177–188. Merry RH, Tiller KG, Alston AM (1983) Accumulation of copper, lead and arsenic in some Australian orchard soils. Australian Journal of Soil Research 21, 549–561.
Murali V, Aylmore LAG (1980) No-flow equilibrium and adsorption dynamics during ionic transport in soils. Nature 283, 467–469.
Parker DR, Norvell WA, Chaney RL (1995) GEOCHEM-PC: A chemical speciation program for IBM and compatible personal computers. In ‘Chemical equilibrium and reaction models’. (Eds RH Loeppert, PA Schwab, S Goldberg) SSSA Special Publication No. 42. pp. 253–269. (Soil Science Society of America: Madison, WI)
Thayalakumaran T, Vogeler I, Scotter DR, Percival HJ, Robinson BH, Clothier BE (2003) Leaching of copper from contaminated soil following the application of EDTA. I. Repacked soil experiments and a model. Australian Journal of Soil Research 41, 323–333.