M. MENONa , B. ROBINSONa , S. E. OSWALDb , A. KAESTNERa , K. C. ABBASPOURc , E. LEHMANNd & R. SCHULINa aInstitute of Terrestrial Ecology, Swiss Federal Institute of Technology (ETH), Universitatstrasse 16, 8092, Zurich, Switzerland, bDepartment of Hydrogeology, UFZ Centre for Environmental Research, Permoserstrasse 15, D-04318 Leipzig, Germany, cSwiss Federal Institute for Aquatic Science and Technology (EAWAG), Ueberlandstrasse 133, PO Box 611, 8600, Duebendorf, Switzerland and dPaul Scherrer Institute (PSI), 5232, Villigen, Switzerland
M. MENONa,B. ROBINSONa,S. E. OSWALDb,A. KAESTNERa,K. C. ABBASPOURc,E. LEHMANNd,R. SCHULINa a瑞士联邦理工学院(ETH)陆地生态研究所,Universitatstrasse 16, 8092,苏黎世,瑞士;bUFZ环境研究中心水文地质系,Permoserstrasse 15, D-04318,莱比锡,德国;c瑞士联邦水生科学与技术研究所(EAWAG),Ueberlandstrasse 133, PO Box 611, 8600, Duebendorf,瑞士;d保罗·谢勒研究所(PSI),5232, Villigen,瑞士
1Summary摘要
We used neutron radiography (NR), a non-invasive and in situ technique, to study living plant roots in soil. Plant roots have a larger water content than their unsaturated surrounding media. As water strongly attenuates a neutron-beam, NR can identify root structures in detail. We investigated the use of NR to visualize the root growth of lupin in quartz sand and in a loamy sand field soil. Further experiments elucidated the root growth of lupin in the loamy sand heterogeneously contaminated with 10 and 20 mg kg�1 boron (B) and 100 mg kg�1 zinc (Zn). We obtained high-quality images of root growth dynamics in both media with a resolution range of 110–270 mm. The images with quartz sand revealed fine structures such as proteoid roots that are difficult to locate in situ by other methods without destruction of the soil. Though quartz sand provided excellent visibility of roots, it proved to be a poor medium for growing plants, probably because of its bulk density (1.8 Mg m�3). The images with field soil showed normal root growth with slightly less contrast than the quartz sand. The poorer contrast was due to the greater neutron interaction with soil water and soil organic matter. In the heterogeneously contaminated soil, root growth was significantly reduced in the contaminated part of the soil in all B and Zn treatments. This study shows that NR has potential as a non-invasive method to investigate root growth over time as well as the response of roots to various abiotic stress factors.
本研究采用中子成像(NR)这一非侵入性原位技术研究土壤中活体植物根系。植物根系的含水量高于其周围的非饱和介质。由于水对中子束具有强烈的衰减作用,NR能够细致地识别根系结构。本文考察了利用NR对石英砂和壤质砂土田间土壤中羽扇豆根系生长进行可视化的效果。进一步的试验阐明了羽扇豆在非均匀污染了10和20 mg kg−1硼(B)以及100 mg kg−1锌(Zn)的壤质砂土中的根系生长状况。在两种介质中均获得了反映根系生长动态的高质量图像,分辨率范围为110–270 μm。石英砂图像揭示了排根(proteoid roots)等精细结构,而采用其他方法若不破坏土壤则难以原位定位这些结构。尽管石英砂中根系的可见性极佳,但可能由于其容重(1.8 Mg m−3)较高,石英砂被证明是较差的植物生长介质。田间土壤图像显示根系生长正常,但对比度略低于石英砂。对比度较差的原因在于中子与土壤水分及土壤有机质之间的相互作用更强。在非均匀污染土壤中,所有B和Zn处理下土壤污染部分的根系生长均显著降低。本研究表明,NR作为一种非侵入性方法,在研究根系随时间的生长以及根系对各种非生物胁迫因子的响应方面具有应用潜力。
2Introduction引言
Roots are the hidden half of terrestrial plants. Our understanding of root systems is limited by the difficulty of observing root growth and activity without destruction of the surrounding soil. The development of in situ and non-invasive techniques for root measurement would alleviate these difficulties. At present, the non-destructive techniques available for measuring root growth are: (a) monitoring by means of minirhizotrons, which are transparent plastic tubes inserted into the ground to view the roots using a video camera; (b) X-radiography (Gregory et al., 2003; Pierret et al., 2003); and (c) neutron radiography (Willatt & Struss, 1978; Willatt et al., 1978; Couchat et al., 1980; Furukawa et al., 1999). Although non-destructive, minirhizotrons have an invasive component (Majdi, 1996), while neutron radiography (NR) and X-radiography (X-ray) are complementary non-invasive imaging techniques. X-rays interact with the electronic shells of atoms, whereas neutrons interact with the nuclei of atoms. Therefore, neutron radiographs and X-radiographs show different characteristics of the imaged object. Both methods can provide two-dimensional images in transmission, such as in traditional medical X-ray imaging, or be used to perform three-dimensional tomography, as in the case of X-ray computer tomography (CT).
根系是陆生植物隐藏的一半。由于难以在不破坏周围土壤的情况下观察根系的生长和活动,人们对根系的认识受到限制。发展原位、非侵入性的根系测定技术将有助于克服这些困难。目前,可用于测定根系生长的非破坏性技术包括:(a)微根管监测,即将透明塑料管插入地下,利用摄像机观察根系;(b)X射线成像(Gregory et al., 2003; Pierret et al., 2003);以及(c)中子成像(Willatt & Struss, 1978; Willatt et al., 1978; Couchat et al., 1980; Furukawa et al., 1999)。微根管虽属非破坏性方法,但具有一定的侵入性(Majdi, 1996),而中子成像(NR)与X射线成像(X-ray)则是互为补充的非侵入性成像技术。X射线与原子的电子壳层相互作用,而中子则与原子核相互作用。因此,中子成像图与X射线成像图反映的是被成像物体的不同特征。两种方法既可如传统医学X射线成像那样提供二维透射图像,也可用于三维断层扫描,如X射线计算机断层扫描(CT)。
Correspondence: B. Robinson. E-mail: brett.robinson@env.ethz.ch Received 1 February 2005; revised version accepted 3 August 2006
Radiography techniques (X-ray or NR) are based on the exponential law (similar to the Lambert–Beer law) of attenuation of radiation passing through matter (Kasperl & Vontobel, 2005):
成像技术(X射线或NR)基于辐射穿过物质时衰减的指数定律(类似于Lambert–Beer定律)(Kasperl & Vontobel, 2005):

where I is the attenuated neutron flux (m�2 s�1) after an incident neutron flux I0 passes through a material of thickness d (m) with an attenuating constant RSample (m�1), which is a characteristic of the material (not a summation). The quantity I represents an integer ranging from 0 to 65 535, which is a grey value proportional to the neutron flux.
式中,I为入射中子通量I0穿过厚度为d(m)、衰减常数为RSample(m−1)的材料后的衰减中子通量(m−2 s−1),RSample为材料的特征参数(并非求和)。量I表示0至65 535之间的整数,是与中子通量成正比的灰度值。
As materials differ in their attenuating behaviour, a neutron beam passing through a sample provides information about the composition and structure of the sample. Neutron radiography is a powerful tool for imaging water distribution in a sample, as hydrogen has a relatively large R value. The volumetric water content of plant roots generally ranges between 70 and 95%, while that of soils at field capacity usually ranges between 5 and 30%. This difference in water content provides sufficient contrast to distinguish roots from surrounding soil using NR. The neutron radiograph of a sample is a result of all the neutron attenuation processes occurring while the neutron beam penetrates a sample. Therefore, the visibility of roots depends on the thickness, water content or organic matter of the porous media. For example, dry quartz sand has greater neutron transmission than a dry soil of the same thickness and moisture content. Some workers used neutron radiography in the 1970s and 1980s to study early germination and root growth of corn (Couchat et al., 1980) and soybean (Willatt & Struss, 1978; Willatt et al., 1978). At that time low-resolution images were acquired using imaging plates or films and required much longer exposure times than modern CCD (charge coupled device) image capture methods.
由于不同材料的衰减行为不同,穿过样品的中子束能够提供有关样品组成和结构的信息。由于氢具有相对较大的R值,中子成像是对样品中水分分布进行成像的有力工具。植物根系的体积含水量一般在70%~95%之间,而田间持水量下土壤的体积含水量通常在5%~30%之间。这种含水量差异提供了足够的对比度,使NR能够将根系与周围土壤区分开来。样品的中子成像图是中子束穿透样品过程中所发生的全部中子衰减过程的结果。因此,根系的可见性取决于多孔介质的厚度、含水量或有机质。例如,在厚度和含水量相同的情况下,干石英砂的中子透射率高于干土壤。20世纪70和80年代,一些研究者曾利用中子成像研究玉米(Couchat et al., 1980)和大豆(Willatt & Struss, 1978; Willatt et al., 1978)的早期萌发和根系生长。当时采用成像板或胶片获取低分辨率图像,所需曝光时间远长于现代CCD(电荷耦合器件)图像采集方法。
Recently, NR has improved due to fast digital imaging and increased resolution. Digital imaging techniques that use a CCD camera combined with image processing tools yield quantifiable images with a resolution of about 100 mm. The required exposure time for such images is in the order of seconds. Images acquired using imaging plates or films required several minutes of exposure to the potentially damaging neutron beam. These advances open up the possibility of using this technique to study root system development in soils and simultaneously monitor soil moisture distribution.
近年来,得益于快速数字成像和分辨率的提高,NR技术得到了改进。采用CCD相机结合图像处理工具的数字成像技术可获得分辨率约为100 μm的可定量图像,所需曝光时间仅为秒级。而采用成像板或胶片获取图像则需要在具有潜在损伤作用的中子束下曝光数分钟。这些进展使得利用该技术研究土壤中根系发育并同时监测土壤水分分布成为可能。
Here we use neutron radiography to measure root growth in response to elevated concentrations of B and Zn in soil. Several investigations have shown, at large concentrations, that these essential elements inhibit plant root growth (Breckle, 1991). Both these elements are more soluble under acidic conditions. In plants, B and Zn concentrations are usually in the range of 10–50 mg kg�1 and 20–100 mg kg�1, respectively.
本文利用中子成像测定根系生长对土壤中高浓度B和Zn的响应。多项研究表明,这些必需元素在高浓度下会抑制植物根系生长(Breckle, 1991)。这两种元素在酸性条件下溶解度均较高。植物中B和Zn的浓度通常分别为10–50 mg kg−1和20–100 mg kg−1。
The spatial distribution of soil contaminants is usually heterogeneous, not only over scales of metres and beyond, but also at smaller scales. The heterogeneous distribution of soil contaminants affects root growth. The roots of some tree species avoid hotspots contaminated with heavy metals (Dickinson et al., 1991; Breckle & Kahle, 1992). Conversely, roots of the Zn hyperaccumulator Thlaspi caerulescens (J. Presl & C. Presl) actively forage Zn-rich hotspots in soils (Schwartz et al., 1999; Whiting et al., 2000).
土壤污染物的空间分布通常是非均匀的,这不仅体现在米级及更大尺度上,也体现在更小的尺度上。土壤污染物的非均匀分布会影响根系生长。一些树种的根系会避开重金属污染热点(Dickinson et al., 1991; Breckle & Kahle, 1992)。相反,Zn超富集植物Thlaspi caerulescens(J. Presl & C. Presl)的根系则会主动在土壤中富Zn热点处觅食(Schwartz et al., 1999; Whiting et al., 2000)。
The response of roots to heterogeneously distributed soil contaminants may profoundly affect their uptake by plants as well as their leaching into receiving waters. The underlying principles of how heterogeneously distributed trace elements influence plant root growth are not well understood. In order to reveal such mechanisms, it is important to visualize root growth and activity with minimum disturbance.
根系对土壤中非均匀分布污染物的响应可能深刻影响植物对污染物的吸收以及污染物向受纳水体的淋溶。非均匀分布的微量元素如何影响植物根系生长,其基本原理尚不清楚。为揭示此类机制,在尽量减少扰动的情况下对根系生长和活动进行可视化十分重要。
The aim of this study was to elucidate the potential of NR to monitor root growth in heterogeneously contaminated media. For this purpose, we chose to investigate the growth of lupin (Lupinus albus L.) in soil heterogeneously contaminated with B and Zn.
本研究旨在阐明NR在监测非均匀污染介质中根系生长方面的潜力。为此,选择研究羽扇豆(Lupinus albus L.)在非均匀污染B和Zn的土壤中的生长。
3Materials and methods材料与方法
Neutron radiography system中子成像系统
The experiment was performed at the Neutron Radiography facility (NEUTRA) at the Paul Scherrer Institute (PSI), Villigen, Switzerland (Lehmann et al., 2001). This facility consists of a neutron source, collimator, sample, and image detector. The neutron-generating source can be a reactor, the target of an accelerator, or a neutron-emitting isotope. The NEUTRA facility at PSI uses neutrons emitted from a lead (Pb) target that is bombarded with high-energy protons. A heavy-water moderator then converts high-energy neutrons into thermal neutrons.
试验在瑞士Villigen保罗·谢勒研究所(PSI)的中子成像装置(NEUTRA)上进行(Lehmann et al., 2001)。该装置由中子源、准直器、样品和图像探测器组成。产生中子的源可以是反应堆、加速器靶或发射中子的同位素。PSI的NEUTRA装置利用高能质子轰击铅(Pb)靶所发射的中子,再由重水慢化剂将高能中子转化为热中子。
The collimator is a beam-forming assembly that determines the geometric properties of the beam and contains filters that reduce the intensity of gamma rays. The image resolution depends on the collimator geometry and is expressed by the collimation ratio L/D, where L is the collimator length and D is the diameter of the inlet aperture of the collimator on the side facing the source. In our study, a neutron flux of 3 � 1010 m�2 s�10 was used with a mean energy of 25 meV and a collimation ratio of L/D = 550. The beam was transmitted through the sample and a plane position-sensitive detector recorded the resulting image. This detector records a two-dimensional image that is a projection of the object on the detector plane. We used a CCD camera detector with an array of 1024 � 1024 pixels, giving a resolution of 110–270 mm in the digital images.
准直器是一种束流成形组件,决定中子束的几何特性,并装有降低γ射线强度的过滤器。图像分辨率取决于准直器几何结构,以准直比L/D表示,其中L为准直器长度,D为准直器朝向中子源一侧入口孔径的直径。本研究采用的中子通量为3 × 1010 m−2 s−1,平均能量为25 meV,准直比L/D = 550。中子束穿过样品后,由平面位置灵敏探测器记录所得图像。该探测器记录的是物体在探测器平面上投影的二维图像。本研究使用像素阵列为1024 × 1024的CCD相机探测器,数字图像分辨率为110–270 μm。
Material testing材料测试
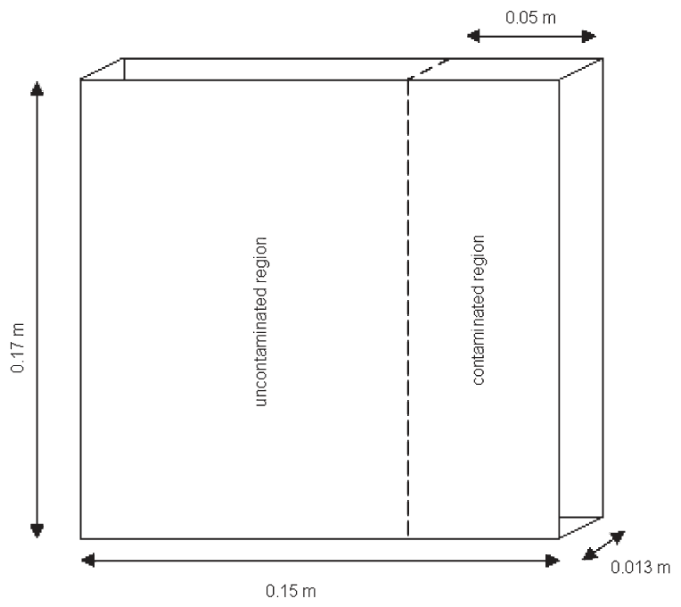
Wegrew the plantsin quartz sand and a natural soil(loamysand). Sand and soil samples were prepared in slab-shaped aluminium containers because of the transparency (poor attenuation) of aluminium to neutrons. We used slabs with inner dimensions of 0.17 � 0.15 � 0.013 m (Figure 1). Preliminary tests revealed that a slab thickness of 0.013 m gave good contrast in the images, while providing adequate space for root development.
植物分别种植于石英砂和天然土壤(壤质砂土)中。由于铝对中子具有透明性(衰减弱),砂和土壤样品均装填于板状铝制容器中。所用容器内部尺寸为0.17 × 0.15 × 0.013 m(图1)。预试验表明,0.013 m的容器厚度既能使图像具有良好的对比度,又能为根系发育提供足够空间。
Quartz sand. Two slabs were filled with acid-washed dry quartz sand, with grain size of 100–500 mm. The average bulk density of the packed sand was 1.8 Mg m�3. A single lupin seed was sown directly onto the surface at the centre of the slabs. The plants were grown in a controlled environment chamber at 21/16°C (day/night), a daily photoperiod of 16 hours, with fluorescent lighting (9000–10 000 Lux), for 10 days before first imaging.
石英砂。将经酸洗的干燥石英砂(粒径100–500 μm)装入两个容器中。装填后砂的平均容重为1.8 Mg m−3。在容器中央表面直接播种一粒羽扇豆种子。植株在人工气候室中生长,温度为21/16°C(昼/夜),每日光周期16小时,采用荧光灯照明(9000–10 000 Lux),生长10天后进行首次成像。
The sand slabs were irrigated with Hoagland’s nutrient solution with a pH of 6.
砂质容器采用pH为6的Hoagland营养液灌溉。
Loamy sand field soil. Three slabs were prepared with an acidic loamy sand soil (Haplic Alisol), which was obtained from a site along the River Rhine under mixed deciduous forest in the vicinity of Zurich, Switzerland (87% sand, 8% silt, 5% clay; pH = 4.2; organic carbon ¼ 3.2 g kg�1; bulk density ¼ 1.4 Mg m�3). The plants were grown in the controlled environment chamber for 2 weeks before the first imaging. Soil slabs were irrigated with tap water.
壤质砂土田间土壤。用酸性壤质砂土(Haplic Alisol)装填三个容器,该土壤采自瑞士苏黎世附近莱茵河沿岸落叶混交林下的一处样地(砂粒87%,粉粒8%,黏粒5%;pH = 4.2;有机碳 = 3.2 g kg−1;容重 = 1.4 Mg m−3)。植株在人工气候室中生长2周后进行首次成像。土壤容器采用自来水灌溉。
During the imaging period, planted slabs were not removed from the NEUTRA facility for safety reasons. Fluorescent lighting and air conditioning maintained a day/night temperature of 21/16°C and a daily photoperiod of 16 hours. Images of the sand slabs were taken weekly for a period of 4 weeks. In the soil slabs, we stopped imaging after the third week due to a faster root growth, which had filled the entire soil volume of the slabs.
成像期间,出于安全原因,种植容器未移出NEUTRA装置。通过荧光灯照明和空调维持21/16°C的昼/夜温度和每日16小时的光周期。砂质容器每周成像一次,持续4周。土壤容器中根系生长较快,已充满容器内全部土壤体积,因此在第三周后停止成像。
Based on the results of Experiment 1, which proved soil to be a better growing medium, we selected the loamy sand for further experiments. In order to determine a suitable level of contamination to be applied in the imaging experiment, we performed two pot experiments using soils spiked with B and Zn to study the growth of lupin (Lupinus albus L.), maize (Zea mays L.), poplar (Populus tremula L.), willow (Salix viminalis L.) and mustard (Brassica juncea L.). The loamy sand soil was mixed with 0, 6, 12, 25, 50 and 100 mg B kg�1 and 0, 125, 250, 500, 1000 and 2000 mg Zn kg�1. We found that concentrations between 6 and 25 mg kg�1 B and 125 mg kg�1 Zn were sufficient to induce toxicity symptoms in leaves of lupin, yet not result in plant death.
根据试验1的结果(证明土壤是更好的生长介质),选择壤质砂土开展后续试验。为确定成像试验中适宜的污染水平,利用添加B和Zn的土壤开展了两项盆栽试验,研究羽扇豆(Lupinus albus L.)、玉米(Zea mays L.)、杨树(Populus tremula L.)、柳树(Salix viminalis L.)和芥菜(Brassica juncea L.)的生长。壤质砂土中分别混入0、6、12、25、50和100 mg B kg−1以及0、125、250、500、1000和2000 mg Zn kg−1。结果表明,6~25 mg kg−1的B和125 mg kg−1的Zn足以使羽扇豆叶片出现毒害症状,但不会导致植株死亡。
Based on the results of Experiment 2, we chose three treatments: two concentrations of B (10 and 20 mg kg�1) and one concentration of Zn (100 mg kg�1) for further investigation. We prepared three replicates of slabs with the control soil, homogeneously contaminated soil, and heterogeneously contaminated soil. The treatment levels were achieved by mixing H3BO3 or ZnCl2 into the loamy sand soil.
根据试验2的结果,选择三个处理作进一步研究:两个B浓度(10和20 mg kg−1)和一个Zn浓度(100 mg kg−1)。对照土壤、均匀污染土壤和非均匀污染土壤容器各设三个重复。通过向壤质砂土中混入H3BO3或ZnCl2达到各处理水平。
# 2006 The Authors
The heterogeneously contaminated slabs consisted of two vertical bands: a 0.05-m contaminated zone, and a 0.10-m uncontaminated zone (Figure 1). Controls were prepared with uncontaminated soil only. Three replicates were prepared for each treatment. The final bulk density of the soil was 1.4 Mg m�3. The slabs were initially saturated with water to allow settling of the soil. In each slab, one seed was sown in the centre, i.e. in the uncontaminated zone. Plants were irrigated every second day to maintain water content at around 25% (–3.7 kPa). After 2 weeks in the above-mentioned growth chamber, the slabs were transferred to the NR facility for imaging. At the conclusion of the experiment, the slabs were opened and the root mass was measured directly. For the heterogeneously contaminated soil, the slabs were opened at one side and the soil cut into six segments (0.075 m � 0.05 m), and each individual segment carefully removed. Roots were separated from the soil with a 2-mm mesh sieve. After washing and drying, the biomass of the roots was obtained for each individual segment.
非均匀污染容器由两个竖直条带组成:0.05 m宽的污染区和0.10 m宽的未污染区(图1)。对照仅装填未污染土壤。每个处理设三个重复。土壤最终容重为1.4 Mg m−3。容器首先用水饱和以使土壤沉实。每个容器在中央(即未污染区内)播种一粒种子。植株每两天灌溉一次,使含水量维持在约25%(–3.7 kPa)。在上述人工气候室中生长2周后,将容器转移至NR装置进行成像。试验结束时,打开容器直接测定根系质量。对于非均匀污染土壤,从一侧打开容器,将土壤切分为六个区段(0.075 m × 0.05 m),并逐一小心取出。用2 mm筛网将根系与土壤分离。经清洗和烘干后,测定各区段的根系生物量。
Imaging procedure成像步骤
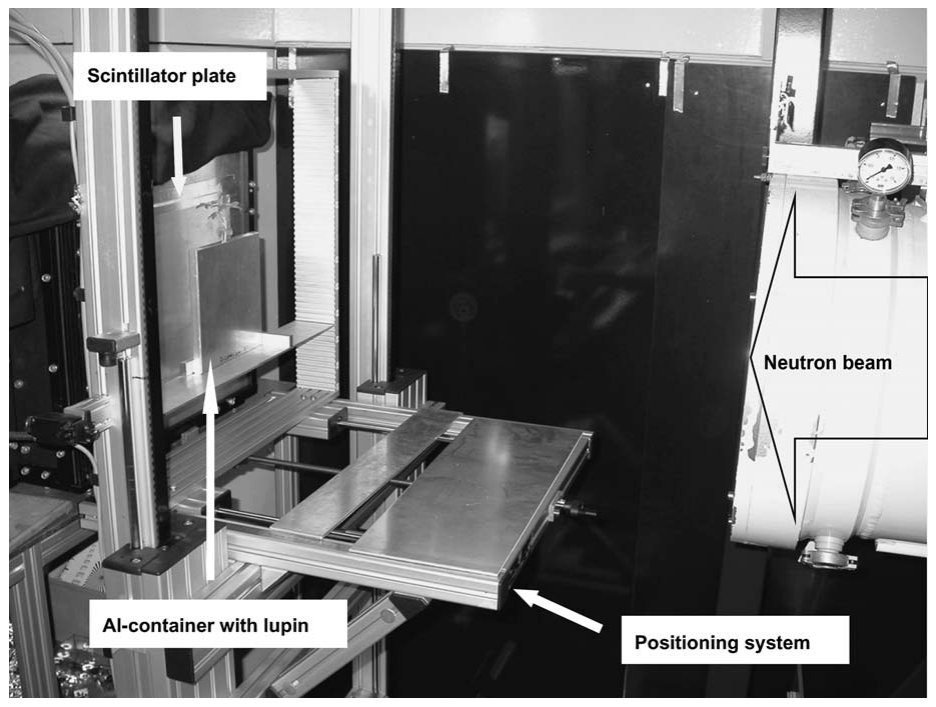
The images were taken at least 2 days after irrigation to decrease the heterogeneity of the water distribution in the slab. This optimized the root-soil contrast at the time when the images were taken, without subjecting the plants to severe water stress. Samples were moved to the NEUTRA imaging system and fixed in the same position each time using a three-dimensional positioning system Figure 2). This consistent placement was important for the comparison of subsequent images.
成像至少在灌溉2天后进行,以降低容器内水分分布的非均匀性。这使成像时的根-土对比度达到最佳,同时又不致使植物遭受严重水分胁迫。样品被移至NEUTRA成像系统,并利用三维定位系统每次固定于相同位置(图2)。这种一致的放置对于后续图像的比较十分重要。
We used exposure times of 60 s and 20 s per image for the sand slabs and soil slabs, respectively. These exposure times gave the best signal-to-noise ratio and allowed the differentiation of the main roots from the porous medium. To correct variations ofthe beamintensityoverthe imagearea,wecollectedopenbeam images without a sample as well as background images, with neither sample nor beam. The neutron radiation dose received by these plants was about 0.003 mSv hour�1, some two orders of magnitude less than the minimum value of 0.2 mSv hour�1 required to affect plant growth (Real et al., 2004).
砂质容器和土壤容器每幅图像的曝光时间分别为60 s和20 s。这些曝光时间可获得最佳信噪比,并能将主根与多孔介质区分开来。为校正成像区域内中子束强度的变化,采集了无样品的开放束图像以及既无样品也无中子束的背景图像。这些植物接受的中子辐射剂量约为0.003 mSv hour−1,比影响植物生长所需的最低剂量0.2 mSv hour−1低约两个数量级(Real et al., 2004)。
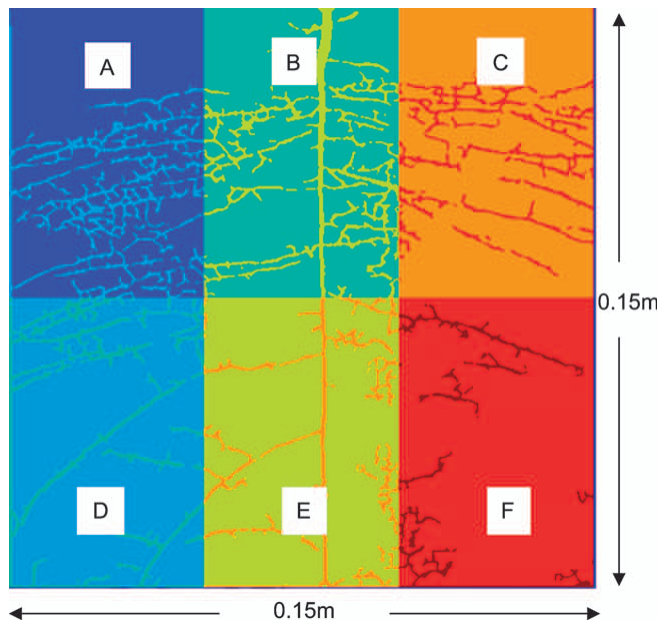
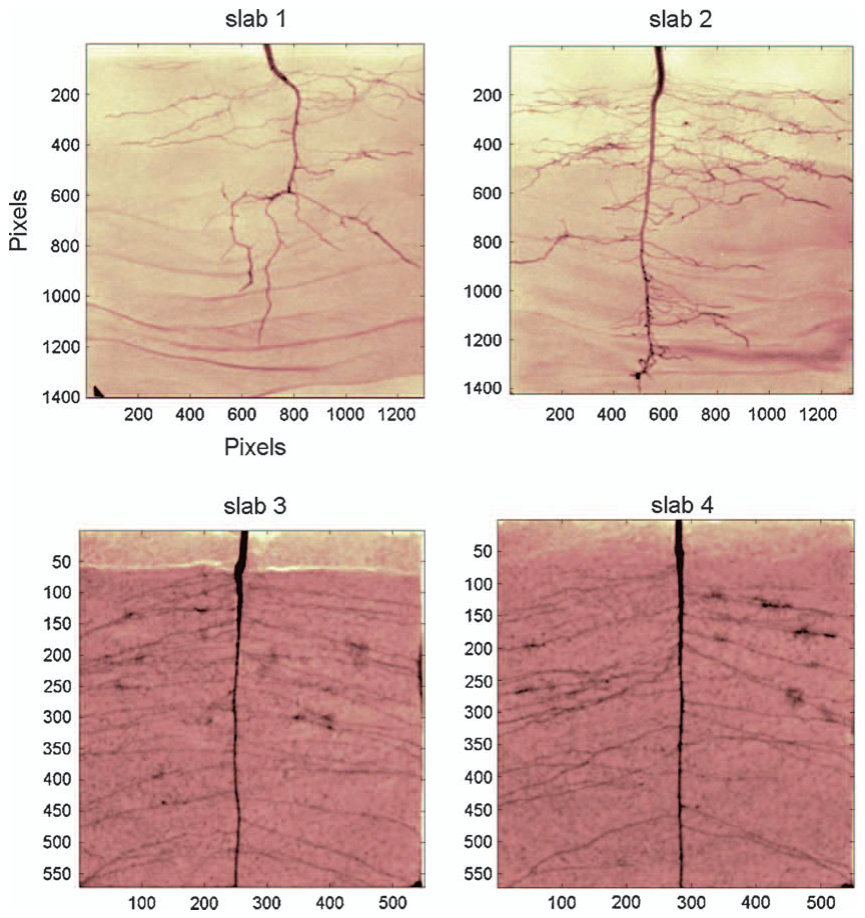
Image analysis图像分析
The radiography images that show the neutron shadow of the sample were first corrected for beam variations and camera noise using a flat field correction:
首先利用平场校正对显示样品中子阴影的成像图进行中子束变化和相机噪声校正:

This operation is done pixel-wise, where Iraw is the image as registered by the camera, Idark is the dark noise image without the beam, and Iopenbeam contains the spatial field variation of the beam without object. A normalization factor, N, is required so that the resulting image data are in the valid dynamic range for a 16-bit TIFF format. This permits the optimal visualization of the data and facilitates quantification. The negative logarithm of the corrected image intensities, I¢, was used to extract the information with Equation (1). The resulting image was analysed further to differentiate roots from surrounding media. This was achieved by segmentation of the root network.
该运算逐像素进行,其中Iraw为相机记录的图像,Idark为无中子束时的暗噪声图像,Iopenbeam包含无物体时中子束的空间场变化。需要一个归一化因子N,使所得图像数据处于16位TIFF格式的有效动态范围内。这有利于数据的最佳可视化并便于定量。利用校正后图像强度I′的负对数,通过式1提取信息。对所得图像作进一步分析,以区分根系与周围介质,这通过对根系网络进行分割来实现。
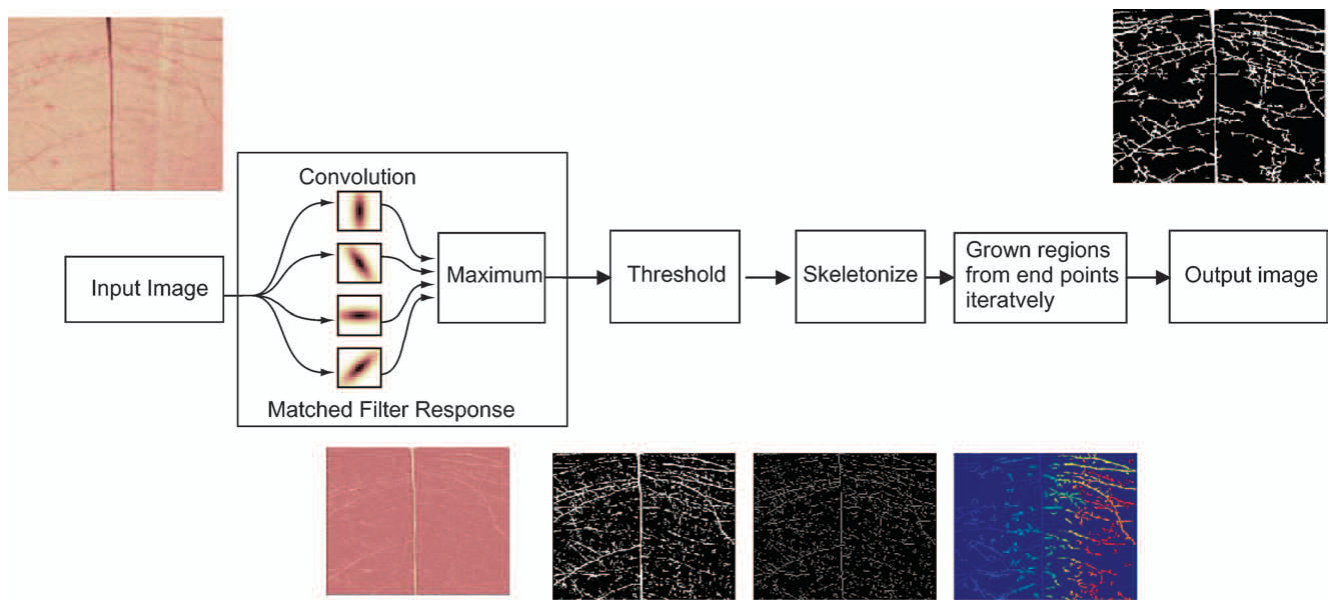
The background grey-level intensity within each image varied so much that a single global threshold could not segment the roots satisfactorily, i.e. the grey-level of roots in one part of the image was the same as the background in another part. Hoover et al. (2000) developed an algorithm for segmenting blood vessels in retinal images that had similar characteristics to ours. Hoover’s segmentation method consists of several steps, as described schematically in Figure 3. The first step is to enhance the root contrast using a matched filter response (MFR) image (Chaudhuri et al., 1989). The MFR image is computed pixel-wise by selecting the maximum response from a set of images filtered by a bank of oriented Gaussian convolution kernels. The intensity variations in the MFR image are flattened. Next, a threshold of between 80% and 97.5% of the pixels in the MFR image are labelled as background. The percentage depends on the size of the root network. This pre-segmented image is then skeletonized with a thinning algorithm (Lam et al., 1992).
各图像内背景灰度强度变化很大,单一的全局阈值无法令人满意地分割根系,即图像某一部分中根系的灰度与另一部分中背景的灰度相同。Hoover et al. (2000)开发了一种用于分割视网膜图像中血管的算法,这类图像具有与本研究图像相似的特征。Hoover分割方法包括若干步骤,示意于图3。第一步是利用匹配滤波响应(MFR)图像增强根系对比度(Chaudhuri et al., 1989)。MFR图像逐像素计算,即从一组经定向高斯卷积核滤波的图像中选取最大响应。MFR图像中的强度变化被平滑。随后设定阈值,将MFR图像中80%至97.5%的像素标记为背景,该百分比取决于根系网络的大小。然后利用细化算法对该预分割图像进行骨架化(Lam et al., 1992)。
The final initialization step before the region-growing iterations is to remove branch points in the skeleton and to identify the end-points. The skeleton end-points are used as seeds for region growing. The region growing acts locally on pieces connected to the end-points, where all pixels with a grey-level greater than the end-point are added to the piece.
区域生长迭代前的最后一个初始化步骤是去除骨架中的分支点并识别端点。骨架端点被用作区域生长的种子。区域生长局部作用于与端点相连的片段,将所有灰度高于该端点的像素加入该片段。
When all pixels for a given level are collected, a number of shape tests are made. When all tests are positive, the threshold level is decremented and a new iteration is started. If, on the other hand, one of the structure tests fails the threshold probing, then the iteration will be terminated. In order to be labelled as a root segment, the piece must not exceed given size criteria. The skeleton end-points of accepted pieces are added to the list of end-points and the main iteration loop is repeated. The end-points of the accepted pieces are added to the list of end-points. The iteration procedure is repeated until there are no end-points left to segment.
当某一给定水平的所有像素收集完毕后,进行若干形状检验。若所有检验均为阳性,则阈值水平递减并开始新一轮迭代。反之,若某一结构检验未通过阈值探测,则终止迭代。片段须不超过给定的尺寸标准,方可被标记为根段。被接受片段的骨架端点被加入端点列表,并重复主迭代循环。被接受片段的端点被加入端点列表。迭代过程重复进行,直至没有剩余待分割的端点。
We calculated root volumes using the Euclidean distance map and the skeleton of the segmented roots. We assumed that a large number of cylinder segments with the radius taken as the distance for each skeleton pixel would approximate to the root volume. The cylinder height was defined as the pixel resolution. The total volume, V (m3), can thus be described as:
利用欧氏距离图和分割后根系的骨架计算根系体积。假设以每个骨架像素的距离值为半径的大量圆柱段可近似代表根系体积,圆柱高度定义为像素分辨率。因此,总体积V(m3)可表示为:

where gDist is the distance map of the segmented image g, gSK is the skeleton of it, the constant k is the side length of a pixel (m), and p represents the pixels of the skeleton. In our investigation, we did not compute the volume for the whole image but rather the six segments of the image, as shown in Figure 4.
式中,gDist为分割图像g的距离图,gSK为其骨架,常数k为像素边长(m),p表示骨架像素。本研究并未计算整幅图像的体积,而是计算了图像中六个区段的体积,如图4所示。
4Results and discussion结果与讨论
Comparison of root growth in quartz sand and soil sand slabs showed thin horizontal bands of greater moisture content, which results from the capillary-barrier effect of thin beds of coarser sand particles underlying beds of finer sand. The roots can be clearly distinguished from these bands by their continuity and orientation (Figure 5a,b).
石英砂与土壤砂质容器中根系生长的比较显示出若干含水量较高的细薄水平条带,这是由于较细砂层下伏较粗砂粒薄层所产生的毛细屏障效应所致。根系可凭借其连续性和走向与这些条带清晰区分(图5a、b)。
Figure 5 shows the NR images of root development in the quartz sand after 17 days and soil slabs after 14 days. The contrast and resolution were excellent, particularly in the sand slabs. The图5显示了石英砂中生长17天后和土壤容器中生长14天后根系发育的NR图像。对比度和分辨率均极佳,尤其是砂质容器。该
The root-soil contrast was less in the slabs filled with soil than in the quartz sand. Nevertheless the roots were sufficiently visible to determine their growth pattern (Figure 5c,d). Roots grew much faster in the soil slabs than in the quartz sand. After 14 days, the tap root and the laterals had reached the edges of the containers filled with soil, whereas in sand this was achieved only after 24 days of growth. Furthermore, tap roots were straighter and longer in the soil than in the sand slabs, where roots were more twisted and shorter. In the soil, the laterals branched off in a more regular pattern, grew thicker and followed a rather straight, slightly oblique directiondownwards,while inthe quartz sand they were more fibrous and spread out. The bulk density of the quartz sand (1.8 Mg m�3) was much greater than the soil (1.4 Mg m�3). This was the likely reason for the reduced root penetration, which resulted in a more-branched root system. Therefore, we conclude that although quartz sand provided better quality images than field soil, its use for studying root growth patterns is limited because it impedes root growth.
装填土壤的容器中根-土对比度低于石英砂。尽管如此,根系仍足够清晰,可以确定其生长格局(图5c、d)。土壤容器中根系生长远快于石英砂。14天后,主根和侧根已到达装填土壤容器的边缘,而在砂中则需生长24天才达到这一程度。此外,土壤中的主根比砂质容器中的更直更长,后者根系更为扭曲且较短。在土壤中,侧根分枝格局更为规则,根系更粗,并沿较直、略微倾斜的方向向下生长;而在石英砂中,侧根则更加纤细且分散。石英砂的容重(1.8 Mg m−3)远高于土壤(1.4 Mg m−3),这很可能是根系穿插能力降低的原因,从而导致根系分枝更多。因此,尽管石英砂提供的图像质量优于田间土壤,但由于其阻碍根系生长,用于研究根系生长格局受到限制。
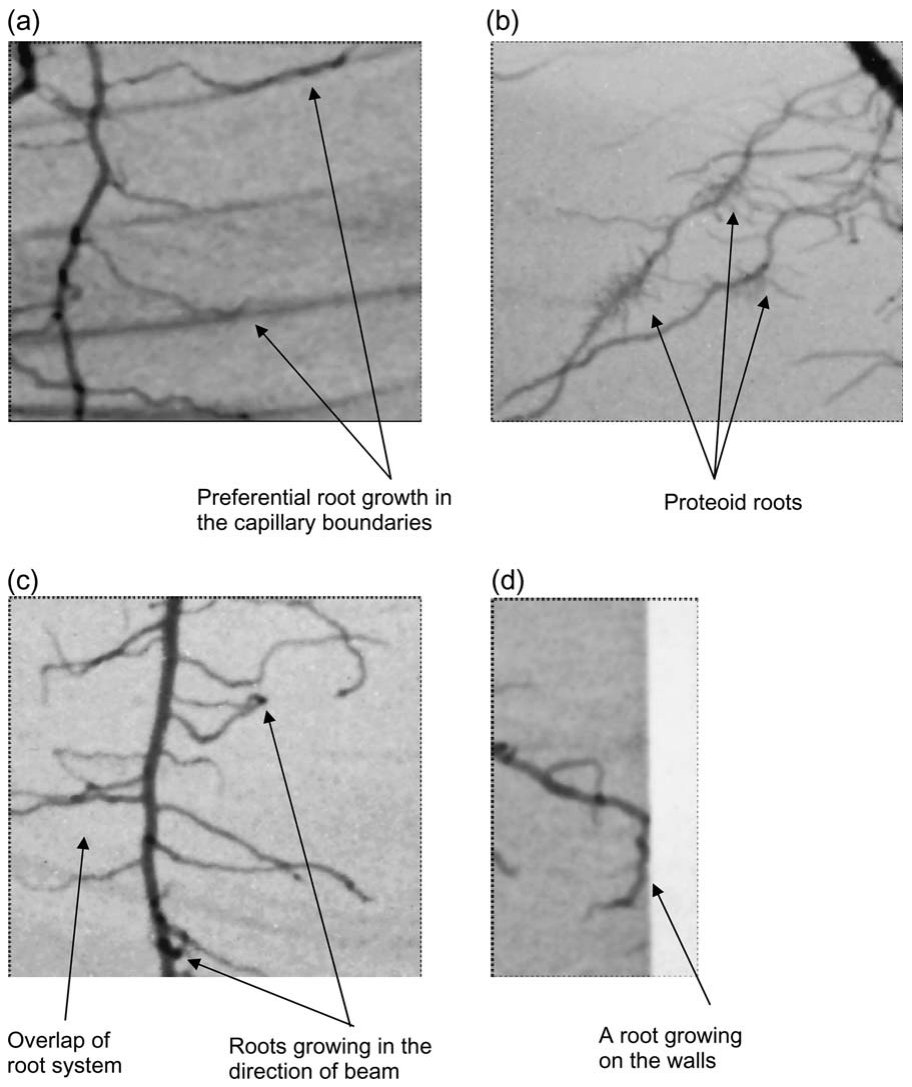
An additional problem with using quartz sand was the separation of the size-fractions when filling. The roots grew preferentially along the bands of fine sand that had relatively greater moisture content (Figure 6a). This shows the potential of NR to monitor variations in the distribution of soil moisture simultaneously with root growth, but creates an extra complication when investigating other phenomena.
使用石英砂的另一个问题是装填时不同粒级的分离。根系沿含水量相对较高的细砂条带优先生长(图6a)。这表明NR具有在监测根系生长的同时监测土壤水分分布变化的潜力,但在研究其他现象时会带来额外的复杂性。
The development of proteoid roots was another feature recognizable in many images (enlarged in Figure 6b). This was observed in both quartz sand and soil slabs, but with poorer resolution in the latter. Proteoid roots, also called cluster roots, are stout bottle-brush-like clusters of rootlets. They arise from the pericycle opposite the protoxylem poles along the lateral roots in many plant families (Neumann & Martinoia, 2002).
排根的发育是许多图像中可识别的另一特征(图6b中放大显示)。在石英砂和土壤容器中均观察到这一现象,但后者的分辨率较差。排根又称簇生根,是粗壮的、形似瓶刷的细根簇。在许多植物科中,排根起源于侧根上与原生木质部极相对的中柱鞘(Neumann & Martinoia, 2002)。
The visibility of roots in NR images depends on their orientation. Roots that grow in the direction of the beam only appear as darker pixels (Figure 6c), because the beam in transmission has a greater amount of water to penetrate and is thus attenuated more strongly. Similarly, darker spots occur where two roots overlap or cross each other. The images demonstrate that the thickness of the porous medium was sufficient to allow growth in all directions. There was enough space for lateral roots to cross each other.
根系在NR图像中的可见性取决于其走向。沿中子束方向生长的根系仅表现为较暗的像素(图6c),因为透射的中子束需穿透更多的水,因而衰减更强。同样,两条根系重叠或交叉处也会出现较暗的斑点。图像表明,多孔介质的厚度足以允许根系向各个方向生长,侧根有足够的空间相互交叉。
The images further show how roots react when they reach container walls and at about what time this occurred. After 4 weeks only a few roots had just reached the walls, while a few days later the development of the root system was strongly influenced by this space limitation (Figure 6d). This limitation is a principle problem in pot experiments, as roots start to coil around the walls of the containers within a short time. NR allows us to monitor the distance of root tips to the container wall and to determine when they reach the walls. This may provide valuable information for planning and interpretation of pot experiments.
图像还显示了根系到达容器壁时的反应以及大致发生的时间。4周后仅有少数根系刚刚到达容器壁,而数天后根系发育即受到这一空间限制的强烈影响(图6d)。这种限制是盆栽试验中的一个基本问题,因为根系在短时间内便开始沿容器壁盘绕。NR使我们能够监测根尖与容器壁之间的距离,并确定根系到达容器壁的时间。这可为盆栽试验的设计和结果解释提供有价值的信息。
Root growth under B and Zn contaminationB和Zn污染下的根系生长
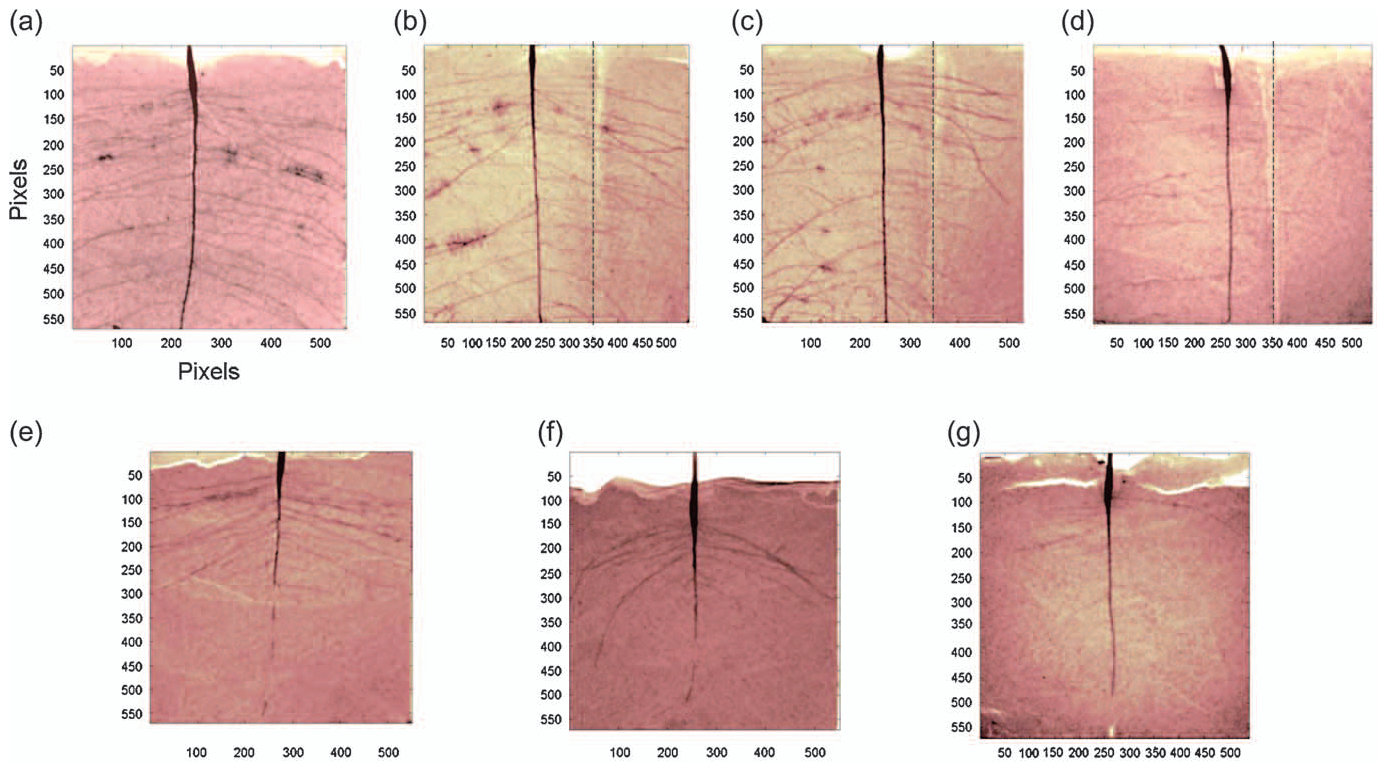
The spatial distribution of B and Zn affected lupin root growth. Figure 7 shows the clearest images obtained for all treatments. Significantly fewer roots were produced in homogeneously contaminated slabs compared with the control slabs (Figure 7a). In the heterogeneously contaminated slabs, lateral roots initially grew into the contaminated zone. However, as the plants developed root growth was inhibited in the contaminated zone (Figure 7b,c,d). This trend occurred in all heterogeneously contaminated slabs.
B和Zn的空间分布影响了羽扇豆根系生长。图7展示了各处理所获得的最清晰图像。与对照容器相比,均匀污染容器中产生的根系显著减少(图7a)。在非均匀污染容器中,侧根最初向污染区内生长。然而,随着植株发育,污染区内的根系生长受到抑制(图7b、c、d)。所有非均匀污染容器均呈现这一趋势。
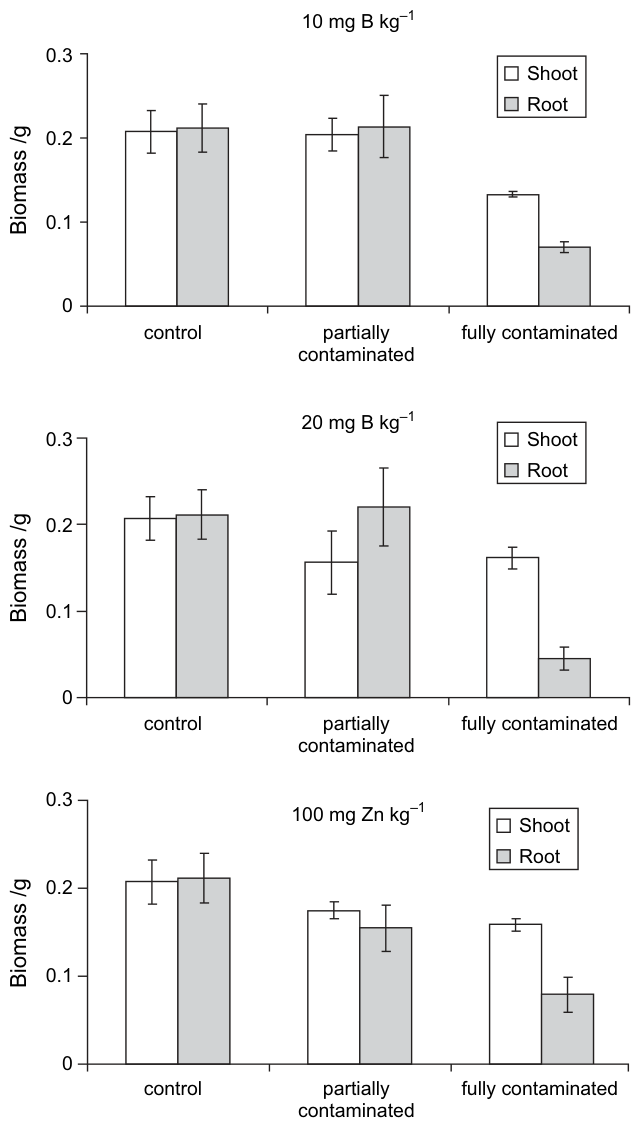
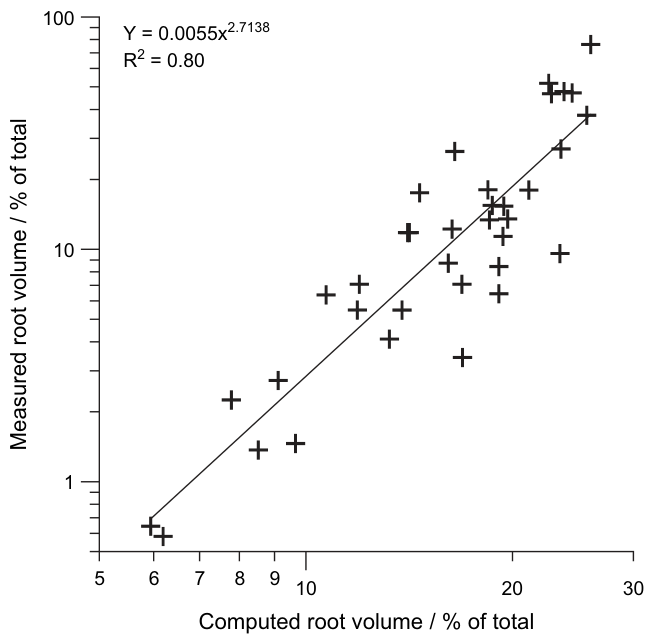
A significant reduction in dry shoot and root biomass was observed in all homogeneously contaminated slabs compared with both control and heterogeneously contaminated soils for both B and Zn treatments. In the Zn treatments, shoot and root weights were significantly reduced in the heterogeneously contaminated slabs (Figure 8). The percentage of roots (ratio of root weight in each segment to the total root weight) was significantly reduced in all contaminated portions of these slabs (Table 1). The smallest percentage of roots was observed in the lower part of the contaminated zones (‘F’ zone in Table 1). Computed root volumes from the heterogeneously contaminated slabs were related logarithmically to the measured percentage of roots (Figure 9). However, at values above 1% of the total root volume, this relation could be approximated by a linear regression. The systematic error at smaller root volumes is the result of the algorithm overestimating roots with a diameter less than three pixels (450 mm). Such errors will be reduced as improvements in measurement technology allow a picture of the root at finer resolution.
在B和Zn处理中,与对照土壤和非均匀污染土壤相比,所有均匀污染容器中地上部和根系的干生物量均显著降低。在Zn处理中,非均匀污染容器中地上部和根系重量显著降低(图8)。这些容器中所有污染部分的根系百分比(各区段根重占总根重的比例)均显著降低(表1)。根系百分比最低值出现在污染区的下部(表1中的“F”区)。非均匀污染容器中计算得到的根系体积与实测根系百分比呈对数关系(图9)。然而,当根系体积超过总根系体积的1%时,该关系可用线性回归近似。根系体积较小时存在的系统误差源于算法高估了直径小于三个像素(450 μm)的根系。随着测量技术的改进能够以更高分辨率获取根系图像,此类误差将会减小。
5Conclusions结论
Neutron radiography is an effective tool for the non-destructive investigation of root growth. Although sand provided better contrast of roots than real soil, the root growth was significantly perturbed. Root growth in soil gave sufficient contrast to elucidate the decreased growth in the zones contaminated with B or Zn. Testing new materials under different conditions combined with new image processing techniques will doubtless lead to improved image contrast.
中子成像是非破坏性研究根系生长的有效工具。尽管砂中根系的对比度优于真实土壤,但根系生长受到显著干扰。土壤中根系生长的对比度足以阐明B或Zn污染区内生长的减少。在不同条件下测试新材料并结合新的图像处理技术,必将提高图像对比度。
| Conce con 1污染区段 中B和Zn 1 | ntration of B and Z taminated segment 1的浓度 1 | n in the zones 1 1 | |
|---|---|---|---|
| Segments | 10 mg B kg� | 20 mg B kg� | 100 mg Zn kg� |
| A | 12.84�1.72* | 10.96�3.58 | 15.67�13.56 |
| B | 52.48�11.57 | 48.78�1.46 | 41.18�15.13 |
| C | 7.43�1.96 | 10.74�1.89 | 6.88�5.45 |
| D | 15.03�6.63 | 17.90�5.58 | 20.24�4.22 |
| E | 9.93�4.15 | 10.36�1.46 | 15.50�7.88 |
| F | 1.85�0.43 | 1.15�0.54 | 0.50�0.50 |
*Standard error; n ¼ 3.
6Acknowledgements致谢
This study was funded by the Swiss National Science Foundation. We highly appreciate the technical support from Mr H. Laeser of the Institute of Terrestrial Ecology, ETH, and Mr P. Vontobel and Mr S. Hartmann of the Paul Scherrer Institute.
本研究由瑞士国家科学基金会资助。衷心感谢ETH陆地生态研究所H. Laeser先生以及保罗·谢勒研究所P. Vontobel先生和S. Hartmann先生提供的技术支持。
7References参考文献
Breckle, S.W. 1991. Growth under stress: heavy metals. In: Plant Roots: the Hidden Half (eds Y. Waisel, A. Eshel & U. Kafkafi), pp. 351–373. Marcel Dekker, New York.
Breckle, S.W. & Kahle, H. 1992. Effects of toxic heavy-metals (Cd, Pb) on growth and mineral nutrition of beech (Fagus sylvatica L.). Vegetatio, 101, 43–53.
Chaudhuri, S., Chatterjee, S., Katz, N., Nelson, M. & Goldbaum, M. 1989. Detection of blood vessels in retinal images using two-dimensional matched filters. IEEE Transactions on Medical Imaging, 8, 263–269.
Couchat, P., Moutonnet, P., Houelle, M. & Picard, D. 1980. In situ study of corn seedling root and shoot growth by neutron radiography. Agronomy Journal, 72, 321–324.
Dickinson, N.M., Turner, A.P. & Lepp, N.W. 1991. Survival of trees in a metal-contaminated environment. Water, Air and Soil Pollution, 57, 627–633.
Furukawa, J., Nakanishi, T.M. & Matsubayashi, H. 1999. Neutron radiography of a root growing in soil with vanadium. Nuclear Instruments and Methods in Physics Research. Section A: Accelerators, Spectrometers, Detectors and Associated Equipment, 424, 116–121.
Gregory, P.J., Hutchison, D.J., Read, D.B., Jenneson, P.M., Gilboy, W.B. & Morton, E.J. 2003. Non-invasive imaging of roots with high resolution X-ray micro-tomography. Plant and Soil, 255, 351–359.
Hoover, A., Kouznetsova, V. & Goldbaum, M. 2000. Locating blood vessels in retinal images by piecewise threshold probing of a matched filter response. IEEE Transactions on Medical Imaging, 19, 203–210.
Kasperl, S. & Vontobel, P. 2005. Application of an iterative artefact reduction method to neutron tomography. Nuclear Instruments and Methods in Physics Research. Section A: Accelerators, Spectrometers, Detectors and Associated Equipment, 542, 392–398.
Lam, L., Lee, S.W. & Suen, C.Y. 1992. Thinning methodologies: a comprehensive survey. IEEE Transactions on Pattern Analysis and Machine Intelligence, 14, 869–885.
Lehmann, E.H., Vontobel, P. & Wiezel, L. 2001. Properties of the radiography facility NEUTRA at SINQ and its potential for use as a European reference facility. In: Proceedings of Sixth World Conference on Neutron Radiography, Osaka, Japan (eds S. Fujine, H. Kobayashi & J.P. Barton), p. 151. Gordon & Breach Science Publishers, USA.
Majdi, H. 1996. Root sampling methods: applications and limitations of the minirhizotron technique. Plant and Soil, 185, 255–258.
Neumann, G. & Martinoia, E. 2002. Cluster roots: an underground adaptation for survival in extreme environments. Trends in Plant Science, 7, 162–167.
Pierret, A., Kirby, M. & Moran, C. 2003. Simultaneous X-ray imaging of plant root growth and water uptake in thin-slab systems. Plant and Soil, 255, 361–373.
Real, A., Sundell-Bergman, S., Knowles, J.F., Woodhead, D.S. & Zinger, I. 2004. Effects of ionising radiation exposure on plants, fish and mammals: relevant data for environmental radiation protection. Journal of Radiological Protection, 24, A123–A137.
Schwartz, C., Morel, J.L., Saumier, S., Whiting, S.N. & Baker, A.J.M. 1999. Root development of the zinc-hyperaccumulator plant Thlaspi caerulescens as affected by metal origin, content and localisation in soil. Plant and Soil, 208, 103–115.
Whiting, S.N., Leake, J.R., McGrath, S.P. & Baker, A.J.M. 2000. Positive responses to Zn and Cd by roots of the Zn and Cd hyperaccumulator Thlaspi caerulescens. New Phytologist, 145, 199–210.
Willatt, S.T. & Struss, R.G. 1978. Germination and early growth of plants studied using neutron radiography. Annals of Botany, 43, 415–422.
Willatt, S.T., Struss, R.G. & Taylor, H.M. 1978. In situ root studies using neutron radiography. Agronomy Journal, 70, 581–586.