REGULAR ARTICLE
A. B. Moradi & S. E. Oswald & J. A. Nordmeyer-Massner & K. P. Pruessmann & B. H. Robinson & R. Schulin
Received: 8 April 2009 /Accepted: 11 July 2009 /Published online: 25 July 2009 # Springer Science + Business Media B.V. 2009
Abstract Investigations of soil-root interactions are hampered by the difficult experimental accessibility of the rhizosphere. Here we show the potential of Magnetic Resonance Imaging (MRI) as a non-destructive measurement technique in combination with numerical modelling to study the dynamics of the spatial distribution of dissolved nickel (Ni2+) around the roots of the
摘要 由于根际在实验上难以观测,土壤–根系相互作用的研究受到制约。本文展示了磁共振成像(MRI)作为一种无损测量技术,结合数值模拟,用于研究溶解态镍(Ni2+)在以下植物根系周围空间分布动态的潜力:
Responsible Editor: Henk Schat.
A. B. Moradi (*) : B. H. Robinson : R. Schulin Soil Protection group, Institute of Terrestrial Ecosystems, ETH Zurich, CHN F28.2, Universitaetstrasse 16, CH-8092 Zurich, Switzerland e-mail: ahmad.moradi@env.ethz.ch S. E. Oswald Hydrogeology Department, Helmholtz Centre for Environmental Research—UFZ, Permoserstraße 15, 04318 Leipzig, Germany
J. A. Nordmeyer-Massner : K. P. Pruessmann Institute for Biomedical Engineering, University and ETH Zurich, Zurich, Switzerland Present Address: A. B. Moradi Hydrogeology Department, Helmholtz Centre for Environmental Research—UFZ, Permoserstraße 15, 04318 Leipzig, Germany e-mail: ahmad.moradi@ufz.de URL: http://www.ufz.de/index.php?de=17424 nickel hyperaccumulator plant Berkheya coddii. Special rhizoboxes were used in which a root monolayer had been grown, separated from an adjacent inert glass bead packing by a nylon membrane. After applying a Ni2+ solution of 10 mg l−1, the rhizobox was imaged repeatedly using MRI. The obtained temporal sequence of 2-dimensional Ni2+ maps in the vicinity of the roots showed that Ni2+ concentrations increased towards the root plane, revealing an accumulation pattern. Numerical modelling supported the Ni2+ distributions to result from advective water flow towards the root plane, driven by transpiration, and diffusion of Ni2+ tending to eliminate the concentration gradient. With the model, we could study how the accumulation pattern of Ni2+ in the root zone transforms into a depletion pattern depending on transpiration rate, solute uptake rate, and Ni2+ concentration in solution.
J. A. Nordmeyer-Massner : K. P. Pruessmann Institute for Biomedical Engineering, University and ETH Zurich, Zurich, Switzerland 现地址:A. B. Moradi Hydrogeology Department, Helmholtz Centre for Environmental Research—UFZ, Permoserstraße 15, 04318 Leipzig, Germany e-mail: ahmad.moradi@ufz.de URL: http://www.ufz.de/index.php?de=17424 镍超富集植物 Berkheya coddii。研究采用特制根箱,其中培育出单层根系,并以尼龙膜将其与相邻的惰性玻璃珠填充层隔开。施加10 mg l−1的Ni2+溶液后,利用MRI对根箱进行重复成像。所获得的根系附近二维Ni2+分布图时间序列显示,Ni2+浓度向根平面方向升高,呈现出累积格局。数值模拟结果支持以下解释:Ni2+的分布源于蒸腾驱动的、流向根平面的对流水流,以及趋于消除浓度梯度的Ni2+扩散。借助该模型,我们研究了根区Ni2+的累积格局如何随蒸腾速率、溶质吸收速率和溶液中Ni2+浓度的变化而转变为亏缺格局。
Keywords Berkheya coddii . Concentration gradient . Hyperaccumulator. Magnetic resonance imaging . MIN3P. Modelling . Nickel . Uptake
关键词 Berkheya coddii;浓度梯度;超富集植物;磁共振成像;MIN3P;模拟;镍;吸收
1Introduction引言
The focus of rhizosphere studies has recently been opened to the fate of soil pollutants such as heavy metals as a consequence of increasing awareness of soil pollution problems and the attempts to control the pollutants and to remediate contaminated soils (Wenzel 2005). Nickel is a heavy metal of concern in soil that can be of geogenic origin, as in serpentine soils (Robinson et al. 1999), or may arise from anthropogenic pollution (Brooks 1998; Ashworth and Alloway 2004). Nickel hyperaccumulator plants growing on serpentine soils are able to accumulate at least ten times more nickel than other plant species growing in the same environment (Brooks et al. 1977). Therefore, some hyperaccumulator plants may offer a sustainable treatment option for the remediation of metal-contaminated sites, and an opportunity to mine naturally metal-rich soils by phytomining (Brooks et al. 1998; Li et al. 2003). An attractive plant for phytoextraction of Ni is Berkheya coddii Roessler. Its extraordinary phytoextraction potential results from the rare combination of high biomass (22 t ha−1), and high capacity of Ni accumulation in its above-ground biomass which can reach up to 1% w:w (Robinson et al. 1997). Despite this, little is known about the mechanism of Ni hyperaccumulation and root-soil interactions of Ni hyperaccumulator plants including Berkheya coddii. Understanding these mechanisms and interactions could help improving methods for the phytoextraction of Ni from contaminated soils and also phytomining (McNear et al. 2005).
随着人们对土壤污染问题认识的不断提高,以及控制污染物和修复污染土壤的努力(Wenzel 2005),根际研究的关注点近来已扩展至重金属等土壤污染物的归趋。镍是土壤中受到关注的一种重金属,既可来源于地质成因,如超基性(蛇纹岩)土壤(Robinson et al. 1999),也可能来自人为污染(Brooks 1998; Ashworth and Alloway 2004)。生长在超基性(蛇纹岩)土壤上的镍超富集植物所积累的镍,至少是同一环境中其他植物物种的十倍(Brooks et al. 1977)。因此,某些超富集植物可为金属污染场地的修复提供一种可持续的处理方案,并为通过植物采矿开采天然富含金属的土壤提供机会(Brooks et al. 1998; Li et al. 2003)。Berkheya coddii Roessler是一种极具吸引力的镍植物提取植物。其非凡的植物提取潜力源于高生物量(22 t ha−1)与地上部生物量中高镍积累能力(可高达1% w:w)这一罕见组合(Robinson et al. 1997)。尽管如此,人们对镍超富集的机制以及包括Berkheya coddii在内的镍超富集植物的根–土相互作用仍知之甚少。认识这些机制和相互作用有助于改进从污染土壤中植物提取镍的方法以及植物采矿技术(McNear et al. 2005)。
However, investigating root-soil interactions such as the uptake of metals by roots is challenging. It requires a high-resolution data on the spatial distribution of solutes because these processes create substantial differences in concentrations over distances of a few millimetres from root surfaces. Many rhizosphere processes are dynamic (Darrah 1993; Gregory and Hinsinger 1999; Wenzel et al. 2001; Hinsinger et al. 2006), therefore a non-destructive, non-invasive method to observe rhizosphere processes resolved in space and time is desirable.
然而,研究根系对金属的吸收等根–土相互作用颇具挑战性。这需要高分辨率的溶质空间分布数据,因为这些过程会在距根表面数毫米的范围内造成显著的浓度差异。许多根际过程是动态的(Darrah 1993; Gregory and Hinsinger 1999; Wenzel et al. 2001; Hinsinger et al. 2006),因此需要一种能够在空间和时间上分辨根际过程的无损、非侵入性观测方法。
The uptake of trace metals, such as nickel, by roots, is generally considered to occur through more or less specific membrane transporters (Zhao et al. 2002; Whiting et al. 2003). If a metal is removed by roots from the rhizosphere more rapidly than it can be resupplied, by bulk soil via desorption and diffusion, the metal will become depleted adjacent to the root surface (Tinker and Nye 2000). In contrast, if the mass flow of a solute from the bulk soil towards the roots exceeds the uptake rate of the solute, then a concentration gradient opposing the advection flux will develop. The resulting concentration profiles are further influenced by chemical reactions with other compounds in the rhizosphere and with the soil matrix. Although these processes in rhizosphere have been discovered earlier, but due to technical limitations, they have never been observed in situ with sufficient temporal and spatial resolution. Combining new non-destructive measurement techniques such as MRI and numerical simulations can unravel some aspects of these complex interactions.
一般认为,根系对镍等痕量金属的吸收是通过或多或少具有特异性的膜转运蛋白进行的(Zhao et al. 2002; Whiting et al. 2003)。如果根系从根际移除金属的速率快于土体通过解吸和扩散对其进行补给的速率,则根表面附近的该金属将发生亏缺(Tinker and Nye 2000)。相反,如果溶质从土体向根系的质流超过该溶质的吸收速率,则会形成与对流通量方向相反的浓度梯度。由此产生的浓度剖面还会进一步受到根际中与其他化合物以及与土壤基质之间化学反应的影响。尽管根际中的这些过程早已被发现,但受技术条件限制,从未以足够的时间和空间分辨率进行原位观测。将MRI等新型无损测量技术与数值模拟相结合,可以揭示这些复杂相互作用的某些方面。
Among other new techniques, Magnetic Resonance Imaging (MRI) has been proposed to assess the spatial distribution of water and metal ions in porous media (Herrmann et al. 2002; Pierret et al. 2003; Moradi et al. 2008). The presence of paramagnetic ions and molecules in a solution affects the spin vector relaxation times (longitudinal relaxation time T1 and transverse relaxation time T2) of water protons (1H). The determination of these relaxation times provides opportunities to trace the movement and diffusion of dissolved paramagnetic compounds and ions such as Ni2+ in the porous media. However, applying MRI to soil-plant system has several limitations. The presence of ferromagnetic particles and other paramagnetic compounds in soils can distort the MRI images and cause signal loss. Therefore, at the present state, this technique mainly is applied to carefully selected media such as pretreated sand and soil, agar, and glass beads.
在各种新技术中,磁共振成像(MRI)已被提出用于评估多孔介质中水分和金属离子的空间分布(Herrmann et al. 2002; Pierret et al. 2003; Moradi et al. 2008)。溶液中顺磁性离子和分子的存在会影响水质子(1H)的自旋矢量弛豫时间(纵向弛豫时间T1和横向弛豫时间T2)。测定这些弛豫时间为追踪多孔介质中溶解态顺磁性化合物及Ni2+等离子的运移和扩散提供了可能。然而,将MRI应用于土壤–植物系统存在若干局限。土壤中铁磁性颗粒和其他顺磁性化合物的存在会使MRI图像失真并造成信号损失。因此,就目前而言,该技术主要应用于经过精心选择的介质,如经预处理的砂和土壤、琼脂以及玻璃珠。
In a previous study we developed a MRI method to study the temporal and spatial distribution of dissolved Ni2+ ions in a porous medium under the influence of absorption by an exchange resin (Moradi et al. 2008). Here we showed that MRI can detect concentration profiles and thus can be used to investigate Ni2+ uptake by hyperaccumulator plants in a more complex system. We studied the two-dimensional spatial and temporal distribution of Ni2+ from a planar monolayer mat of roots of the hyperaccumulator plant Berkheya coddii. We also used numerical modelling to interpret the measurements and to analyse the dependence of the Ni2+ gradient adjacent to the roots on transpiration rate, uptake rate and initial concentration of Ni2+.
在先前的研究中,我们建立了一种MRI方法,用于研究交换树脂吸附作用下多孔介质中溶解态Ni2+离子的时空分布(Moradi et al. 2008)。本文表明,MRI能够检测浓度剖面,因而可用于在更为复杂的系统中研究超富集植物对Ni2+的吸收。我们研究了超富集植物Berkheya coddii平面单层根垫周围Ni2+的二维时空分布,并利用数值模拟解释测量结果,分析根系附近Ni2+梯度对蒸腾速率、吸收速率和Ni2+初始浓度的依赖关系。
2Materials and methods材料与方法
3Rhizobox setup and plant growth根箱装置与植物培养
The rhizoboxes (inner dimensions, 100×100× 30 mm) used in this study (Fig. 1) were a modified version of the rhizobox system developed and tested by Wenzel et al. (2001). We changed the frame of the rhizobox so that the MRI receiver coils could be installed close to the root plane on the transparent side of the rhizobox (an acrylic window for root visualization and root growth control) to obtain maximal coil sensitivity in the volume of interest. We sealed the rhizoboxes using rubber bands and silicon glue. The experiment started from fully water-saturated condition, which gave the strongest MRI signal-to-noise ratio (SNR). We also redesigned the inlet and outlet ports and increased their number to 30 per box, arranged on one side of the box in five rows of six ports each, in order to improve the regulation of the nutrient solution in the main compartment of the rhizobox.
本研究所用根箱(内部尺寸100×100× 30 mm)(图1)是在Wenzel et al. (2001)开发并测试的根箱系统基础上改进而成的。我们改造了根箱框架,使MRI接收线圈能够安装在根箱透明一侧(用于观察根系和控制根系生长的丙烯酸窗口)靠近根平面的位置,从而在目标区域内获得最大线圈灵敏度。根箱采用橡皮筋和硅胶密封。实验从完全水饱和状态开始,此时MRI信噪比(SNR)最高。我们还重新设计了进水口和出水口,并将其数量增加至每箱30个,分五排、每排六个布置在根箱一侧,以改善根箱主隔室内营养液的调控。
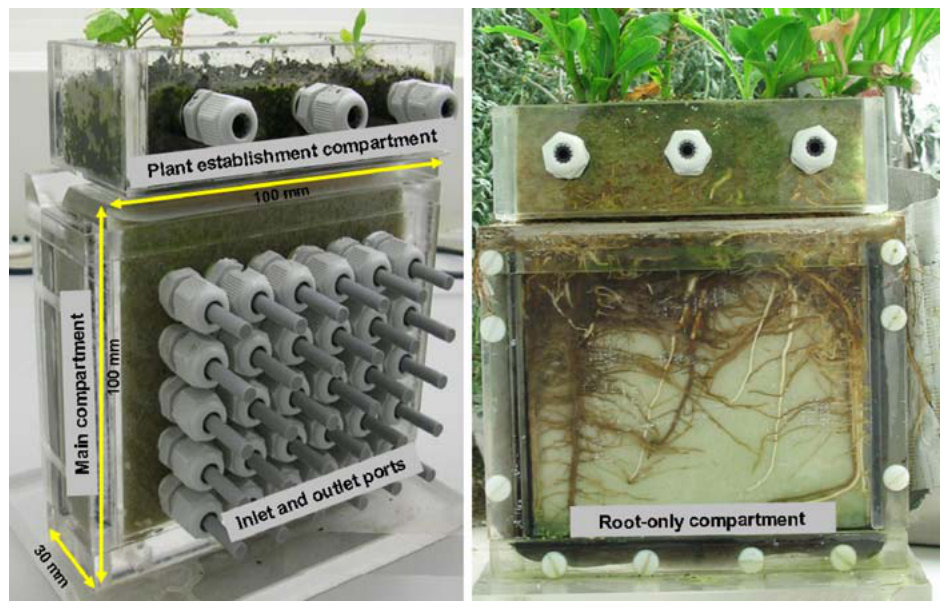
Seeds of Berkheya coddii were pre-germinated in perlite and grown until they were 2 weeks old. The seedlings were transferred to the upper compartment of the rhizoboxes. The main and the upper compartments of each rhizobox were filled with porous glass beads (Sera Werke, Germany) of 0.4–1.0 mm-diameter. The total porosity of the packing was 65% v/v, and the bulk density was 0.46 g cm−3. Four rhizoboxes were prepared in total and four seedlings were planted per rhizobox. After transplanting, the rhizoboxes were kept for 8 weeks in a climate chamber with a daily light cycle (1.0–1.2 lumen cm−3) of 16 h light/ 8 h darkness, constant humidity (75%) and controlled temperature (23/16°C day/night). The rhizoboxes were irrigated with nutrient solution (Kraemer et al. 1996). A peristaltic pump was used to circulate the nutrient solution through the rhizoboxes at a rate of around 0.6 l per day. The lower two rows of the ports were used as inlets for the nutrient solution and the ports of the uppermost row were used as outlets. Roots started to grow into the root-only compartment a week after transplanting. The root-only compartment contained no glass beads or soil. It consisted of a narrow slit separated from the glass beads by a nylon membrane with a mesh size of 20 µm. After 8 weeks of growth, one of the rhizoboxes that showed the most uniform root plane was chosen and the MRI experiments were performed on this rhizobox.
Berkheya coddii种子在珍珠岩中预萌发并培养至2周龄,随后将幼苗移栽至根箱的上隔室。各根箱的主隔室和上隔室均填充直径0.4–1.0 mm的多孔玻璃珠(Sera Werke,德国)。填充层总孔隙度为65% v/v,容重为0.46 g cm−3。共制备4个根箱,每个根箱种植4株幼苗。移栽后,根箱在人工气候室中放置8周,光照周期为16 h光照/8 h黑暗(1.0–1.2 lumen cm−3),湿度恒定(75%),温度受控(昼/夜23/16°C)。根箱以营养液灌溉(Kraemer et al. 1996),并采用蠕动泵使营养液以每天约0.6 l的速率在根箱中循环。下方两排端口用作营养液进口,最上一排端口用作出口。移栽一周后,根系开始长入纯根隔室。纯根隔室内不含玻璃珠或土壤,由一条狭缝构成,并以孔径20 µm的尼龙膜与玻璃珠隔开。生长8周后,选取根平面最为均匀的一个根箱进行MRI实验。
4MRI technique and data analysisMRI技术与数据分析
MRI was performed using a Philips Intera wholebody system (Philips medical systems, Best, the Netherlands) with a static magnetic field of 1.5 Tesla that results in a proton resonance frequency of 63.8 MHz. We used a T1 mapping technique known as variable flip angle for the quantification of T1 (Deoni et al. 2003; Treier et al. 2007). This method calculates T1 with the same accuracy but with a significantly shorter acquisition time than standard T1 measurement sequences. It is based on the consecutive application of T1-weighted spoiled gradient-echo (T1 fast-field echo) sequences using different flip angles. The steady state signal achieved for a sequence using phase alternated radio-frequency (RF) pulses can be calculated using Eq. 1:
MRI采用Philips Intera全身成像系统(Philips medical systems, Best, the Netherlands),静磁场强度为1.5 Tesla,对应质子共振频率为63.8 MHz。我们采用一种称为可变翻转角法的T1成像技术对T1进行定量(Deoni et al. 2003; Treier et al. 2007)。该方法计算T1的精度与标准T1测量序列相同,但采集时间显著缩短。其原理是以不同翻转角连续施加T1加权扰相梯度回波(T1快速场回波)序列。采用相位交替射频(RF)脉冲的序列所达到的稳态信号可由式1计算:
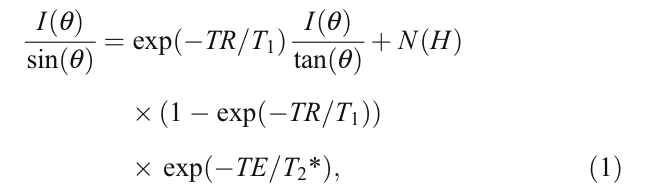
where I is the signal intensity, N(H) is the proton density, θ is the RF pulse flip angle, TE is the echo time, and T2* is the effective transverse relaxation time. According to Eq. 1, a plot of IðqÞ=sinðqÞ vs: IðqÞ=tanðqÞ should yield a straight line with slope exp(−TR/T1). Since this slope depends only on TR, the known repetition time, one can calculate T1 without prior knowledge of N(H) or T2*. The effect of transverse relaxation was considered negligible for a fairly short echo times. We used an echo time of 4.5 ms, a repetition time of 9 ms, slice thickness of 15 mm, a data matrix of 512×512 pixels, and a field of view of 110×110 mm. The acquisition bandwidth was 564.10 Hz. For T1 calculation, we cropped the image part related to the rhizobox in the middle of the original MRI matrix, therefore the images shown here are only the cross-sections of the rhizobox. We fitted the Eq. 1 to the MRI data for different flip angles and calculated the T1 for each pixel. Due to the limited spatial sensitivity of the receiver coil, the SNR deteriorated on the two sides of the rhizobox due to the higher distance from the coil centre. To avoid measurement errors due to partial volume effects we excluded a margin of 5 mm width from the two sides of the MRI images for further analysis (Fig. 3b). A median filter with dimensions of 3×3 pixels was applied to the T1 images to reduce noise. All the images were processed using Matlab.
式中,I为信号强度,N(H)为质子密度,θ为RF脉冲翻转角,TE为回波时间,T2*为有效横向弛豫时间。根据式1,以I(θ)/sin(θ)对I(θ)/tan(θ)作图应得到一条斜率为exp(−TR/T1)的直线。由于该斜率仅取决于已知的重复时间TR,因此无需预先知道N(H)或T2*即可计算T1。对于较短的回波时间,横向弛豫的影响可忽略不计。我们采用的回波时间为4.5 ms,重复时间为9 ms,层厚15 mm,数据矩阵512×512像素,视野110×110 mm,采集带宽为564.10 Hz。为计算T1,我们从原始MRI矩阵中部裁取与根箱相关的图像部分,因此本文所示图像仅为根箱的截面。将式1拟合至不同翻转角下的MRI数据,计算每个像素的T1。由于接收线圈的空间灵敏度有限,根箱两侧因距线圈中心较远而SNR下降。为避免部分容积效应引起的测量误差,在后续分析中剔除了MRI图像两侧宽5 mm的边缘区域(图3b)。对T1图像施加3×3像素的中值滤波以降低噪声。所有图像均使用Matlab处理。
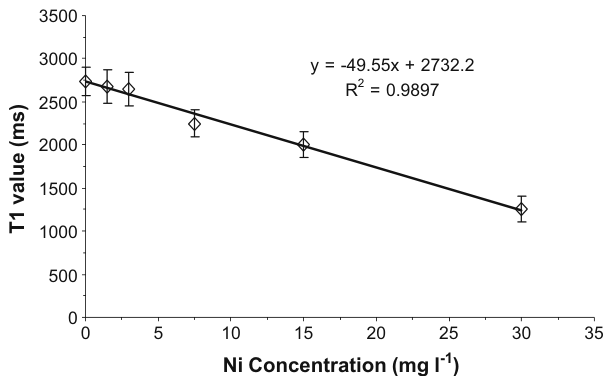
In a separate experiment, we found a linear relationship between the longitudinal relaxation time, T1, and the Ni2+ concentrations in glass beads saturated with Ni2+ solution in the concentration range of 1–30 mg l−1 (Fig. 2). This calibration curve was used for calculating Ni2+ concentrations for each pixel from the corresponding T1 values.
在另一项实验中,我们发现在1–30 mg l−1浓度范围内,以Ni2+溶液饱和的玻璃珠中纵向弛豫时间T1与Ni2+浓度之间呈线性关系(图2)。利用该校准曲线,由各像素对应的T1值计算其Ni2+浓度。
5Ni2+ uptake experimentNi2+吸收实验
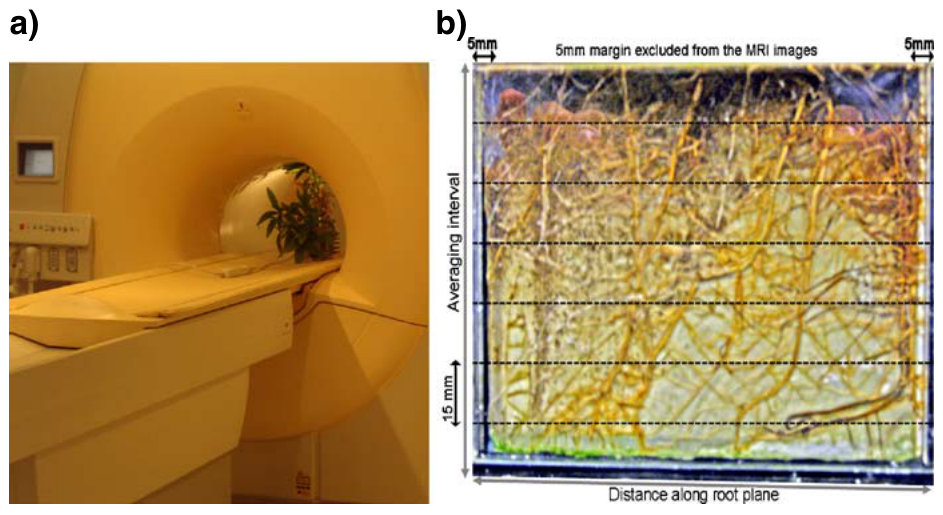
For the Ni2+ uptake experiment, the main compartment of the rhizobox was washed with eight porevolumes of Ni2+ solution with a concentration of 10 mg l−1 (prepared using Ni (NO3)2, 6H2O) to replace the nutrient solution. We used the lower ports as inlets for ingoing Ni2+ solution and let the solution overflow over the lateral walls of the rhizobox to ensure homogeneous initial Ni2+ distribution in the system. This rather high concentration of Ni2+ was used to stay clearly above the detection limit for Ni2+ of 1 mg l−1. The rhizobox was put into the MRI scanner (Fig. 3a) and a circular RF coil was installed on the root-plane side of the rhizobox close to the roots. The first T1 measurement could be carried out 3 h after the Ni2+ solution was applied to the rhizobox. The second and the third measurement were performed 5 and 11 h after the application of Ni2+ solution, respectively. The amount of transpiration was measured by weighing the rhizobox before and after the experiment. We kept the upper compartment dry for a week before the MRI experiment started, therefore, evaporation during the experiment and the transpiration from the upper compartment was considered negligible and the water was assumed to be taken up by plant roots only from the main compartment of the rhizobox.
在Ni2+吸收实验中,以8倍孔隙体积、浓度为10 mg l−1的Ni2+溶液(用Ni(NO3)2·6H2O配制)冲洗根箱主隔室,以置换营养液。以下方端口作为Ni2+溶液的进口,并使溶液从根箱侧壁溢出,以确保系统内Ni2+初始分布均匀。采用此较高的Ni2+浓度,是为了明显高于Ni2+的检测限1 mg l−1。将根箱置于MRI扫描仪中(图3a),并在根箱根平面一侧靠近根系处安装圆形RF线圈。第一次T1测量在向根箱施加Ni2+溶液后3 h进行,第二次和第三次测量分别在施加Ni2+溶液后5 h和11 h进行。通过在实验前后称量根箱测定蒸腾量。在MRI实验开始前,上隔室已保持干燥一周,因此实验期间的蒸发及上隔室的蒸腾可忽略不计,并假定植物根系仅从根箱主隔室吸水。
6Modelling模拟
Simulations were carried out using the numerical code MIN3P (Mayer et al. 2002), which describes variablysaturated flow and transport in three-dimensional porous media and geochemical reactions including kinetic and equilibrium mass exchange with mineral phases and roots. The simulation of variably saturated water flow is described by the Richards equation, which is implemented in MIN3P using the formulation (Mayer et al. 2002):
采用数值程序MIN3P(Mayer et al. 2002)进行模拟。该程序可描述三维多孔介质中的变饱和水流与溶质运移,以及包括与矿物相和根系之间动力学及平衡质量交换在内的地球化学反应。变饱和水流采用Richards方程描述,在MIN3P中以如下形式实现(Mayer et al. 2002):

Where t is time (s), � is the total porosity, Sa is water saturation, Ss is the specific storage coefficient (m−1), Qa is the sink/source term, K is the hydraulic conductivity tensor (m s−1), kra is the relative permeability of the porous medium with respect to the aqueous phase and is related to the hydraulic head, h, and water saturation, Sa, through the standard soil hydraulic functions given by Wosten and Vangenuchten (1988).
式中,t为时间(s),ϕ为总孔隙度,Sa为水饱和度,Ss为比储水系数(m−1),Qa为源汇项,K为水力传导度张量(m s−1),kra为多孔介质对水相的相对渗透率,并通过Wosten and Vangenuchten (1988)给出的标准土壤水力函数与水头h和水饱和度Sa相关联。
The mass balance equation for the reactive transport of the solutes was as followings:
溶质反应性运移的质量平衡方程如下:
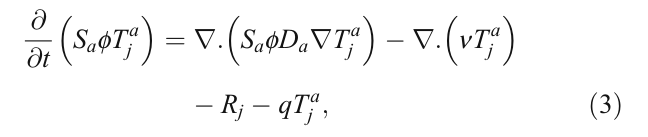
Where Tja is the total aqueous concentration of the component j (mol m−3), ν is the Darcy velocity (m s−1), Da is the hydrodynamic dispersion coefficient (m2 s−1), Rj is the sink/source term for kinetically-controlled reactions, and q is the water uptake flux (s−1).
式中,Tja为组分j的总水相浓度(mol m−3),ν为达西流速(m s−1),Da为水动力弥散系数(m2 s−1),Rj为动力学控制反应的源汇项,q为吸水通量(s−1)。
We used MIN3P to simulate Ni2+ distribution in the rhizobox and adjacent to the root plane as being taken up by roots. The simulation was set to start with the initial condition of water saturated for the rhizobox and no flux from the boundaries except for the root plane that was assumed to be a homogeneous sink for water and Ni2+ Soil hydraulic function parameters were set to following values; residual water content was 0.05, Van Genuchten α was 0.143 m−1, Van Genuchten n was 1.506 and Van Genuchten l was 0.65. Water was set to be taken up at a constant rate during the experiment. Nickel uptake was modeled following the approach by Lombi et al. (2001) that adds a linear component to the Michaelis- Menten kinetics:
我们利用MIN3P模拟根箱内及根平面附近因根系吸收而形成的Ni2+分布。模拟的初始条件设定为根箱水饱和,除根平面被假定为水和Ni2+的均匀汇外,各边界均无通量。土壤水力函数参数设定如下:残余含水量为0.05,Van Genuchten α为0.143 m−1,Van Genuchten n为1.506,Van Genuchten l为0.65。假定实验期间根系以恒定速率吸水。镍吸收按照Lombi et al. (2001)的方法进行模拟,该方法在Michaelis-Menten动力学基础上增加了一个线性分量:

where FM is the root uptake rate per unit surface of the roots (mol m−2 s−1), km is the effective rate coefficient (mol m−2 s−1), Km is the Michaelis- Menten’s constant (mol m−3), c is the Ni2+ concentration in solution (mol m−3), and α is the slope of the linear component (mol m−2 s−1).
式中,FM为单位根表面积的根系吸收速率(mol m−2 s−1),km为有效速率系数(mol m−2 s−1),Km为Michaelis-Menten常数(mol m−3),c为溶液中Ni2+浓度(mol m−3),α为线性分量的斜率(mol m−2 s−1)。
Sensitivity analysis showed that the most critical parameters were uptake rate coefficient and transpiration rate (data not shown here). The Ni2+ uptake rate coefficient, the Michaelis-Menten’s constant and the linear component were varied randomly to yield the observed temporal evolution of the Ni2+ distribution. Root mean square error (RMSE) measure was used to evaluate the simulations and the one with the smallest RMSE was finally chosen. The Ni2+ diffusion coefficient in free aqueous solution was set to 1.25× 10⁻⁹ m2 s−1. The dispersivity was set to 9.0×10⁻⁴ m, which reflects the grain-size of the glass beads we used (0.4–1.0 mm) and agrees with the typical range of dispersivity in soils (Aggelopoulos and Tsakiroglou 2007). The initial Ni2+ concentration was 10 mg l−1. The other parameters were taken directly from the experiment. The glass beads were chemically inert; therefore, no sorption isotherm was used. The grid resolution for numerical solution was set to correspond to the spatial resolution of the MRI measurement, except that a finer grid was chosen in the direct vicinity of the roots for better convergence with the numerical solution.
敏感性分析表明,最关键的参数是吸收速率系数和蒸腾速率(数据未列出)。随机调整Ni2+吸收速率系数、Michaelis-Menten常数和线性分量,以再现观测到的Ni2+分布时间演变。采用均方根误差(RMSE)评价各模拟结果,最终选取RMSE最小者。Ni2+在自由水溶液中的扩散系数设为1.25× 10⁻⁹ m2 s−1。弥散度设为9.0×10⁻⁴ m,这反映了所用玻璃珠的粒径(0.4–1.0 mm),并与土壤弥散度的典型范围一致(Aggelopoulos and Tsakiroglou 2007)。Ni2+初始浓度为10 mg l−1。其他参数直接取自实验。玻璃珠呈化学惰性,因此未采用吸附等温线。数值求解的网格分辨率设定为与MRI测量的空间分辨率相对应,但在紧邻根系处采用更细的网格,以使数值解更好地收敛。
7Results结果
8Temporal changes of Ni2+ distributionNi2+分布的时间变化
Figure 3b shows the distribution pattern of roots in the root-only compartment before the Ni2+ uptake experiment started. The horizontal sections, separated by the dashed lines correspond to the slices into which the MRI signals were collected. There was a dense layer of roots in the first two slices, but the root图3b显示了Ni2+吸收实验开始前纯根隔室中根系的分布格局。由虚线分隔的水平区段对应于采集MRI信号的切片。前两个切片中根系层较为密集,但根
density was lower in the bottom of the rhizobox. The root mat was composed of old and young roots in all slices. The root distribution was most homogeneous in the 3rd, 4th and 5th slice from the top. These three slices remained water saturated during the course of experiment, therefore, they were chosen for calculations of T1 and Ni2+ concentration profiles.
系密度在根箱底部较低。所有切片中的根垫均由老根和幼根组成。自上而下第3、4和5切片中根系分布最为均匀。这三个切片在实验过程中始终保持水饱和,因此被选用于计算T1和Ni2+浓度剖面。
The Ni2+ distribution maps measured at various times after the application of Ni2+ solution are shown in Fig. 4. Each Ni2+ distribution map represents a pixel-wise average value of the slices 3, 4 and 5 that were calculated from the corresponding T1 values using the calibration curve in Fig. 2. T1 values ranged from 1,800 ms near the root plane to slightly above 2,400 ms in the corners of the rhizobox farthest away from the root plane (data not shown here). Compared to the middle of the rhizobox, the corners of the rhizobox were farthest away from the coil centre and showed a weaker SNR and therefore considerably higher variability in the calculated T1 and the corresponding Ni2+ concentrations. This indicates that the reliability of the measurement decreased with distance from the coil centre due to a decline in SNR. Already at the first measurement, 3 h after the start of the experiment (application of Ni2+ solution to the rhizobox), a gradient in the Ni2+ concentration was visible (Fig. 4a). The Ni2+ concentration ranged from around 15 mg l−1 immediately adjacent to the root-plane to slightly above 10 mg l−1 at a distance of 20 mm away from the roots on the opposite side of the rhizobox. This indicates that the amount of Ni2+ transported to the root surface via convection was greater than the amount of Ni2+ taken up by the roots. The roots partially excluded the Ni2+ and the extent of the exclusion in the middle of the root-plane was greater than at the edges. This variability might be related to the inhomogeneous distribution and activity of the roots. After 5 h, the Ni2+ accumulation zone extended to a distance of more than 20 mm away from the root surface in the middle of the root-plane (Fig. 4b). The Ni2+ accumulation zone extended to the sides of the rhizobox 11 h after the experiment had started (Fig. 4c), while the magnitude of the accumulation was still highest in the middle.
图4给出了施加Ni2+溶液后不同时间测得的Ni2+分布图。每幅Ni2+分布图代表第3、4和5切片的逐像素平均值,这些值由相应的T1值通过图2中的校准曲线计算得到。T1值从根平面附近的1,800 ms到根箱中距根平面最远的角落处略高于2,400 ms(数据未列出)。与根箱中部相比,根箱角落距线圈中心最远,SNR较弱,因此计算所得的T1及相应的Ni2+浓度变异性明显较高。这表明,由于SNR下降,测量的可靠性随距线圈中心距离的增加而降低。早在实验开始(向根箱施加Ni2+溶液)后3 h的第一次测量时,即可观察到Ni2+浓度梯度(图4a)。Ni2+浓度从紧邻根平面处的约15 mg l−1,变化至根箱另一侧距根系20 mm处的略高于10 mg l−1。这表明通过对流输送至根表面的Ni2+量大于根系吸收的Ni2+量。根系对Ni2+有部分排斥作用,且根平面中部的排斥程度大于边缘。这种差异可能与根系分布及活性的不均匀性有关。5 h后,在根平面中部,Ni2+累积区已延伸至距根表面20 mm以上(图4b)。实验开始11 h后,Ni2+累积区扩展至根箱两侧(图4c),而累积幅度仍以中部最高。
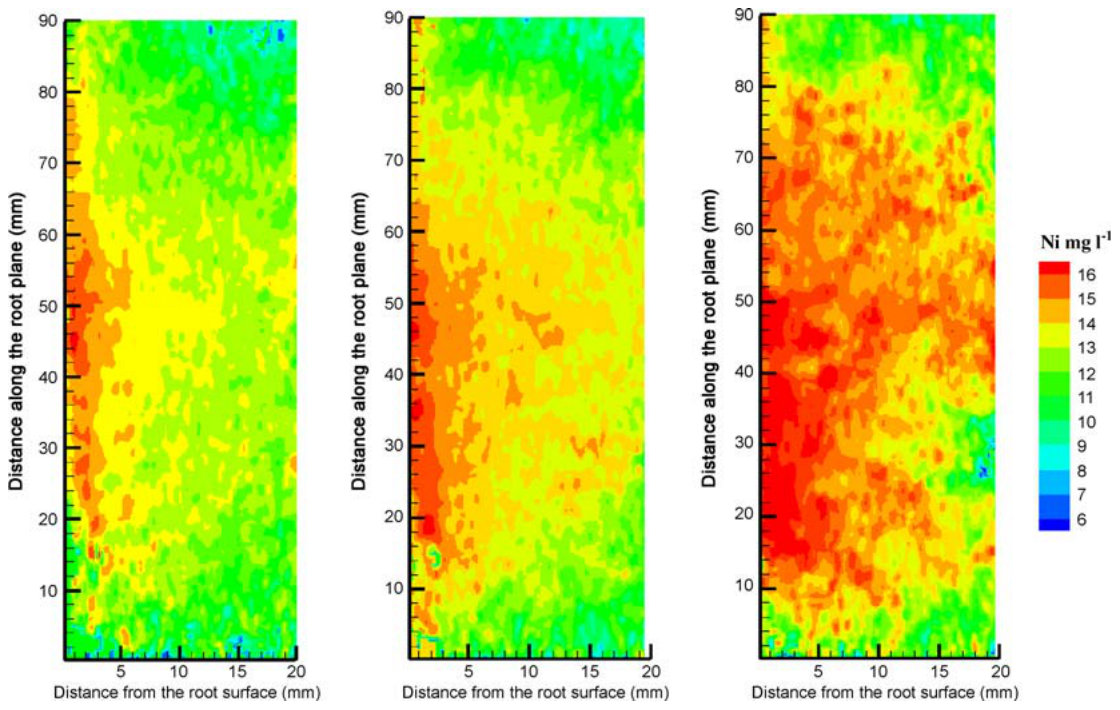
Ni2+ concentration mapping at different soil water contents
不同土壤含水量下的Ni2+浓度成像
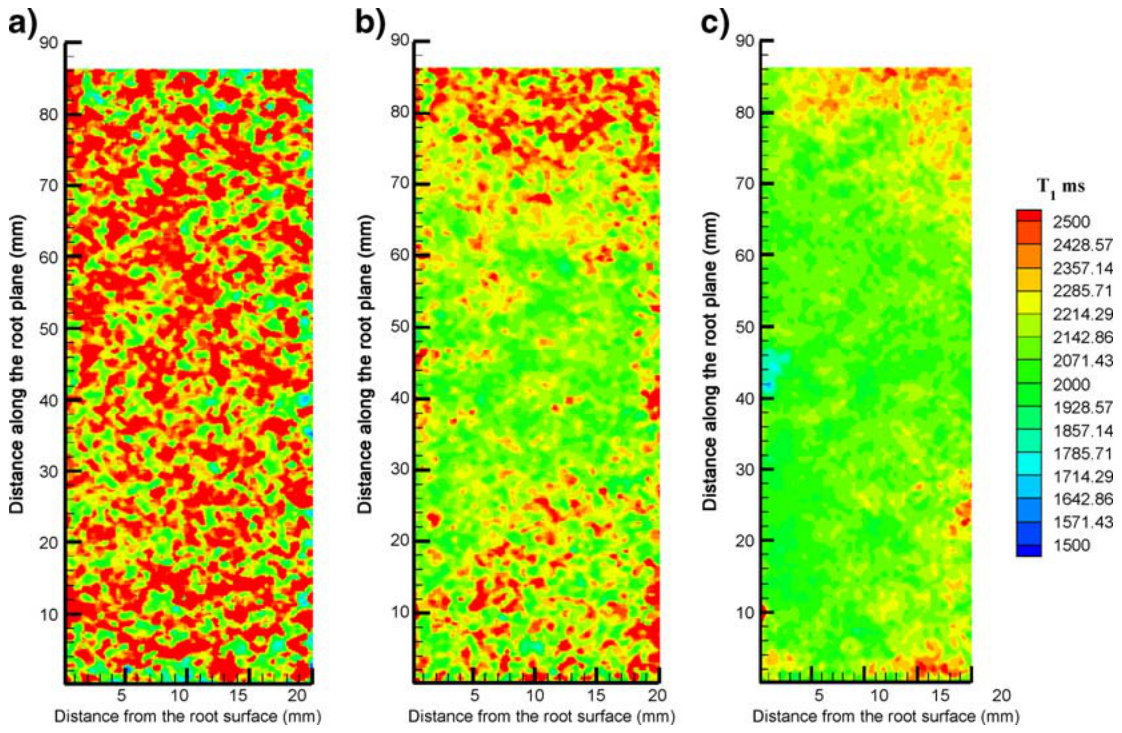
As the plants transpired water, the water level in the rhizobox dropped and the upper part of the rhizobox became unsaturated. With the decrease in water content, also the SNR decreased in the upper part of the rhizobox (mainly first and the second slice from top). This resulted in high variability in the calculated T1 values. T1 maps of horizontal cross-sections through the rhizobox at the upper first slice (unsaturated), the second slice (partly saturated), and the 4th slice (saturated) are shown in Fig. 5a, b, and c, respectively. In the unsaturated zone (Fig. 5a), the SNR was much poorer than in the saturated zone below. Water was the main signal-bearing source in our system, therefore a decrease in water content resulted in decrease in SNR. Since the main aim here was to visualize Ni2+ concentrations close to the roots where full water saturation was persistent during the experiments, we did not further process the MRI data from the unsaturated part of the rhizobox. The SNR increased in the second slice of the rhizobox in the transition zone between saturated and unsaturated zone (Fig. 5b) i.e. in the zone of capillary fringe above the water level, but the signal was considerably lower and more heterogeneous than in the fully saturated zone (Fig. 5c).
随着植物蒸腾耗水,根箱内水位下降,根箱上部变为非饱和状态。随着含水量降低,根箱上部(主要是自上而下第一和第二切片)的SNR也随之下降,导致计算所得T1值变异性较高。图5a、b和c分别给出了根箱上部第一切片(非饱和)、第二切片(部分饱和)和第4切片(饱和)水平截面的T1图。在非饱和区(图5a),SNR远低于下方的饱和区。水是本系统中主要的信号来源,因此含水量降低导致SNR下降。由于本研究的主要目的是对实验期间始终保持完全水饱和的根系附近Ni2+浓度进行可视化,我们未进一步处理根箱非饱和部分的MRI数据。在根箱第二切片中饱和区与非饱和区之间的过渡带(图5b),即水位以上的毛管边缘带,SNR有所升高,但信号明显低于完全饱和区且更不均匀(图5c)。
9Modelling Ni2+ uptakeNi2+吸收的模拟
Figure 6 shows the MRI-measured and the simulated average profiles of Ni2+ concentrations with distance from the root plane for each measurement time. The MRI-measured averages were taken column-wise parallel to the root plane from the 3rd, 4th, and 5th slices.图6给出了各测量时间MRI实测和模拟的Ni2+浓度平均剖面随距根平面距离的变化。MRI实测平均值取自第3、4和5切片中平行于根平面的逐列平均。
The best agreement between the simulated and MRI-measured Ni2+ concentration profiles (based on RMSE analysis) was obtained when the uptake rate coefficient was set to 1.17×10⁻⁸ mol m−2 s−1, the Michaelis-Menten’s constant to 2.5×10⁻⁴ mol m−3, and the linear component to 1.05×10⁻⁹ mol m−2 s−1. These values are well in the same order of magnitude with the published rates for zinc and cadmium by other hyperaccumulator plants (Lombi et al. 2001; Zhao et al. 2006). The concentration range of Ni2+ in solution was almost three orders of magnitude higher than the optimized Michaelis-Menten’s constant which shows that the Ni2+ uptake by root was mainly passive instead of active. The simulation of the averaged Ni2+ profile at t=3 h was the most satisfactory (RMSE=0.20 compared to 0.26 and 0.46 for t=5 and 11 respectively). The MRI-measured Ni2+ concentration was in good agreement with the simulated Ni2+ profile over the whole length from the root plane to the opposite wall. For t=5 and 11, the simulated Ni2+ concentration profiles were slightly overestimated adjacent to the root surface and underestimated at farther distances namely 5–15 mm from the roots. The MRI-measured Ni2+ profiles showed a gentler slope than the simulated ones.
当吸收速率系数设为1.17×10⁻⁸ mol m−2 s−1、Michaelis-Menten常数设为2.5×10⁻⁴ mol m−3、线性分量设为1.05×10⁻⁹ mol m−2 s−1时,模拟与MRI实测的Ni2+浓度剖面吻合最佳(基于RMSE分析)。这些数值与其他超富集植物对锌和镉的已发表吸收速率处于同一数量级(Lombi et al. 2001; Zhao et al. 2006)。溶液中Ni2+的浓度范围比优化所得Michaelis-Menten常数高出近三个数量级,表明根系对Ni2+的吸收主要是被动的而非主动的。t=3 h时平均Ni2+剖面的模拟效果最为理想(RMSE=0.20,而t=5和11时分别为0.26和0.46)。在从根平面至对侧壁的整个长度上,MRI实测Ni2+浓度与模拟Ni2+剖面吻合良好。对于t=5和11,模拟的Ni2+浓度剖面在紧邻根表面处略有高估,而在较远处(即距根系5–15 mm)则有所低估。MRI实测的Ni2+剖面斜率比模拟剖面更为平缓。
Effects of various parameters on Ni2+ concentration profile
各参数对Ni2+浓度剖面的影响
The magnitude and the sign of the Ni2+ gradient adjacent to the roots are essentially a function of Ni2+ concentration in solution, the rate of Ni2+ uptake by the roots, and the transpiration rate. We performed a sensitivity analysis by varying each one of these parameters at a time while keeping the other parameters constant. Figure 7 shows how transpiration rate affected the simulated Ni2+ concentration gradient. The transpiration rate was reduced by 45 and 85%, while all other parameters were kept constant. Reduction of the transpiration by 45% eliminated the gradient profile, while 85% reduction in transpiration resulted in a negative gradient towards the roots.
根系附近Ni2+梯度的大小和正负本质上取决于溶液中Ni2+浓度、根系对Ni2+的吸收速率以及蒸腾速率。我们每次改变其中一个参数而保持其他参数不变,进行了敏感性分析。图7显示了蒸腾速率对模拟Ni2+浓度梯度的影响。在其他参数保持不变的情况下,将蒸腾速率分别降低45%和85%。蒸腾降低45%时梯度剖面消失,而蒸腾降低85%时则形成指向根系的负梯度。
Varying the uptake rate coefficient had similar effects on the Ni2+ concentration profile (Fig. 8). The Ni2+ concentration gradient became gentler and then disappeared when the uptake rate coefficient was increased to 2.7×10⁻⁸ and 4.95×10⁻⁷ mol m−2 s−1 respectively. Using an uptake rate coefficient of 1.62×10⁻⁶ mol m−2 s−1 resulted in Ni2+ depletion in the rhizosphere.
改变吸收速率系数对Ni2+浓度剖面具有类似的影响(图8)。当吸收速率系数分别增至2.7×10⁻⁸和4.95×10⁻⁷ mol m−2 s−1时,Ni2+浓度梯度先变得平缓,继而消失。采用1.62×10⁻⁶ mol m−2 s−1的吸收速率系数时,根际出现Ni2+亏缺。
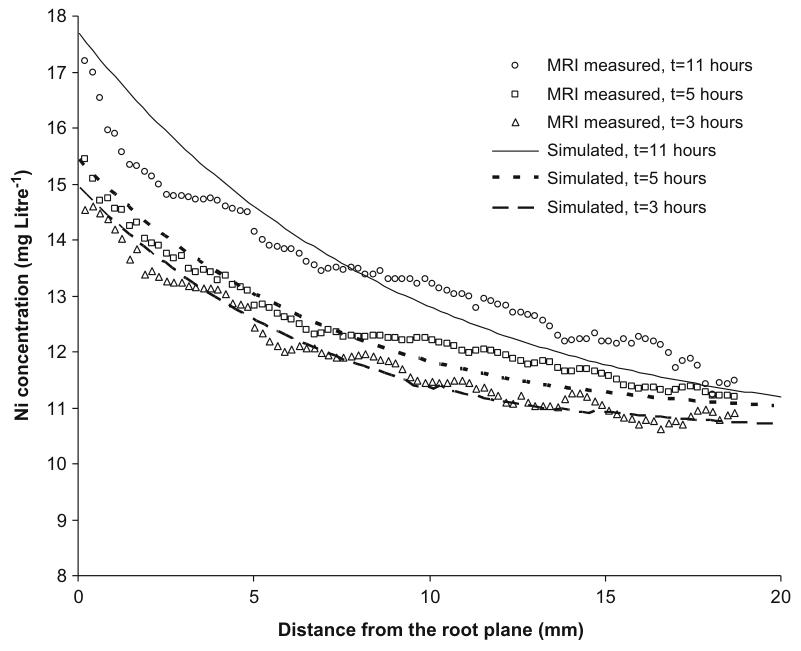
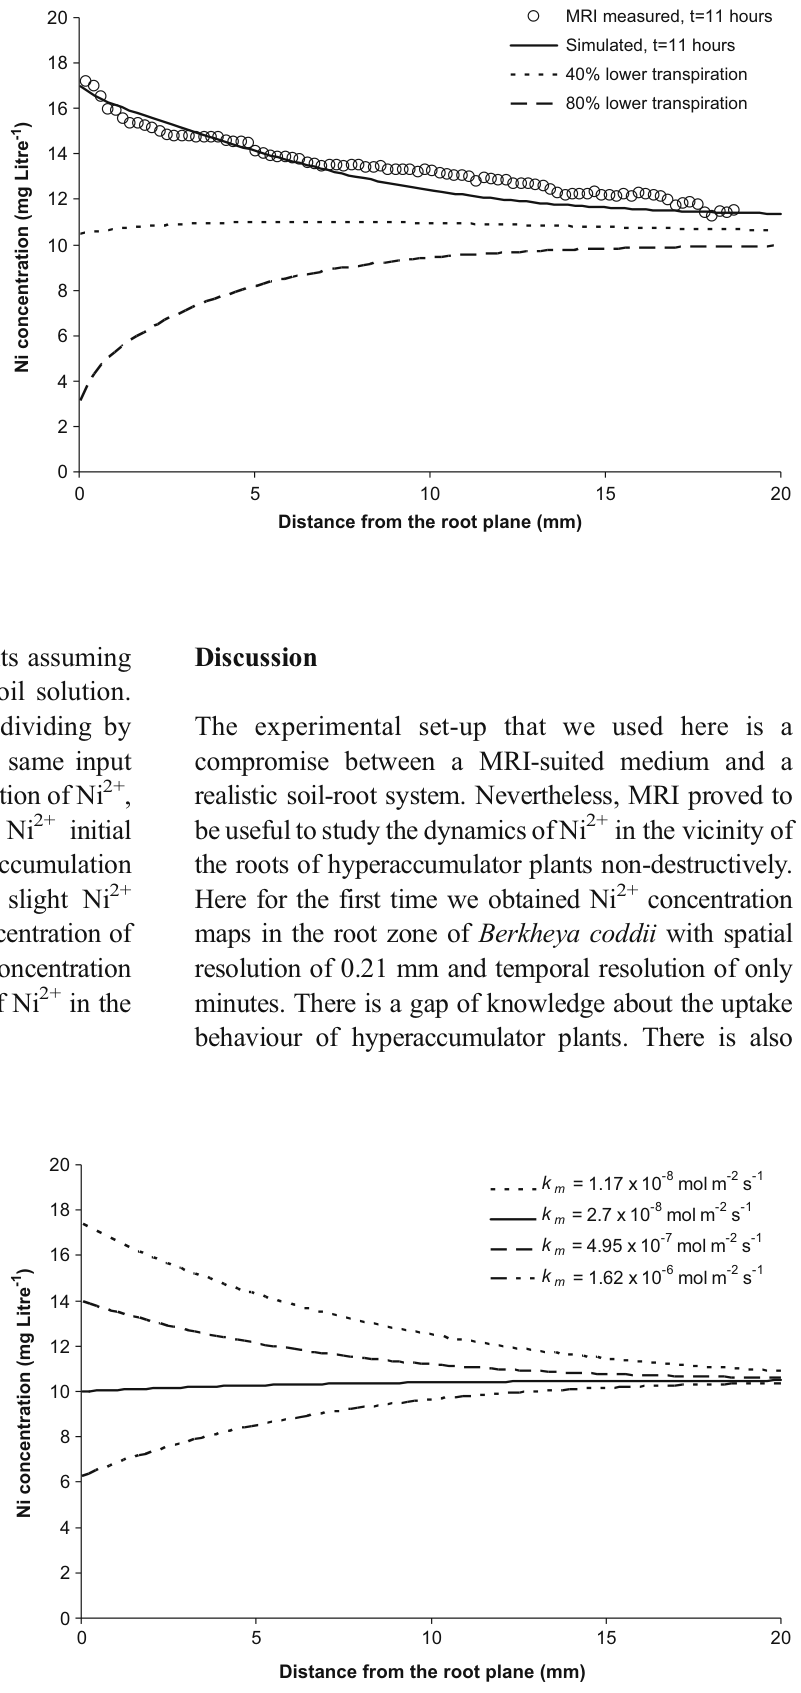
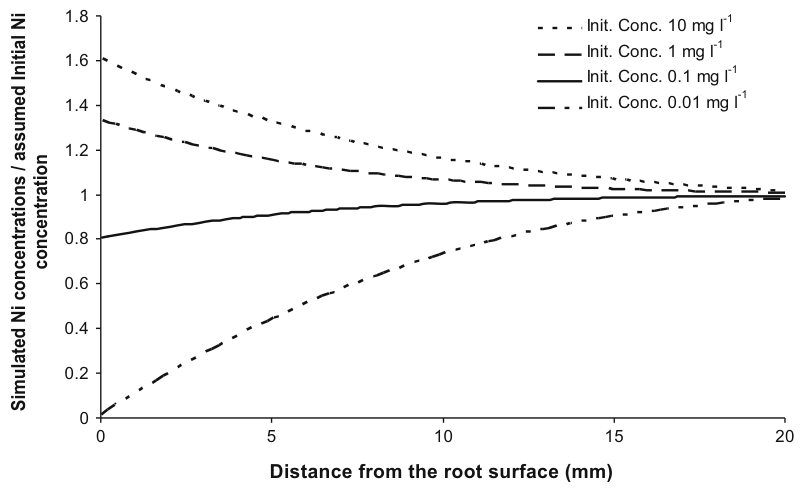
Figure 9 shows simulated Ni2+ gradients assuming various initial concentration of Ni2+ in soil solution. The Ni2+ gradients were normalized by dividing by the initial Ni2+ concentrations. Using the same input parameters but varying the initial concentration of Ni2+, resulted in different Ni2+ gradients. For Ni2+ initial concentration of 1 mg l−1, the simulated accumulation pattern was gentler than 10 mg l−1. A slight Ni2+ depletion was obtained for Ni2+ initial concentration of 0.1 mg l−1 while assuming a Ni2+ initial concentration of 0.01 mg l−1 resulted in an exhaustion of Ni2+ in the soil solution in the rhizosphere.图9给出了假定土壤溶液中Ni2+初始浓度不同时模拟的Ni2+梯度。Ni2+梯度通过除以Ni2+初始浓度进行归一化。在输入参数相同而仅改变Ni2+初始浓度的情况下,得到了不同的Ni2+梯度。Ni2+初始浓度为1 mg l−1时,模拟的累积格局比10 mg l−1时更为平缓。Ni2+初始浓度为0.1 mg l−1时出现轻微的Ni2+亏缺,而假定Ni2+初始浓度为0.01 mg l−1时,根际土壤溶液中的Ni2+被耗尽。
The experimental set-up that we used here is a compromise between a MRI-suited medium and a realistic soil-root system. Nevertheless, MRI proved to be useful to study the dynamics of Ni2+ in the vicinity of the roots of hyperaccumulator plants non-destructively. Here for the first time we obtained Ni2+ concentration maps in the root zone of Berkheya coddii with spatial resolution of 0.21 mm and temporal resolution of only minutes. There is a gap of knowledge about the uptake behaviour of hyperaccumulator plants. There is also desire for a non-destructive non-invasive technique to study rhizosphere processes. Therefore, MRI can be used to study the uptake behaviour of hyperaccumulator plants. However there are several limitations in applying MRI to a real soil-root system. The porous medium that was used here is chemically inert, while the real soil-root system requires accounting for interactions between the ions in the soil solution and the solid phase. MRI was proved to suffer from fading of SNR in unsaturated conditions. The resulting SNR from the unsaturated zone of the rhizobox showed a considerable degree of random variability in unsaturated conditions, representing variations of water content but also water distribution in the pore space. Our images had a spatial resolution of 0.21×0.21 mm, a slice thickness of 15 mm, and therefore, a voxel size of 0.21×0.21× 15 mm. Considering the size of the glass beads (0.4– 1.0 mm), the voxel’s space was occupied by a random combination of beads and pore space that affects the relaxation behaviour and SNR. This holds true for even a completely water-saturated porous medium. Since each voxel contains a specific combination of beads, pore space and water content, it returns a specific SNR, which is different from the neighbouring voxels. This could be an advantage or disadvantage depending on the type of the information that is desired. For example, it clearly reflects the heterogeneity of the system. However, it makes any averaging of the MRI signal, T1 or concentrations along a profile deviating. Therefore, the voxel size should be optimised based on the aims of the study. Additionally, the variability of water saturation of the intra-grain pore space might affect the T1 relaxation behaviour and SNR (Fig. 5). To correct for this, separate calibration curves would be needed for given water contents and possibly also for different water distribution patterns in the pore space. Another shortcoming is the detection limit of MRI for Ni2+ concentration. We could resolve Ni2+ concentrations down to 1 mg l−1. However, this could be improved at the cost of measurement time and spatial resolution.
本文所用实验装置是适合MRI的介质与真实土壤–根系系统之间的折衷。尽管如此,MRI被证明可用于无损研究超富集植物根系附近Ni2+的动态。本研究首次获得了Berkheya coddii根区的Ni2+浓度分布图,其空间分辨率为0.21 mm,时间分辨率仅为数分钟。目前关于超富集植物吸收行为的认识尚存空白,同时也需要一种无损、非侵入性的技术来研究根际过程。因此,MRI可用于研究超富集植物的吸收行为。然而,将MRI应用于真实土壤–根系系统仍存在若干局限。本文所用多孔介质呈化学惰性,而真实的土壤–根系系统则需要考虑土壤溶液中离子与固相之间的相互作用。已证实MRI在非饱和条件下存在SNR衰减问题。根箱非饱和区所得SNR在非饱和条件下表现出相当程度的随机变异,这既反映了含水量的变化,也反映了孔隙空间中水分分布的变化。本文图像的空间分辨率为0.21×0.21 mm,层厚为15 mm,因此体素大小为0.21×0.21× 15 mm。考虑到玻璃珠的粒径(0.4– 1.0 mm),体素空间由玻璃珠与孔隙空间的随机组合所占据,这会影响弛豫行为和SNR。即使对于完全水饱和的多孔介质,情况亦是如此。由于每个体素包含玻璃珠、孔隙空间和含水量的特定组合,其返回的SNR也各不相同,与相邻体素存在差异。视所需信息类型的不同,这既可能是优点也可能是缺点。例如,它能清楚地反映系统的异质性;但同时也会使沿剖面对MRI信号、T1或浓度的任何平均产生偏差。因此,应根据研究目的优化体素大小。此外,颗粒内孔隙空间水饱和度的变化可能影响T1弛豫行为和SNR(图5)。为对此进行校正,需要针对给定含水量、甚至可能针对孔隙空间中不同的水分分布格局分别建立校准曲线。另一不足之处是MRI对Ni2+浓度的检测限。我们能够分辨低至1 mg l−1的Ni2+浓度,但以牺牲测量时间和空间分辨率为代价,这一检测限仍可进一步改善。
Fig. 8 Simulated Ni2+ concentration profiles as a function of distance from root surface for four different uptake rate coefficients. All other parameters were kept constant图8 四种不同吸收速率系数下模拟的Ni2+浓度剖面随距根表面距离的变化。其他参数均保持不变
The increase in Ni2+ concentration towards the root surface (Fig. 4) means that Ni2+ uptake by roots was not limited by diffusion at these relatively high soluble Ni2+ concentrations. Our result suggests that Berkheya coddii can hyperaccumulate Ni in soils with high Ni concentration in soil solution without actively solubilizing Ni in the root zone. Therefore, the Ni diffusion in such soils is not the limiting factor for phytoremediation or phytomining purposes. This might be the case in serpentine soils, where Berkheya coddii is native.
Ni2+浓度向根表面方向升高(图4),意味着在这些较高的可溶性Ni2+浓度下,根系对Ni2+的吸收不受扩散限制。我们的结果表明,在土壤溶液中镍浓度较高的土壤中,Berkheya coddii无需主动溶解根区的镍即可超富集镍。因此,在此类土壤中,镍的扩散并非植物修复或植物采矿的限制因素。Berkheya coddii原生的超基性(蛇纹岩)土壤可能即属此种情况。
Our simulation results showed that metal concentration gradient in the rhizosphere is very dynamic and is controlled by plant’s transpiration rate, metal uptake rate and the metal concentration in the soil solution (Figs. 7, 8, and 9). Diurnal change of transpiration is expected to affect the gradients of metals in the rhizosphere. For example for metals and ions that are abundant in soil solution, a positive gradient might develop at the peak of transpiration rate in midday, while it may disappear by reduction in transpiration in the evenings. Metal gradients in the rhizosphere of various plant species with various uptake properties might be different. Plants with lower metal uptake-rate are more likely to experience accumulation of metal near their roots.
模拟结果表明,根际中的金属浓度梯度具有高度动态性,受植物蒸腾速率、金属吸收速率以及土壤溶液中金属浓度的控制(图7、8和9)。蒸腾的昼夜变化预计会影响根际中的金属梯度。例如,对于土壤溶液中含量丰富的金属和离子,在正午蒸腾速率达到峰值时可能形成正梯度,而在傍晚随着蒸腾减弱该梯度可能消失。具有不同吸收特性的各种植物,其根际金属梯度可能有所不同。金属吸收速率较低的植物更有可能在其根系附近出现金属累积。
The total Nickel extractable by 1 M ammonium acetate was found to reach concentrations up to 12 mg l−1 in serpentine soils in Berkheya coddii’s native environment (Robinson et al. 1997), while it is usually present in much lower concentrations in other soils. The metal concentration profile in the rhizosphere of the plants growing in highly contaminated soils might differ from those in less contaminated soils. Figure 9 illustrates that an initial concentration of 10 mg l−1 resulted in an accumulation pattern, while an initial concentration of less than 0.1 mg l−1 resulted in an extensive depletion of Ni2+ adjacent to the roots. This shows that a depletion of Ni2+ is expected at low dissolved concentrations of Ni2+ in soil solution, if the uptake rate stays unchanged. However, the interactions between the sorbed and soluble Ni in soil needs to be considered. Puschenreiter et al. (2005) studied Ni in the rhizosphere of the hyperaccumulator Thlaspi goesingense and reported an accumulation of Ni in soil solution at the root surface but a depletion of labile Ni towards the roots. Their results suggests that hyperaccumulation of Ni (at much lower Ni concentrations in soil solution than in our case) is influenced by the interactions between Ni in soil solution and the soil solid-phase. They also highlighted the importance of root-induced changes in the rhizosphere. Local changes in dissolved organic matter and pH due to root exudates can influence the speciation of metals in the soil solution and their mobilisation from the soil solid-phase. These interactions were not accounted for here, neither in the MRI measurements nor in the modelling.
在Berkheya coddii原生环境的超基性(蛇纹岩)土壤中,1 M乙酸铵可提取的总镍浓度可高达12 mg l−1(Robinson et al. 1997),而在其他土壤中其浓度通常要低得多。生长在重度污染土壤中的植物,其根际金属浓度剖面可能不同于轻度污染土壤。图9表明,10 mg l−1的初始浓度导致累积格局,而低于0.1 mg l−1的初始浓度则导致根系附近Ni2+的大范围亏缺。这说明,若吸收速率保持不变,在土壤溶液中溶解态Ni2+浓度较低时预计将出现Ni2+亏缺。然而,还需考虑土壤中吸附态镍与可溶态镍之间的相互作用。Puschenreiter et al. (2005)研究了超富集植物Thlaspi goesingense根际中的镍,报道了土壤溶液中的镍在根表面累积,而活性镍则向根系方向亏缺。其结果表明,镍的超富集(在土壤溶液镍浓度远低于本研究的情况下)受土壤溶液中的镍与土壤固相之间相互作用的影响。他们还强调了根系诱导的根际变化的重要性。根系分泌物引起的溶解性有机质和pH的局部变化,可影响土壤溶液中金属的形态及其从土壤固相中的活化。本研究无论在MRI测量还是模拟中均未考虑这些相互作用。
In conclusion, this study shows that even though the real soil-root system was to some extent compromised, combination of MRI and numerical modelling could provide some valuable insight into the dynamic of metals in the root-soil interface. Ni uptake by Berkheya coddii was shown to be passive and Ni was partly excluded from the roots and accumulated in the rhizosphere at the concentration range that was used here. The accumulation or depletion of Ni2+ in the root zone of hyperaccumulator plants were demonstrated to be a delicate function of sensitive parameters such as transpiration rate, Ni2+ uptake rate and initial Ni2+ concentration in the soil solution. Our simulation results showed that while decreasing the Ni2+ uptake rate coefficient resulted in accumulation of Ni2+ in the rhizosphere, a depletion pattern was developed when the initial Ni2+ or the transpiration rate was reduced.
综上所述,本研究表明,尽管在一定程度上对真实土壤–根系系统有所简化,MRI与数值模拟相结合仍可为认识根–土界面金属动态提供有价值的见解。结果表明,Berkheya coddii对镍的吸收是被动的;在本研究所用浓度范围内,镍部分被根系排斥并在根际累积。超富集植物根区Ni2+的累积或亏缺被证明是蒸腾速率、Ni2+吸收速率及土壤溶液中Ni2+初始浓度等敏感参数的精细函数。模拟结果显示,降低Ni2+吸收速率系数会导致Ni2+在根际累积,而降低Ni2+初始浓度或蒸腾速率则会形成亏缺格局。
Acknowledgements This study was funded by the Swiss National Science Foundation. We would like to thank Reto Treier (IBE, ETH Zurich) for his technical support on T1 calculations.
致谢 本研究由瑞士国家科学基金会(Swiss National Science Foundation)资助。感谢Reto Treier(IBE, ETH Zurich)在T1计算方面提供的技术支持。
10References参考文献
Aggelopoulos CA, Tsakiroglou CD (2007) The longitudinal dispersion coefficient of soils as related to the variability of local permeability. Water Air Soil Poll 185:223–237
Ashworth DJ, Alloway BJ (2004) Soil mobility of sewage sludge-derived dissolved organic matter, copper, nickel and zinc. Environ Pollut 127:137–144
Brooks RR (ed) (1998) Plants that hyperaccumulate heavy metals. CAB International, Wallingford
Brooks RR, Lee J, Reeves RD, Jaffre T (1977) Detection of nickeliferous rocks by analysis of herbarium specimens of indicator plants. J Geochem Explor 7:49–57
Brooks RR, Chambers MF, Nicks LJ, Robinson BH (1998)
Phytomining. Trends Plant Sci 3:359–362
Darrah PR (1993) The rhizosphere and plant nutrition—a quantitative approach. Plant Soil 156:1–20
Deoni SCL, Rutt BK, Peters TM (2003) Rapid combined T-1
and T-2 mapping using gradient recalled acquisition in the steady state. Magn Reson Med 49:515–526
Gregory PJ, Hinsinger P (1999) New approaches to studying chemical and physical changes in the rhizosphere: an overview. Plant Soil 211:1–9
Herrmann KH, Pohlmeier A, Wiese S, Shah NJ, Nitzsche O, Vereecken H (2002) Three-dimensional nickel ion transport through porous media using magnetic resonance imaging. J Environ Qual 31:506–514
Hinsinger P, Plassard C, Jaillard B (2006) Rhizosphere: a new frontier for soil biogeochemistry. J Geochem Explor 88:210–213
Kraemer U, CotterHowells JD, Charnock JM, Baker AJM, Smith JAC (1996) Free histidine as a metal chelator in plants that accumulate nickel. Nature 379:635–638
Li YM, Chaney R, Brewer E, Roseberg R, Angle JS, Baker A, Reeves R, Nelkin J (2003) Development of a technology for commercial phytoextraction of nickel: economic and technical considerations. Plant Soil 249:107–115
Lombi E, Zhao FJ, McGrath SP, Young SD, Sacchi GA (2001) Physiological evidence for a high-affinity cadmium transporter highly expressed in a Thlaspi caerulescens ecotype. New Phytol 149:53–60
Mayer KU, Frind EO, Blowes DW (2002) Multicomponent reactive transport modeling in variably saturated porous media using a generalized formulation for kinetically controlled reactions. Water Resour Res 38:1174–1194
McNear DH, Peltier E, Everhart J, Chaney RL, Sutton S, Newville M, Rivers M, Sparks DL (2005) Application of quantitative fluorescence and absorption-edge computed microtomography to image metal compartmentalization in Alyssum murale. Environ Sci Technol 39:2210–2218
Moradi AB, Oswald SE, Massner JA, Pruessmann KP, Robinson BH, Schulin R (2008) Magnetic Resonance Imaging methods to reveal the real-time distribution of nickel in porous media. Eur J Soil Sci 59:476–485
Pierret A, Doussan C, Garrigues E, Mc Kirby J (2003) Observing plant roots in their environment: current imaging options and specific contribution of two-dimensional approaches. Agronomie 23:471–479
Puschenreiter M, Schnepf A, Millan IM, Fitz WJ, Horak O, Klepp J, Schrefl T, Lombi E, Wenzel WW (2005) Changes of Ni biogeochemistry in the rhizosphere of the hyperaccumulator Thlaspi goesingense. Plant Soil 271:205–218
Robinson BH, Brooks RR, Howes AW, Kirkman JH, Gregg PEH (1997) The potential of the high-biomass nickel hyperaccumulator Berkheya coddii for phytoremediation and phytomining. J Geochem Explor 60:115–126
Robinson BH, Brooks RR, Gregg PEH, Kirkman JH (1999) The nickel phytoextraction potential of some ultramafic soils as determined by sequential extraction. Geoderma 87:293–304
Tinker PB, Nye PH (2000) Solute movement in the rhizosphere. Oxford University Press, New York
Treier R, Steingoetter A, Fried M, Schwizer W, Boesiger P (2007) Optimized and combined T-1 and B-1 mapping technique for fast and accurate T-1 quantification in contrast-enhanced abdominal MRI. Magn Reson Med 57:568–576
Wenzel WW (2005) Rhizosphere conference. J Environ Qual 34:2156–2156
Wenzel WW, Wieshammer G, Fitz WJ, Puschenreiter M (2001) Novel rhizobox design to assess rhizosphere characteristics at high spatial resolution. Plant Soil 237:37–45
Whiting SN, Broadley MR, White PJ (2003) Applying a solute transfer model to phytoextraction: zinc acquisition by Thlaspi caerulescens. Plant Soil 249:45–56
Wosten JHM, Vangenuchten MT (1988) Using texture and other soil properties to predict the unsaturated soil hydraulic functions. Soil Sci Soc Am J 52:1762–1770
Zhao FJ, Hamon RE, Lombi E, McLaughlin MJ, McGrath SP (2002) Characteristics of cadmium uptake in two contrasting ecotypes of the hyperaccumulator Thlaspi caerulescens. J Exp Bot 53:535–543
Zhao FJ, Jiang RF, Dunham SJ, McGrath SP (2006) Cadmium uptake, translocation and tolerance in the hyperaccumulator Arabidopsis halleri. New Phytol 172:646–654