Contents lists available at ScienceDirect journal homepage: www.elsevier.com/locate/envexpbot
Ahmad B. Moradi a,∗, Siegfried Swoboda b, Brett Robinson a, Thomas Prohaska b, Anders Kaestner c, Sascha E. Oswald d, Walter W. Wenzel e, Rainer Schulin a
a Soil Protection group, Institute of Terrestrial Ecosystems, Dept. of Environmental Science, ETH Zürich, Switzerland b Dept. of Chemistry, University Natural Resources & Applied Life Science, Vienna, Austria c Paul Scherrer Institute, Villigen, Switzerland d Helmholtz Centre for Environmental Research -UFZ, Leipzig, Germany e Dept. of Forest & Soil Science, University Natural Resources & Applied Life Science, Vienna, Austria
a 瑞士苏黎世联邦理工学院环境科学系陆地生态系统研究所土壤保护组 b 奥地利维也纳自然资源与生命科学大学化学系 c 瑞士Villigen保罗·谢勒研究所 d 德国莱比锡亥姆霍兹环境研究中心(UFZ) e 奥地利维也纳自然资源与生命科学大学森林与土壤科学系
a r t i c l e i n f o
a b s t r a c t
Article history: Received 7 August 2009 Received in revised form 19 January 2010 Accepted 4 February 2010
Keywords: Berkheya coddii Cortex Dimethylglyoxime Laser ablation Nickel Root cross-section Stele
关键词:Berkheya coddii;皮层;丁二酮肟;激光剥蚀;镍;根横切面;中柱
Quantitative studies of the distribution pattern of metals in plant tissues provide important information on the potential of metal-accumulator plants for remediation and amelioration of contaminated soils. We used laser ablation inductively coupled plasma mass spectrometry (LA-ICP-MS) as well as staining with dimethylglyoxime (DMG) to investigate the distribution pattern of nickel (Ni) in root cross-sections of the Ni-hyperaccumulator plant Berkheya coddii Rossler. Plants were grown in rhizoboxes containing soil with 125 mg kg−1 Ni. Roots were embedded in resin and cut into sections for LA-ICP-MS analysis. For DMG-staining analysis, fresh root cross-sections were prepared using a microtome. LA-ICP-MS revealed higher Ni concentrations in the cortex (374 ± 66 mg kg−1) than in the stele (210 ± 48 mg kg−1) of the investigated roots. The distribution pattern agreed well with those found by DMG-staining. Higher concentrations of Ni were found in the stele compared to the cortex of roots of the control plants not exposed to elevated soil Ni using both techniques. Our results indicate that an active uptake or ion selection mechanism exists for B. coddii in the absence of available Ni in the rhizosphere. © 2010 Elsevier B.V. All rights reserved.
对植物组织中金属分布格局的定量研究,可为评估金属富集植物在污染土壤修复与改良中的潜力提供重要信息。本研究采用激光剥蚀电感耦合等离子体质谱(LA-ICP-MS)以及丁二酮肟(DMG)染色法,研究了镍(Ni)超富集植物Berkheya coddii Rossler根横切面中Ni的分布格局。植物种植于装有含Ni 125 mg kg−1土壤的根箱中。根系经树脂包埋后切片,用于LA-ICP-MS分析。DMG染色分析则采用切片机制备新鲜根横切面。LA-ICP-MS结果表明,所研究根系皮层中的Ni浓度(374 ± 66 mg kg−1)高于中柱(210 ± 48 mg kg−1)。该分布格局与DMG染色结果高度一致。两种技术均表明,未暴露于高浓度土壤Ni的对照植物根系中,中柱的Ni浓度高于皮层。研究结果表明,在根际缺乏有效态Ni时,B. coddii存在主动吸收或离子选择机制。© 2010 Elsevier B.V. 版权所有。
1Introduction引言
Hyperaccumulator plants may offer a sustainable treatment option for the remediation of metal-contaminated sites (mining activity, refinery emissions, waste disposal, fossil fuel combustion, and agricultural application of pesticides and biosolids) and also an opportunity to mine naturally metal-rich soils i.e., phytomining of ultramafic soils (Brooks et al., 1998; Angle et al., 2001; Li et al., 2003). Berkheya coddii Rossler is a Ni-hyperaccumulator plant that has attracted particular attention because of its high Ni concentration and rapid biomass production. Robinson et al. (1997) reported an annual biomass production of 22 t ha−1 and up to 1% (w:w) Ni in the above-ground biomass. The combination of these two traits is rare and makes this plant suitable for the remediation of Ni-contaminated soils by means of phytoextraction. Even though some aspects of metal uptake by hyperaccumulator plants are already known (Kramer et al., 1996; Hall, 2002), these mechanisms might be different among different plants. Unravelling these mechanisms and interactions is necessary in order to improve phytoextraction and phytomining techniques of Ni from contaminated and naturally-rich soils (McNear et al., 2005).
超富集植物可为金属污染场地(采矿活动、冶炼厂排放、废弃物处置、化石燃料燃烧以及农药和生物固体(污泥)的农业施用)的修复提供一种可持续的处理方案,同时也为开采天然富含金属的土壤,即超基性(蛇纹岩)土壤的植物采矿,提供了机会(Brooks et al., 1998; Angle et al., 2001; Li et al., 2003)。Berkheya coddii Rossler是一种Ni超富集植物,因其Ni浓度高、生物量生产迅速而备受关注。Robinson et al.(1997)报道其年生物量可达22 t ha−1,地上部生物量中Ni含量高达1%(w:w)。这两种性状兼具的情况十分罕见,使该植物适用于通过植物提取修复Ni污染土壤。尽管超富集植物吸收金属的某些方面已为人所知(Kramer et al., 1996; Hall, 2002),但这些机制在不同植物之间可能存在差异。为改进从污染土壤和天然富Ni土壤中提取Ni的植物提取与植物采矿技术,有必要揭示这些机制及其相互作用(McNear et al., 2005)。
Abbreviations: LA-ICP-MS, laser ablation combined with inductively coupled plasma mass spectrometry; DMG, dimethylglyoxime; ICP-OES, inductively coupled plasma optical emission spectrometry; XRF, X-ray fluorescence.
缩写:LA-ICP-MS,激光剥蚀结合电感耦合等离子体质谱;DMG,丁二酮肟;ICP-OES,电感耦合等离子体发射光谱;XRF,X射线荧光。
∗ Corresponding author. Present address: Hydrogeology Department, Helmholtz Centre for Environmental Research - UFZ, Permoserstraße 15, 04318 Leipzig, Germany. Tel.: +49 341 235 1982; fax: +49 341 235 451985.
∗ 通讯作者。现地址:Hydrogeology Department, Helmholtz Centre for Environmental Research - UFZ, Permoserstraße 15, 04318 Leipzig, Germany。电话:+49 341 235 1982;传真:+49 341 235 451985。
E-mail address: ahmad.moradi@ufz.de (A.B. Moradi).
The highest Ni concentration occurs in the shoots of hyperaccumulators. Therefore, shoots and particularly leaf tissue has been the subject of previous investigations (Robinson et al., 2003; Bhatia et al., 2004; Budka et al., 2005; Berazain et al., 2007; de la Fuente et al., 2007; Tappero et al., 2007; Moradi et al., 2009). Proton or nuclear microprobe analyses of B. coddii collected from native South African ultramafic soils showed that Ni was concentrated in the mesophyll and epidermis of the leaves (Mesjasz-Przybylowicz et al., 2001). Although roots are the prime site of uptake of metals, the distribution of Ni in root tissues of B. coddii has rarely been investigated. Most research regarding Ni hyperaccumulation and uptake has been carried out on Ni hyperaccumulator plants of the family Brassicaceae and it is unclear whether other hyperaccumulators have the same uptake mechanism and distribution pattern as the Brassicaceae family (Robinson et al., 2003).
超富集植物中Ni浓度最高的部位是地上部。因此,以往研究主要针对地上部,尤其是叶片组织(Robinson et al., 2003; Bhatia et al., 2004; Budka et al., 2005; Berazain et al., 2007; de la Fuente et al., 2007; Tappero et al., 2007; Moradi et al., 2009)。对采自南非天然超基性土壤的B. coddii进行的质子(核)微探针分析表明,Ni集中于叶片的叶肉和表皮中(Mesjasz-Przybylowicz et al., 2001)。尽管根系是金属吸收的主要部位,但B. coddii根组织中Ni的分布却鲜有研究。关于Ni超富集与吸收的研究大多针对十字花科(Brassicaceae)Ni超富集植物开展,其他超富集植物是否具有与十字花科相同的吸收机制和分布格局尚不清楚(Robinson et al., 2003)。
Methods currently used for spatial localisation of metals within biological tissues are primarily micro analytical techniques based on X-ray emission in response to irradiation with photons or charged particles, including micro-PIXE (micro proton-induced X-ray emission spectroscopy; also known as nuclear microprobe), EDXS (energy dispersive X-ray spectroscopy), Synchrotron X-ray, and Laser-Ablation Inductively-Coupled-Plasma Mass- Spectrometry (LA-ICP-MS) techniques. These methods simultaneously measure and map elemental contents. The choice of suitable analytical method often depends on the investigation level, sampling resolution, detection limit, and accessibility of the technique. Despite the fact that EDXS is a reliable and well-established technique for highly spatially resolved elemental analysis of biological tissues, it has a limited analytical depth and its concentration detection limit (>100–1000 mg kg−1) is insufficient (Ma et al., 2005; Lobinski et al., 2006). Therefore, it has mainly been applied to certain tissues of metal hyperaccumulator plants highly concentrated in metals (Robinson et al., 2003; Broadhurst et al., 2004; Berazain et al., 2007). While micro-PIXE and synchrotron X-ray provide higher analytical sensitivities and penetration than EDXS (Przybylowicz et al., 2001; Lobinski et al., 2006; Fahrni, 2007), their application is limited by accessibility to a proton-beam facility. Laser microprobe mass analysis (LAMMA) showed its potential quite early for analysing thin sections for elemental distribution (Eeckhaoudt et al., 1992). Time of flight SIMS (secondary ion mass spectrometry) was used to study metal distribution between soil, rhizosphere and roots (Martin et al., 2004) and recently, cryo-time-of-flight secondary ion mass spectrometry was applied for element and isotope-specific imaging to monitor transport pathways and processes in the xylem using supplementary sodium and tracers for potassium and rubidium (Metzner et al., 2008). LA-ICP-MS has been suitably applied to determine simultaneously a large number of elements with relatively high detection limits, in the range of �g kg−1, in geological and metallurgical samples (Russo et al., 2002; Hattendorf et al., 2003; Kylander et al., 2007). Recently, LA- ICP-MS was applied successfully to reveal the pattern of copper and zinc in growth zones of cucumber roots (Shi et al., 2009). The spatial resolution of LA-ICP-MS is still insufficient to map the cellular and sub-cellular element distribution, but it benefits from high analytical sensitivity, possibility of isotope ratio measurements, and tracking elemental fluxes by isotope labeling (Pickhardt et al., 2005). Therefore, its application to biological specimens at the tissues-level is emerging (Kindness et al., 2003; Becker et al., 2005; Ulrich et al., 2007; Becker et al., 2008; Kaiser et al., 2008; Shi et al., 2009).
目前用于生物组织内金属空间定位的方法主要是基于光子或带电粒子辐照引发X射线发射的微区分析技术,包括micro-PIXE(微区质子激发X射线发射光谱,亦称核微探针)、EDXS(能量色散X射线光谱)、同步辐射X射线以及激光剥蚀电感耦合等离子体质谱(LA-ICP-MS)等技术。这些方法可同时测定并绘制元素含量分布图。合适分析方法的选择通常取决于研究层次、采样分辨率、检出限以及技术的可获得性。尽管EDXS是对生物组织进行高空间分辨率元素分析的一种可靠且成熟的技术,但其分析深度有限,浓度检出限(>100–1000 mg kg−1)也不够低(Ma et al., 2005; Lobinski et al., 2006)。因此,该技术主要应用于金属超富集植物中金属高度富集的某些组织(Robinson et al., 2003; Broadhurst et al., 2004; Berazain et al., 2007)。micro-PIXE和同步辐射X射线虽比EDXS具有更高的分析灵敏度和穿透深度(Przybylowicz et al., 2001; Lobinski et al., 2006; Fahrni, 2007),但其应用受限于质子束设施的可获得性。激光微探针质量分析(LAMMA)很早就显示出分析薄切片中元素分布的潜力(Eeckhaoudt et al., 1992)。飞行时间SIMS(二次离子质谱)曾被用于研究金属在土壤、根际和根系之间的分布(Martin et al., 2004);近期,冷冻飞行时间二次离子质谱被用于元素和同位素特异性成像,借助补充的钠以及钾和铷示踪剂监测木质部中的运输途径和过程(Metzner et al., 2008)。LA-ICP-MS已成功应用于地质和冶金样品中大量元素的同时测定,其检出限相对较高,处于μg kg−1范围(Russo et al., 2002; Hattendorf et al., 2003; Kylander et al., 2007)。近期,LA-ICP-MS被成功用于揭示黄瓜根系生长区中铜和锌的分布格局(Shi et al., 2009)。LA-ICP-MS的空间分辨率仍不足以绘制细胞及亚细胞水平的元素分布,但其具有分析灵敏度高、可测定同位素比值以及可通过同位素标记追踪元素通量等优势(Pickhardt et al., 2005)。因此,其在组织水平生物样品中的应用正逐渐兴起(Kindness et al., 2003; Becker et al., 2005; Ulrich et al., 2007; Becker et al., 2008; Kaiser et al., 2008; Shi et al., 2009)。
Histochemical staining methods are applied to reveal the elemental distribution for localisation of trace elements within tissues. In particular, dimethylglyoxime (DMG) has been used frequently as histochemical stain for localisation of Ni within tissues of hyperaccumulator plants (Heath et al., 1997; Mizuno et al., 2003; Bhatia et al., 2004; Budka et al., 2005). This method has the potential for qualitative studies of Ni distribution in plant tissues because of its ease of application, low cost of materials and facilities. Although there is usually a risk of artifacts and redistribution of metals inside cells depending on the investigation level and the specific staining procedure used (Bhatia et al., 2004), however, these problems may be alleviated by strict preparation protocols (Gramlich et al., 2007). Such redistribution of metals at the tissue level is less significant than at the sub-cellular level (Budka et al., 2005). Nevertheless, any fixation, sectioning and drying should be performed under low temperature (Budka et al., 2005).
组织化学染色法可用于揭示元素分布,从而定位组织内的微量元素。其中,丁二酮肟(DMG)已被频繁用作组织化学染色剂,以定位超富集植物组织中的Ni(Heath et al., 1997; Mizuno et al., 2003; Bhatia et al., 2004; Budka et al., 2005)。由于操作简便、材料和设备成本低,该方法具有定性研究植物组织中Ni分布的潜力。尽管根据研究层次和所采用的具体染色步骤,通常存在产生假象以及金属在细胞内再分布的风险(Bhatia et al., 2004),但严格的制样规程可缓解这些问题(Gramlich et al., 2007)。在组织水平上,此类金属再分布的影响小于亚细胞水平(Budka et al., 2005)。尽管如此,所有固定、切片和干燥过程均应在低温下进行(Budka et al., 2005)。
The aim of this study was to map Ni distribution in the root cross-sections of B. coddii in order to get a better understanding of its uptake mechanism. We investigated the semi-quantitative spatial distribution of Ni in the root tissues of the hyperaccumulator plant B. coddii using LA-ICP-MS. The distribution pattern and the semi-quantitative Ni concentrations determined by means of this technique were compared to the results of the qualitative method,
本研究旨在绘制B. coddii根横切面中Ni的分布图,以更好地理解其吸收机制。我们采用LA-ICP-MS研究了超富集植物B. coddii根组织中Ni的半定量空间分布。将该技术测得的分布格局和半定量Ni浓度与定性方法
DMG-staining, and bulk analysis by ICP-OES. The advantages and disadvantages of both techniques are discussed in detail.
DMG染色以及ICP-OES整体分析的结果进行了比较,并详细讨论了两种技术的优缺点。
2Materials and methods材料与方法
2.1. Rhizobox experiment and sampling2.1. 根箱试验与采样
Seedlings of B. coddii were grown for three weeks in perlite before transferred to rhizoboxes with a height of 60 cm, a width of 15 cm and a breadth of 1 cm in the main rooting compartment. Dessureault-Rompre et al. (2006) give a detailed description of these boxes. The narrow breadth facilitated sampling of undisturbed roots for the impregnation in resin. Three rhizoboxes were filled with a sandy soil spiked with 125 mg kg−1 Ni, and three with the same unspiked soil as a control. Selected physical and chemical properties of the soil are described in Table 1. We sprayed nickel solution on the soil and stirred the soil well to obtain maximum homogeneity for the spiked soil. The rhizoboxes were irrigated with Hoagland’s nutrient solution (Hoagland and Arnon, 1938). The soil water content was maintained near field capacity (25%) by adding 150–200 ml of solution per week. After transplanting, the rhizoboxes were kept in a climate chamber for 8 weeks with a daily light cycle of 16 h light/8 h darkness, constant humidity (75%) and controlled temperature (16/23 ◦C night/day).
B. coddii幼苗先在珍珠岩中培育3周,然后移栽至根箱中,根箱主生根室高60 cm、宽15 cm、厚1 cm。Dessureault-Rompre et al.(2006)对该根箱有详细描述。较窄的厚度便于采集未扰动的根系用于树脂浸渍。3个根箱装填添加了125 mg kg−1 Ni的砂质土壤,另3个装填相同的未添加Ni土壤作为对照。土壤的部分理化性质见表1。为使添加Ni的土壤达到最大均匀度,将镍溶液喷洒于土壤上并充分搅拌。根箱采用Hoagland营养液(Hoagland and Arnon, 1938)灌溉。每周添加150–200 ml营养液,使土壤含水量保持在田间持水量(25%)附近。移栽后,根箱置于人工气候箱中培养8周,光周期为16 h光照/8 h黑暗,湿度恒定(75%),温度控制为16/23 ◦C(夜/昼)。
The boxes were dismantled carefully in the 8th week. First, undisturbed soil samples containing roots were taken using samplers with dimensions of 2 cm × 2 cm × 5 cm. The samplers were made of aluminum with sharp edges. They could be inserted into the soil easily and soil samples could be taken with least disturbance. These samples were impregnated in resin and analysed using LA-ICP-MS. We carefully separated the remaining roots from the soil and divided them into groups of the same age and diameter. These samples were used for ICP-OES analysis, DMG-staining as well as LA-ICP-MS analysis (impregnated in resin). The separated root samples were washed carefully with deionised water.
第8周时小心拆解根箱。首先,使用尺寸为2 cm × 2 cm × 5 cm的采样器采集含根系的未扰动土壤样品。采样器由铝制成,边缘锋利,可轻松插入土壤,以最小扰动采集土样。这些样品经树脂浸渍后采用LA-ICP-MS分析。将其余根系小心地从土壤中分离,并按相同根龄和直径分组。这些样品用于ICP-OES分析、DMG染色以及LA-ICP-MS分析(树脂浸渍)。分离出的根样用去离子水小心清洗。
For LA-ICP-MS analysis, the soil samples containing undisturbed roots and as well as the separated root samples were first frozen using liquid nitrogen, freeze-dried and then impregnated under vacuum with an epoxy resin (LR White; London Resin Company Limited, Berkshire, GB). This procedure was performed in order to minimize possible Ni migration during sample preparation. After freeze drying, mobilization can be neglected since no electrolyte solution is available for migration. Heat curing under vacuum was used, with a temperature of 50 ◦C for a period of 24 h. Subsequently, the samples were cut into sections with height of 15 mm by means of a diamond saw (Accutom-50; Struers, Ballerup, DK). The surfaces were left unpolished to avoid smearing. Resin blanks were prepared and subsequently analysed in the same way as the root cross-sections. We found no traces of Ni or other metals in the blank samples.
LA-ICP-MS分析时,含未扰动根系的土壤样品以及分离出的根样首先用液氮冷冻,冷冻干燥后在真空条件下用环氧树脂(LR White; London Resin Company Limited, Berkshire, GB)浸渍。该步骤旨在尽量减少制样过程中Ni的可能迁移。冷冻干燥后,由于没有可供迁移的电解质溶液,迁移作用可忽略不计。在真空条件下于50 ◦C热固化24 h。随后,用金刚石切割锯(Accutom-50; Struers, Ballerup, DK)将样品切成高15 mm的切片。切片表面不作抛光,以避免涂抹污染。树脂空白样按与根横切面相同的方法制备和分析,空白样中未检出Ni或其他金属。
For the ICP-OES measurement, the roots were washed with deionised water and dried at 65 ◦C for 48 h prior to digestion with 15 ml HNO3 (65%) at 150 ◦C for 1 h (excluding the heat-up and cooldown time) in Teflon tubes on a heating block (DigiPREP MS, SCP Science, QC, Canada). The digests were checked to be clear and fully digested, then diluted to 20 ml with nanopure water and analysed for Ni, Ca, Mg, and Fe using ICP-OES (Vista-MPX Varian, Australia). We digested and analysed a certified reference material from the Community Bureau of Reference BCR (No. 62, Olea europaea) using ICP-OES for quality assurance. Since there was no plant reference material with high enough Ni contents available, we used a standard addition and obtained recoveries in the range of 88–97% for Ni in the certified reference plant materials compared to the certified and reported values by the Community Bureau of Reference BCR. The detection limit in the extracts was established as 1 �g L−1.
ICP-OES测定时,根样用去离子水清洗,于65 ◦C烘干48 h,然后在加热块(DigiPREP MS, SCP Science, QC, Canada)上的Teflon管中加入15 ml HNO3(65%),于150 ◦C消解1 h(不含升温和冷却时间)。确认消解液澄清且消解完全后,用超纯水定容至20 ml,采用ICP-OES(Vista-MPX Varian, Australia)测定Ni、Ca、Mg和Fe。为进行质量保证,采用ICP-OES对欧洲共同体参考物质局BCR的有证标准物质(No. 62, Olea europaea)进行了消解和分析。由于没有Ni含量足够高的植物标准物质,我们采用了标准加入法,与BCR的认定值和报告值相比,有证植物标准物质中Ni的回收率为88–97%。提取液中的检出限确定为1 μg L−1。
Selected soil physical and chemical properties.
供试土壤部分理化性质。
| pH CEC (cmol(+) kg−1)pH CEC(cmol(+) kg−1) | EC (dS m−1) | Clay:Silt:Sand (%)黏粒:粉粒:砂粒(%) | OC (%) | Ni concentration (mg kg−1)Ni浓度(mg kg−1) | Origin来源 |
|---|---|---|---|---|---|
| 6.4 12 | 0.12 | 5:8:87 | 3.0 | 18.6±4.3 | Eiken, Switzerland |
Samples of the control and Ni-spiked soils were ground using a Retsch RS1 grinder with a tungsten carbide ball and ring, pressed into pellets and analysed by X-ray fluorescence (X-Lab 2000, Spectro, Kleve, Germany) for major elements, including Ca, Mg, Fe, and Ni. The analytical quality of the XRF measurements was routinely controlled by use of a certified standard sample (D133, MCACAL).
对照土壤和添加Ni土壤的样品使用配有碳化钨球和环的Retsch RS1研磨机研磨,压制成片后采用X射线荧光仪(X-Lab 2000, Spectro, Kleve, Germany)测定包括Ca、Mg、Fe和Ni在内的主要元素。XRF测定的分析质量通过有证标准样品(D133, MCACAL)进行常规控制。
2.2. LA-ICP-MS analysis2.2. LA-ICP-MS分析
The LA-ICP-MS system consisted of a 193 nm neodymiumdoped yttrium aluminum garnet laser (New Wave Research, Huntingdon, UK) for sampling and a quadrupole inductively coupled plasma mass spectrometer (ICP-Q-MS, ELAN 6100 DRC-e, PerkinElmer, Ontario, Canada), for analysing the ablated sample. The ablation cell was coupled via a 50-cm PFA-tubing to the ICPtorch. Argon was used as carrier gas
LA-ICP-MS系统由用于采样的193 nm掺钕钇铝石榴石激光器(New Wave Research, Huntingdon, UK)和用于分析剥蚀样品的四极杆电感耦合等离子体质谱仪(ICP-Q-MS, ELAN 6100 DRC-e, PerkinElmer, Ontario, Canada)组成。剥蚀池通过50 cm长的PFA管与ICP炬管相连。以氩气作为载气
The surfaces of the cross-sections were pre-ablated to eliminate possible contamination caused by the cutting process. For the pre-ablation, we used line scan mode (ablating along a line) with a laser beam diameter of 120 �m, a laser fluence of 6 J cm−2 and a scan speed of 20 �m s−1 ablating a depth of about 5 �m. After pre-ablation, the samples were scanned using a laser fluence of 15 J cm−2 at a frequency of 10 Hz, a laser beam diameter of 75 �m and a scan speed of 5 �m s−1. The frequency of the laser was kept at 10 Hz. This leads to a spatial resolution of about 75 �m × 10 �m. The sampling depth was about 10 �m and varied with the density of the tissue. This variation was overcome by using a homogenously occurring element (e.g. carbon) as internal normalization standard leading thus to a gravimetrical measurement quantity in �g g−1 instead of a volumetric quantity in �g cm−3. The resulting inhomogeneities of the ablation conditions due to tissue density variation are considered in the uncertainty calculation. Depending on the diameter of the root cross-section, each cross-section was ablated five or six times along parallel patterns to cover the entire root cross-section area.
为消除切割过程可能造成的污染,对横切面表面进行了预剥蚀。预剥蚀采用线扫描模式(沿直线剥蚀),激光束直径为120 μm,激光能量密度为6 J cm−2,扫描速度为20 μm s−1,剥蚀深度约5 μm。预剥蚀后,以15 J cm−2的激光能量密度、10 Hz的频率、75 μm的激光束直径和5 μm s−1的扫描速度对样品进行扫描。激光频率保持在10 Hz,由此得到约75 μm × 10 μm的空间分辨率。采样深度约为10 μm,并随组织密度而变化。通过采用均匀分布的元素(如碳)作为内标进行归一化,克服了这一变化,从而得到以μg g−1表示的质量计量值,而非以μg cm−3表示的体积计量值。组织密度变化导致的剥蚀条件不均一性已在不确定度计算中予以考虑。根据根横切面直径的不同,每个横切面沿平行路径剥蚀5次或6次,以覆盖整个根横切面区域。
An element with a known concentration that is homogeneously distributed in reference material and the samples is used for internal normalization of the signal to correct for any differences in ablation rates (Longerich et al., 1996, 1997). Thus, a response factor (Cromwell and Arrowsmith, 1995; Motelica-Hieno and Donard, 2001; Resano et al., 2005) for each analyte relative to the internal standard in the reference material can be calculated. The response factor reflects sensitivity differences between the analyte, E, and the element used as internal standard. Assuming that the response factor is the same for reference material and the sample, the concentration of an element E in the sample can be calculated as follows:
采用在标准物质和样品中均匀分布且浓度已知的元素对信号进行内标归一化,以校正剥蚀速率的差异(Longerich et al., 1996, 1997)。据此,可计算标准物质中各分析元素相对于内标的响应因子(Cromwell and Arrowsmith, 1995; Motelica-Hieno and Donard, 2001; Resano et al., 2005)。响应因子反映了分析元素E与内标元素之间的灵敏度差异。假设标准物质与样品的响应因子相同,则样品中元素E的浓度可按下式计算:

where CIS Sam is the independently measured concentration of the internal standard in the sample, CE Ref/CIS Ref is the ratio of the concentrations of analyte E and internal standard IS in the certified reference material, and IE Sam/IIS Sam and IIS Ref/IE Ref are the intensity ratios measured in sample and reference material, respectively.
式中,CIS Sam为独立测定的样品中内标的浓度,CE Ref/CIS Ref为有证标准物质中分析元素E与内标IS的浓度比,IE Sam/IIS Sam和IIS Ref/IE Ref分别为样品和标准物质中测得的强度比。
We used the response factor given in the Elan DRC-e software to calculate the concentrations in the samples. The concentration of analyte, E, is calculated using the relative sensitivity coefficient (RSC) from the ELAN DRC-e ICP-MS:
采用Elan DRC-e软件给出的响应因子计算样品中的浓度。分析元素E的浓度利用ELAN DRC-e ICP-MS的相对灵敏度系数(RSC)计算:

Multiple isotopes per element were measured if accessible for each element to monitor possible interferences. Generally, we used carbon as the internal standard since it is the major element present in the root matrix (Prohaska et al., 1998). Nonetheless, the use of carbon showed limitations in the used setup which were: (i) the relatively high background signal of carbon and (ii) the low sensitivity of C of the quadrupole ICP-MS. Major reason for the latter is the fact that the Elan does not apply an extraction voltage to the generated ions. Thus, we observed a significant diffusion of the light carbon ions and a signal to noise ratio, which is not satisfactory for small signals (i.e., resulting from small spot diameters). Nonetheless, we observed at larger spot sizes (<100 �m) that the signals at mass 42 and 44 are evenly distributed along with the C signal with a relative standard deviation (RSD) across the single root surfaces of less than 8%. Both masses refer to Ca and since the ratios of these masses correspond to the natural abundances, interferences can be excluded. Therefore, we used finally 44Ca as internal standard for the analysis of Ni, Mg, and Fe. The uncertainty of the relative variation of the elemental content (semi-quantitative data) is about 10% whereas the quantitative data has an uncertainty of about 25%. Uncertainties were calculated according to EURACHEM using a dedicated software (Gum Workbench Pro, Metrodata, Danish Technological institute, Danmark). Total Ca of the roots was determined using ICP-OES.
为监测可能的干扰,对各元素在条件允许时测定了多个同位素。通常以碳作为内标,因为碳是根系基质中的主要元素(Prohaska et al., 1998)。然而,在所用装置中使用碳存在以下局限:(i)碳的背景信号相对较高;(ii)四极杆ICP-MS对C的灵敏度较低。后者的主要原因是Elan未对产生的离子施加引出电压。因此,我们观察到轻质碳离子显著扩散,且信噪比对于小信号(即由小光斑直径产生的信号)而言不够理想。尽管如此,我们观察到在较大光斑尺寸(<100 μm)下,质量数42和44处的信号与C信号同步均匀分布,单个根表面的相对标准偏差(RSD)小于8%。这两个质量数均对应Ca,且其比值与天然丰度相符,因此可排除干扰。因此,最终采用44Ca作为Ni、Mg和Fe分析的内标。元素含量相对变化(半定量数据)的不确定度约为10%,而定量数据的不确定度约为25%。不确定度按照EURACHEM方法使用专用软件(Gum Workbench Pro, Metrodata, Danish Technological institute, Danmark)计算。根系的全Ca采用ICP-OES测定。
2.3. DMG staining and image processing2.3. DMG染色与图像处理
The risk of artifacts from Ni redistribution in the course of the staining procedure depends on the solvent and the time between DMG application and imaging. We tested various solvents that previous studies have proposed, on plant samples that were prepared using similar method. Based on these preliminary tests, we selected a DMG solution containing 1 g DMG and 0.18 g KOH dissolved in 100 ml of 0.025 M Na2B4O7, 10 H2O solution (Merck, Darmstadt, Germany). This solution gave the best staining quality while preserving plant structure (Gramlich et al., 2007). Comparing various sample preparation methods and immersion times, the procedure that gave the best results was as follows: A droplet of 30 �l of the DMG solution was applied to freshly cut root cross sections of 150 �m thickness. Immediately after adding the droplet, the cross section was imaged using light microscopy and photographed using a digital camera (Canon Power Shot A640).
染色过程中Ni再分布产生假象的风险取决于溶剂以及从施加DMG到成像之间的时间。我们在采用类似方法制备的植物样品上测试了以往研究提出的多种溶剂。根据这些预试验结果,选用了将1 g DMG和0.18 g KOH溶于100 ml 0.025 M Na2B4O7·10H2O溶液(Merck, Darmstadt, Germany)中配制的DMG溶液。该溶液在保持植物结构的同时染色效果最佳(Gramlich et al., 2007)。通过比较多种样品制备方法和浸泡时间,效果最佳的步骤如下:将30 μl DMG溶液滴加于厚度为150 μm的新鲜根横切面上。滴加后立即用光学显微镜对横切面成像,并用数码相机(Canon Power Shot A640)拍照。
Principal component analysis was used to separate the signal originating from the dye (DMG-Ni stain) from the rest of the image in order to obtain a qualitative measure of DMG-Ni stain in the root cross-section. Inspections of collocation histograms for the color channel combinations Red–Green (RG), Red–Blue (RB), and Green–Blue (GB) showed that the RG combination was the best suited for this separation. For the principal component analysis, we followed the procedure explained by Jain (1989) and known as Karhunen-Loewe transformation. The procedure uses the eigenvector matrix derived from the covariance matrix of the two color channels as a linear transformation matrix for the two channels to obtain the independent basis images. The basis image corresponding to the greater eigenvalue contains the information of the DMG-Ni stain.
采用主成分分析将染料(DMG-Ni染色)信号与图像其余部分分离,以获得根横切面中DMG-Ni染色的定性量度。对红–绿(RG)、红–蓝(RB)和绿–蓝(GB)颜色通道组合的共位直方图检查表明,RG组合最适合用于该分离。主成分分析按照Jain(1989)所述的方法进行,即Karhunen-Loewe变换。该方法以两个颜色通道协方差矩阵导出的特征向量矩阵作为线性变换矩阵,对两个通道进行变换,得到相互独立的基图像。对应较大特征值的基图像包含DMG-Ni染色的信息。
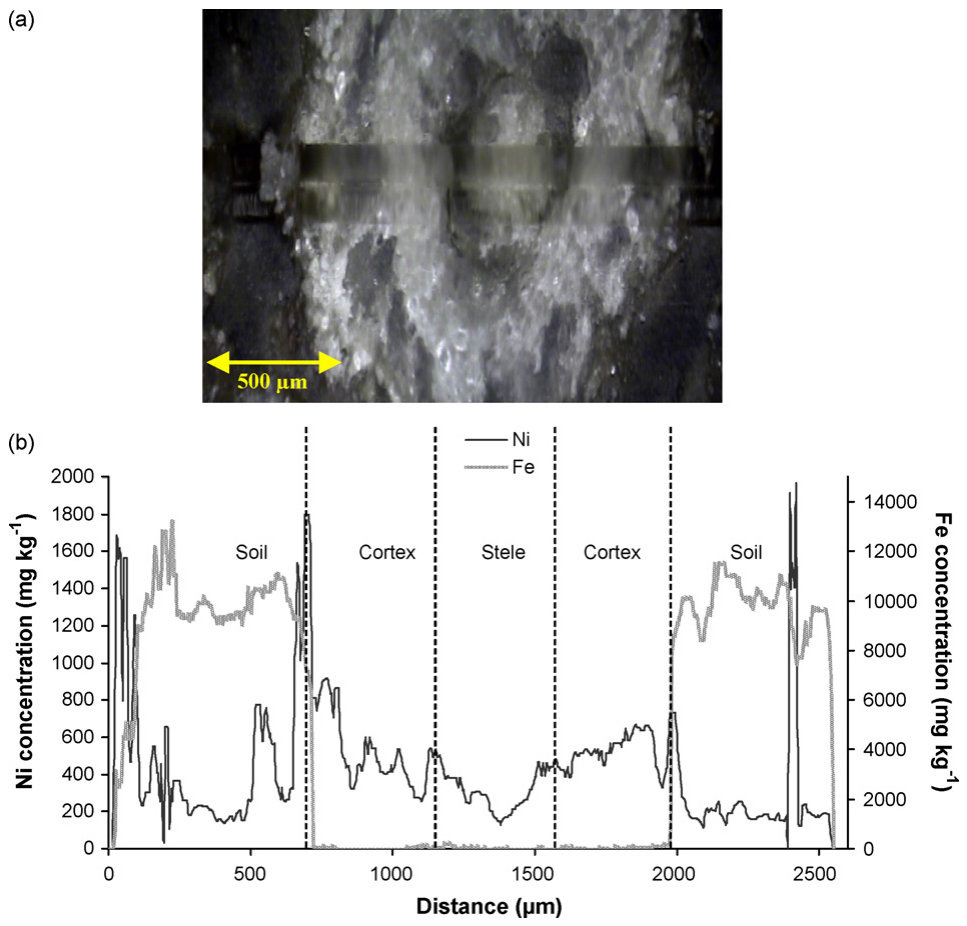
Image analysis was carried out using MATLAB (Matlab, 2007). All the images were slightly smoothed using a median filter of 3 × 3. All statistical comparisons were done using analysis of variance ANOVA, while the confidence coefficient was set at 0.05.
图像分析采用MATLAB(Matlab, 2007)进行。所有图像均使用3 × 3中值滤波器进行轻度平滑。所有统计比较均采用方差分析(ANOVA),显著性水平设为0.05。
concentration averaged around 500 mg kg−1 in the cortex and less than 300 mg kg−1 in the stele.
浓度在皮层中平均约为500 mg kg−1,在中柱中则低于300 mg kg−1。
3.2. Analysis of DMG-stained root cross-sections3.2. DMG染色根横切面分析
3Results结果
3.1. Analysis using LA-ICP-MS scan-lines3.1. LA-ICP-MS扫描线分析
Fig. 1a shows a laser image with two adjacent laser scan-lines passing through the cross-section of a B. coddii root grown in the soil containing 125 mg kg−1 Ni. The cortex and the stele of the root are clearly visible. The Ni concentration along one of the two laser lines is shown in Fig. 1b. The nickel concentration varied from 100 to 1800 mg kg−1 in the soil adjacent to the root due to the heterogeneous distribution of soil particles and pores. The average concentration was higher inside the roots and less variable than in the soil. We used the Fe: Ni ratio to locate the epidermis. Inside the root, the iron concentration dropped to a value below 100 mg kg−1, while the Ni concentration stayed above the average value of the soil Ni concentration. In addition, we observed an increase of the Fe concentration near the epidermis before it started to decline inside the root. Similar Fe peaks were monitored adjacent to the epidermis of the roots that had been washed in deionised water before being embedded in resin. The iron can be attributed to residual soil micro particulates attached to the surface. Some soil particles may not be removable because of the roughness of the root surface and micro particles may remain trapped in root fractures while growing (Tinker and Nye, 2000). The minimum Ni concentration within the root was measured in the stele in the centre of the root. The Ni
图1a为穿过生长于含125 mg kg−1 Ni土壤中的B. coddii根横切面的两条相邻激光扫描线的激光图像。根的皮层和中柱清晰可见。图1b显示了沿其中一条激光线的Ni浓度。由于土壤颗粒和孔隙分布不均一,根系邻近土壤中的镍浓度在100至1800 mg kg−1之间变化。根内的平均浓度较高,且变异性小于土壤。我们利用Fe:Ni比值来定位表皮。在根内,铁浓度降至100 mg kg−1以下,而Ni浓度仍高于土壤Ni浓度的平均值。此外,我们观察到Fe浓度在表皮附近升高,随后在根内开始下降。在包埋前经去离子水清洗的根系表皮附近,也监测到了类似的Fe峰。这些铁可归因于附着在根表面的残留土壤微颗粒。由于根表面粗糙,部分土壤颗粒可能无法去除,且微颗粒可能在根系生长过程中被截留于根的裂隙中(Tinker and Nye, 2000)。根内Ni浓度最低值出现在根中心的中柱。Ni
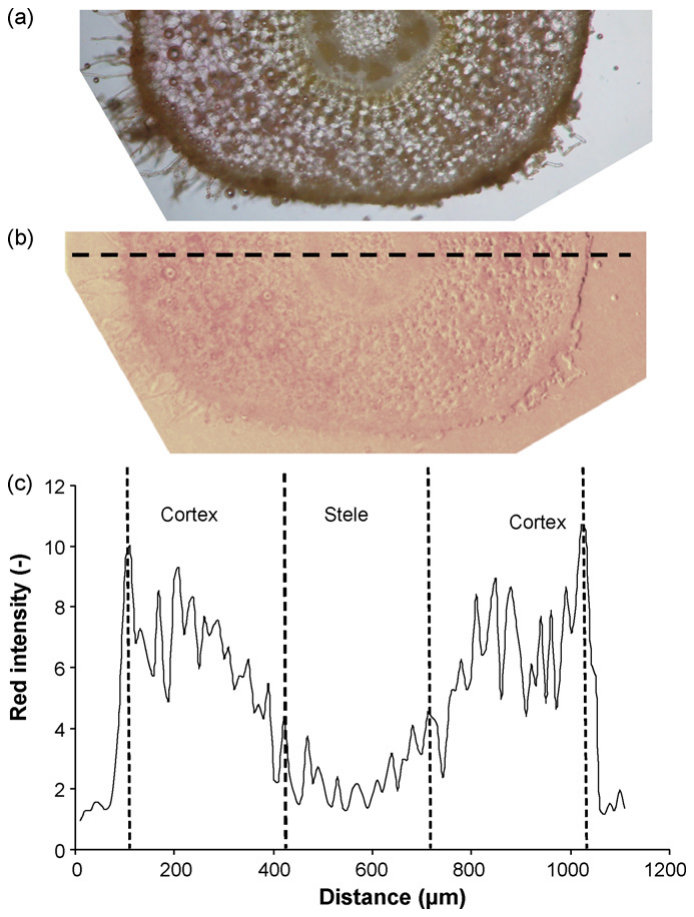
Fig. 2 shows a cross-section of a root grown in the soil containing 125 mg kg−1 Ni, with almost the same diameter as the root in Fig. 1. The root in Fig. 2a was freshly cut and stained with DMG. The red area shows where the Ni-DMG complexes were located in the root. Fig. 2a shows that the cortex was stained more intensively than the stele. Within the cortex, the red intensity was higher in the apoplastic space within and around the cell walls than in the cytoplasm. Transformation of the image by Karhunen-Loewe transformation resulted in Fig. 2b. The red intensity in this image qualitatively corresponds to the intensity of Ni-DMG complex. The overall Ni profiles were similar in both Fig. 2c and Fig. 1c. In other words, the average Ni concentration and red intensity were higher in the cortex than in the stele. The stele had the lowest Ni concentration and red intensity while the epidermis had the highest Ni concentration and red intensity. However, there was a sharp contrast between the red intensity of cortex and stele in Fig. 2c. Conversely, the Ni concentration profile in laser cross-section (Fig. 1c) was less homogeneous and the difference in average Ni concentration between the cortex and the stele was not as sharp as in Fig. 2 c.
图2为生长于含125 mg kg−1 Ni土壤中的根的横切面,其直径与图1中的根几乎相同。图2a中的根为新鲜切片并经DMG染色。红色区域显示了根中Ni-DMG络合物的位置。图2a表明,皮层的染色强于中柱。在皮层内,细胞壁内部及周围质外体空间的红色强度高于细胞质。经Karhunen-Loewe变换后得到图2b。该图像中的红色强度定性地对应于Ni-DMG络合物的强度。图2c和图1c中的总体Ni剖面相似。换言之,皮层中的平均Ni浓度和红色强度均高于中柱。中柱的Ni浓度和红色强度最低,而表皮的Ni浓度和红色强度最高。然而,图2c中皮层与中柱的红色强度对比鲜明。相反,激光横切面中的Ni浓度剖面(图1c)均一性较差,皮层与中柱之间平均Ni浓度的差异不如图2c中明显。
3.3. Two-dimensional map of Ni in root cross-section3.3. 根横切面Ni的二维分布图
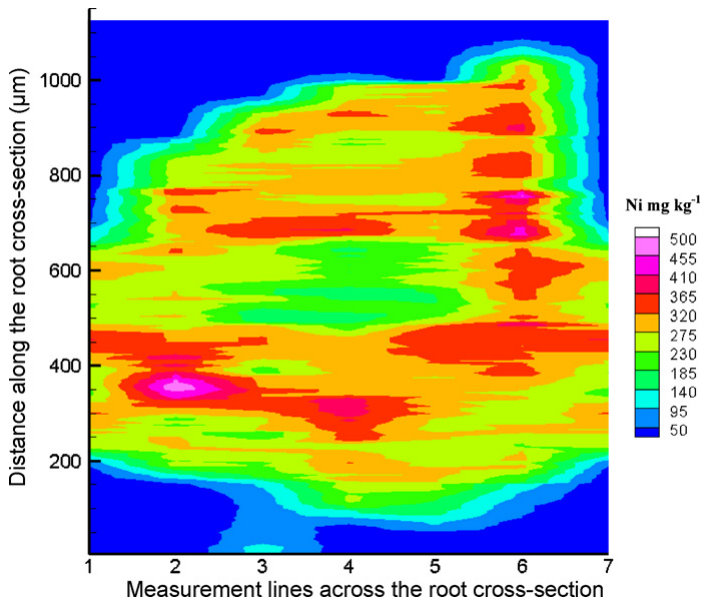
Seven parallel laser scan-lines were recorded from a root cross-section of the 125 mg kg−1 Ni treatment to cover the entire root cross-section area. Fig. 3 shows an example of a 2-dimensional map of the Ni concentration of the root cross-section calculated from these scan-lines. The nickel concentrations varied from 100–500 mg kg−1. The highest concentrations of Ni occurred in small spots that were distributed heterogeneously within the cortex. The stele showed a more homogenous distribution of Ni pattern and had lower concentration of Ni than the cortex. This observation was reproducible throughout five measured root cross sections.
在125 mg kg−1 Ni处理的根横切面上记录了7条平行激光扫描线,以覆盖整个根横切面区域。图3为由这些扫描线计算得到的根横切面Ni浓度二维分布图示例。镍浓度在100–500 mg kg−1之间变化。Ni浓度最高值出现在皮层内不均匀分布的小斑点中。中柱中Ni的分布格局更为均一,且Ni浓度低于皮层。该观察结果在所测的5个根横切面中均可重现。
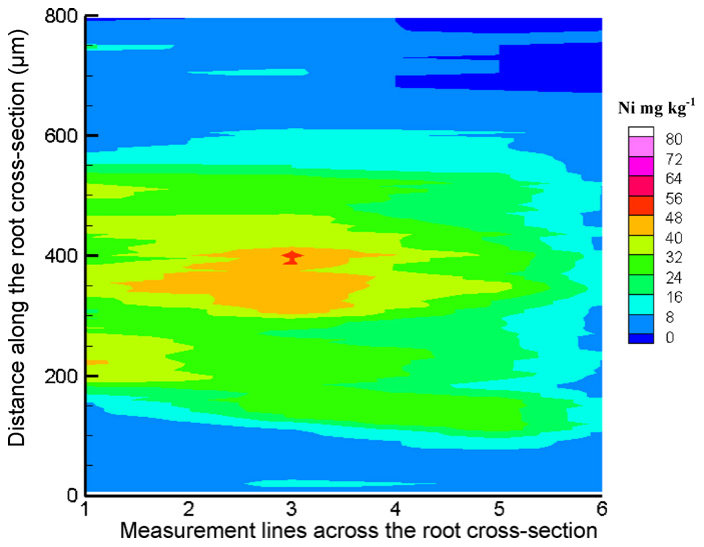
Likewise, six laser scan-lines were recorded from a cross-section of a root grown in the control soil. The resulting 2-D map of Ni concentration is shown in Fig. 4. Unlike the roots in the spiked soil, the highest concentration of Ni appeared in the stele. The average Ni concentration was around 50 mg kg−1 compared to 22 mg kg−1 in the cortex. Similar trend was observed for all five replicates.
同样,在生长于对照土壤中的根横切面上记录了6条激光扫描线。所得Ni浓度二维分布图见图4。与添加Ni土壤中的根不同,Ni浓度最高值出现在中柱。中柱平均Ni浓度约为50 mg kg−1,而皮层为22 mg kg−1。所有5个重复均观察到类似趋势。
3.4. Comparing LA-ICP-MS and DMG staining results3.4. LA-ICP-MS与DMG染色结果的比较
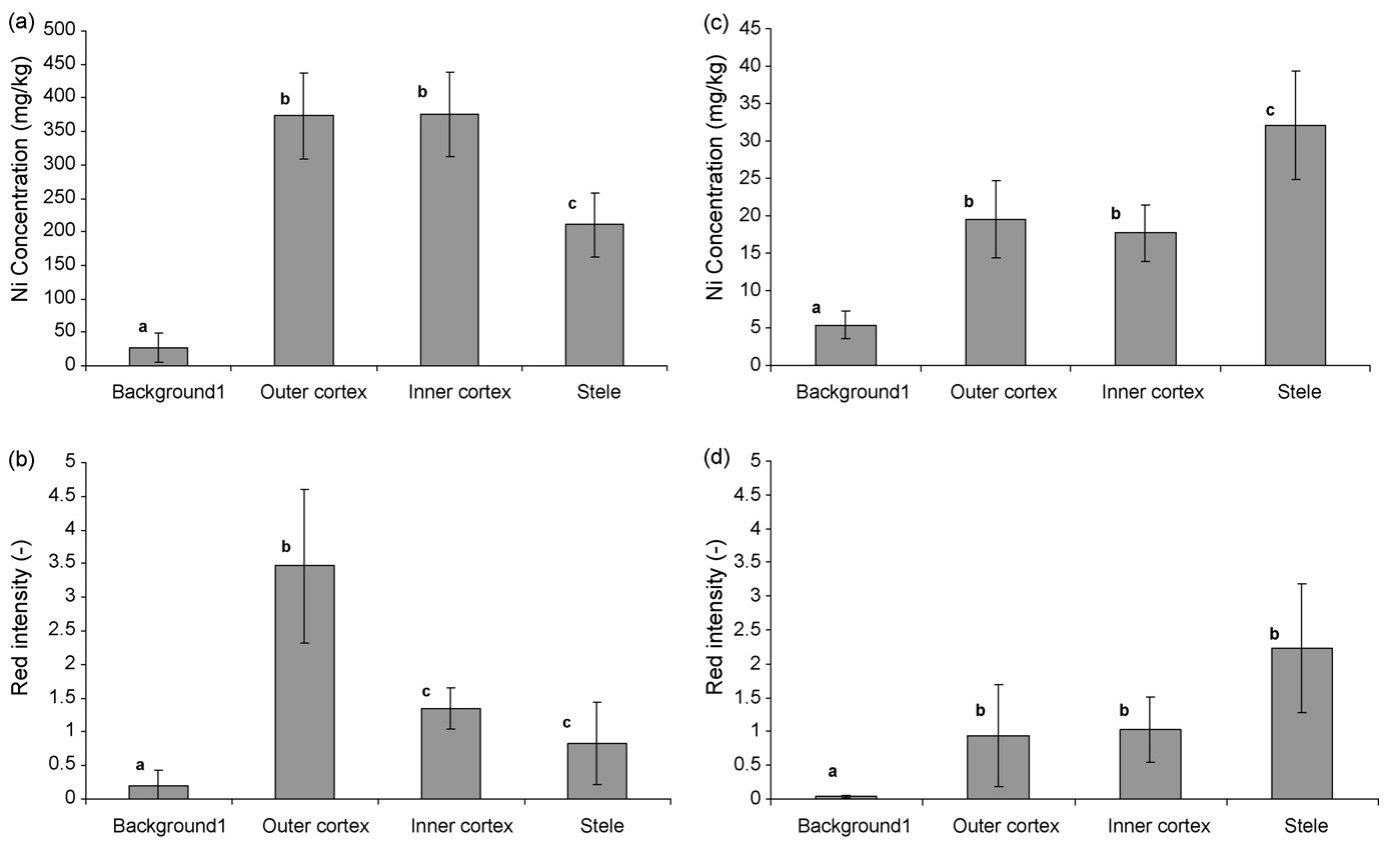
Fig. 5 shows a comparison between the Ni concentrations measured by means of LA-ICP-MS and the red intensities of the DMG-staining for both control and Ni-treated roots. Five replicates for each treatment were used to calculate the average and standard deviation of the Ni concentration and red intensity of various tissues of the roots. The cortex was divided equally into the outer and inner cortex, while the overall average of the stele was calculated. The background refers to either the resin around the roots in laser ablation experiment or an open area without any sample in DMG-staining experiment. Root diameters ranged from 1 to 1.5 mm.图5比较了对照和Ni处理根系中LA-ICP-MS测得的Ni浓度与DMG染色的红色强度。每个处理采用5个重复计算根系各组织Ni浓度和红色强度的平均值与标准偏差。皮层被等分为外皮层和内皮层,而中柱则计算总体平均值。背景在激光剥蚀试验中指根周围的树脂,在DMG染色试验中指无样品的空白区域。根直径为1至1.5 mm。
LA-ICP-MS measurements of roots of the Ni-spiked treatment (Fig. 5a) showed no significant difference (based on analysis of variance, ANOVA) between the outer and inner cortex (373 ± 63 and 375 ± 70 mg kg−1, respectively), while the Ni concentrations of the stele was significantly lower (210 ± 48 mg kg−1). In the DMG-stained roots of the same treatment (Fig. 5b), however, the red intensity decreased from the outer to the inner cortex. While there was no significant difference between the inner cortex and the stele, they both had significant lower intensities than the outer cortex. Again, the stele had higher intensities than the background.
添加Ni处理根系的LA-ICP-MS测定结果(图5a)表明,外皮层与内皮层之间无显著差异(基于方差分析,ANOVA)(分别为373 ± 63和375 ± 70 mg kg−1),而中柱的Ni浓度显著较低(210 ± 48 mg kg−1)。然而,在同一处理经DMG染色的根系中(图5b),红色强度由外皮层向内皮层递减。内皮层与中柱之间无显著差异,但二者的强度均显著低于外皮层。同样,中柱的强度高于背景。
In contrast to the Ni-spiked treatment, the roots grown in the control soil (Fig. 5c), had higher Ni concentrations in the stele (32 ± 7 mg kg−1) than in the cortex, while there was no significant difference between the outer and inner cortex (19 ± 5 and 17 ± 3 mg kg−1, respectively). There was no significant difference between the cortex and the stele for the red intensity in the DMG-stained roots from the control soil. However, the control samples had significantly higher red intensities than the background (Fig. 5d). A higher Ni background was measured in the resin adjacent to the roots grown in the Ni-spiked soil compared to the control soil (5 ± 2 and 27 ± 22 mg kg−1, respectively). This effect can be explained by Ni in the soil particles attached to the roots.
与添加Ni处理相反,生长于对照土壤中的根系(图5c)中柱的Ni浓度(32 ± 7 mg kg−1)高于皮层,而外皮层与内皮层之间无显著差异(分别为19 ± 5和17 ± 3 mg kg−1)。对照土壤中经DMG染色的根系,皮层与中柱的红色强度无显著差异。但对照样品的红色强度显著高于背景(图5d)。与对照土壤相比,生长于添加Ni土壤中的根系邻近树脂中测得的Ni背景值较高(分别为5 ± 2和27 ± 22 mg kg−1)。这一现象可由附着于根系的土壤颗粒中的Ni来解释。
3.5. Total Ni content in roots measured by LA-ICP-MS, ICP-OES and XRF3.5. LA-ICP-MS、ICP-OES和XRF测定的根系全Ni含量
Table 2 summarizes the results of the elemental analysis of the soil and roots using XRF, ICP-OES and LA-ICP-MS. The values obtained by LA-ICP-MS were weighted by the area contribution of each tissue to the root cross-section area. All results show high variation and thus a large standard deviation. This is due to heterogeneity of the sample material. There was no significant difference表2汇总了采用XRF、ICP-OES和LA-ICP-MS对土壤和根系进行元素分析的结果。LA-ICP-MS所得数值按各组织占根横切面面积的比例进行加权。所有结果变异均较大,因而标准偏差较大,这是由样品材料的不均一性所致。对于生长于对照土壤中的根系,三种不同技术测得的Ni值之间
(ANOVA at 0.05 level) between the Ni values for roots grown in the control soil measured by the three different techniques. However the results for ICP-OES measurements were extremely variable (29.2 ± 27). This can be explained mainly by unsatisfactory separation of soil particles from the roots prior to digestion and is in accordance with our observation of the Ni background in the resin adjacent to the root surface. Similar to the control soil, there was no significant difference between the LA-ICP-MS and the ICP-OES values for the Ni-spiked root (ANOVA at 0.05 level). LA-ICP-MS gave significantly smaller values for Fe compared to ICP-OES. This may have been caused again by incomplete separation of soil particles from the roots prior to digestion and subsequent ICP-OES analysis, as well. The Mg concentration in the roots was in good agreement for both ICP-OES and LA-ICP-MS and the results overlapped within the standard deviation.
无显著差异(ANOVA,0.05水平)。但ICP-OES的测定结果变异极大(29.2 ± 27)。这主要可由消解前土壤颗粒与根系分离不彻底来解释,这与我们在根表面邻近树脂中观察到的Ni背景相一致。与对照土壤类似,添加Ni处理根系的LA-ICP-MS与ICP-OES测定值之间无显著差异(ANOVA,0.05水平)。LA-ICP-MS测得的Fe值显著低于ICP-OES。这同样可能是由于消解及随后的ICP-OES分析前土壤颗粒与根系分离不完全所致。根系中Mg浓度的ICP-OES与LA-ICP-MS测定结果吻合良好,二者在标准偏差范围内重叠。
Elemental concentrations (mg kg−1) of the roots and soil using various techniques. Values in parenthesis show standard deviations from the mean.
采用不同技术测定的根系和土壤元素浓度(mg kg−1)。括号内数值为平均值的标准偏差。
| XRF | ICP-OES | LA-ICP-MS* | |||
|---|---|---|---|---|---|
| Ni | Control | Soil Root | 18.6 (4.3) n.q. | n.q. *a 29.2 (27) | n.q. a 22.2 (5.4) |
| Ni-spiked | Soil Root | 113.8 (29) n.q. | n.q. a 465.1 (70.1) | n.q. a 333.2 (60) | |
| Fe | Soil | 14180 (548) | n.q. | n.q. | |
| ~~Control~~ | Root | n.q. | ~~a ~~80.3 (67) | ~~a ~~24.2 (44) | |
| Ni-spiked | Soil Root | 14330 (320) n.q. | n.q. a 143.6 (38) | n.q. b 32.3 (53.7) | |
| Mg | Soil | 4260 (170) | n.q. | n.q. | |
| Control | Root | n.q. | a 1954.5 (841) | a 2243 (393) | |
| Niikd | Soil | 4560 (216) | n.q. | n.q. | |
| -spe | Root | n.q. | a 2115.3 (1121) | a 2940 (270) |
*Averages were calculated based on the area contribution of each tissue for roots. **n.q.: not quantified. ***In each row, different letters represent significance at 0.05 level.
*根系的平均值按各组织的面积占比计算。**n.q.:未定量。***同一行中不同字母表示在0.05水平上差异显著。
4Discussion讨论
We obtained a similar pattern of Ni distribution in the root tissue using two independent techniques. This indicates that either redistribution did not greatly affect our results, or the redistribution was the same for both methods, which is unlikely. Bhatia et al. (2004) reported that DMG application lead to Ni redistribution inside the plant tissue. The staining procedure they used involved soaking the plant tissue in DMG solution (1% solution in 95% ethanol) over night. Ethanol is very damaging to the tissue and increases the risk of Ni redistribution especially if applied for a rather long time. Our procedure included no ethanol and the time given to the DMG solution to react with Ni in the tissue was less than half a minute before the image was taken. Such a short exposure time reduces both the downward penetration and lateral redistribution of DMG-Ni complex in the tissue. Although such redistributions might be significant at the cellular and sub-cellular level, but it is unlikely to be considerable at the tissue level.
采用两种独立技术,我们获得了根组织中相似的Ni分布格局。这表明,要么再分布对结果影响不大,要么两种方法的再分布程度相同,而后者的可能性较小。Bhatia et al.(2004)报道,施加DMG会导致植物组织内Ni的再分布。他们采用的染色步骤是将植物组织在DMG溶液(1%溶液,溶于95%乙醇)中浸泡过夜。乙醇对组织的破坏性很强,会增加Ni再分布的风险,尤其是在施用时间较长的情况下。我们的步骤不含乙醇,且在成像前DMG溶液与组织中Ni的反应时间不足半分钟。如此短的暴露时间降低了DMG-Ni络合物在组织中的向下渗透和横向再分布。尽管此类再分布在细胞和亚细胞水平上可能较为显著,但在组织水平上不太可能有明显影响。
DMG staining provided qualitative data on the distribution of Ni in the root cross-sections. DMG might not be able to stain some tightly bound (or more likely) occluded Ni in some tissues; nevertheless, it represents the biologically active Ni. DMG strongly bonds to Ni. Its log stability constant is reported to be 17.2 which is comparable to strong complexing agents such as EDTA with log stability constant of 18.4 (Saito and Moffett, 2001). Therefore, it could be used to differentiate between different types of Ni in biological tissues.
DMG染色提供了根横切面中Ni分布的定性数据。DMG可能无法对某些组织中紧密结合的(或更可能是被包蔽的)Ni进行染色;尽管如此,它代表了具有生物活性的Ni。DMG与Ni结合牢固,其稳定常数对数值为17.2,与EDTA等强络合剂相当(EDTA的稳定常数对数值为18.4)(Saito and Moffett, 2001)。因此,可利用DMG区分生物组织中不同类型的Ni。
LA-ICP-MS method provided semi-quantitative data on the distribution of metals within the root cross-sections of B. coddii. The spatial resolution of the data was sufficient for root studies at tissue level. The laser scan-lines gave a resolution of 75 �m × 10 �m. The spatial resolution was fine in the direction of the scan-lines, but coarse in the perpendicular direction because of the scan width. The width was selected in order to receive sufficient signal intensities. Nonetheless, narrower scan lines can be a significant improvement in lateral resolution but this also means the need for combination with ICP-MS instruments with higher sensitivity. Moreover, matrix artifacts due to resin embedding could challenge the accuracy and precision of the technique at resolutions finer than tissue level. Staining the root cross-section with DMG revealed a comparable pattern of Ni distribution in the root cross-sections (compare Figs. 1 and 2). Although the DMG-staining had a higher spatial resolution in all directions than LA-ICP-MS, it provided only qualitative information.
LA-ICP-MS方法提供了B. coddii根横切面中金属分布的半定量数据。数据的空间分辨率足以满足组织水平的根系研究。激光扫描线的分辨率为75 μm × 10 μm。在扫描线方向上空间分辨率较高,但在垂直方向上由于扫描宽度而较粗。选择该宽度是为了获得足够的信号强度。尽管如此,更窄的扫描线可显著提高横向分辨率,但这也意味着需要结合灵敏度更高的ICP-MS仪器。此外,在分辨率高于组织水平时,树脂包埋引起的基体假象可能影响该技术的准确度和精密度。用DMG对根横切面染色揭示了相似的根横切面Ni分布格局(比较图1和图2)。尽管DMG染色在各方向上的空间分辨率均高于LA-ICP-MS,但其仅能提供定性信息。
Both techniques showed that the Ni concentration was higher in the cortex of roots grown in the Ni-spiked soil than in the stele. The DMG-staining experiment showed that the concentrations of Ni decreased from the outer cortex towards the inner cortex and the stele. Similar result was reported by Mesjasz-Przybylowicz et al. (2007) in the roots of another Ni hyperaccumulator plant, Senecio coronatur. The DMG-staining experiment revealed that the Ni was more concentrated in the apoplastic area than in the cytoplasm. As supported by other investigations (Gramlich et al., 2007; Redjala et al., 2009), this proves that apoplastic pathway is the main means of Ni transport in the cortex. The role of the endodermis is to provide a barrier to the apoplastic pathway (Marschner, 1995). This affects the passage of all solutes including Ni. Our results are consistent with what is known about the endodermis. This information could not be obtained by LA-ICP-MS because of the spatial resolution we chose and the physical shrinkage of the tissue that resulted from sample preparation.
两种技术均表明,生长于添加Ni土壤中的根系,皮层的Ni浓度高于中柱。DMG染色试验表明,Ni浓度由外皮层向内皮层和中柱递减。Mesjasz-Przybylowicz et al.(2007)在另一种Ni超富集植物Senecio coronatur的根系中也报道了类似结果。DMG染色试验显示,Ni在质外体区域的富集程度高于细胞质。结合其他研究的支持(Gramlich et al., 2007; Redjala et al., 2009),这证明质外体途径是Ni在皮层中运输的主要方式。内皮层的作用是对质外体途径形成屏障(Marschner, 1995),这会影响包括Ni在内的所有溶质的通过。我们的结果与目前对内皮层的认识相一致。由于所选的空间分辨率以及制样导致的组织物理收缩,LA-ICP-MS无法获得这一信息。
Two-dimensional map of Ni concentration obtained by LA-ICP- MS method showed small spots of high Ni concentration in the root cross-sections from the Ni-spiked soil. These spots were randomly distributed in the cortex. We hypothesize that they are either caused by co-precipitation of Ni with phosphate in the apoplast as has been reported for other hyperaccumulator plants (Zhao et al., 2000), or they are some artifacts created during sample fixation process.
LA-ICP-MS方法获得的Ni浓度二维分布图显示,添加Ni土壤中根横切面存在高Ni浓度的小斑点。这些斑点随机分布于皮层中。我们推测,它们要么是由Ni与磷酸盐在质外体中共沉淀所致(其他超富集植物中已有此类报道(Zhao et al., 2000)),要么是样品固定过程中产生的假象。
As has been shown in previous studies (Puschenreiter et al., 2005; Moradi et al., 2010), abundant presence of Ni in the rhizosphere, mass flow of water, and free movement in the apoplastic pathway can explain high concentration of Ni in the cortex. Considering the Ni content of ultramafic soils, where B. coddii is native (Morrey et al., 1992), this is likely to be the case in its native environment. On the other hand, Ni concentration was found to be higher in the stele than in the cortex of the roots in control soil with low Ni concentration. The difference in Ni concentration of cortex and stele indicates active uptake or at least a selection mechanism for Ni ions in the latter case, since the uptake occurred against the concentration gradient. Therefore, nickel needs to pass through ion pumps or selective channels, which requires metabolic energy.
正如以往研究所示(Puschenreiter et al., 2005; Moradi et al., 2010),根际中Ni的大量存在、水分的质流以及在质外体途径中的自由移动,可以解释皮层中Ni的高浓度。考虑到B. coddii原产地超基性(蛇纹岩)土壤的Ni含量(Morrey et al., 1992),在其原生环境中很可能也是如此。另一方面,在Ni浓度较低的对照土壤中,根系中柱的Ni浓度高于皮层。在后一种情况下,皮层与中柱之间Ni浓度的差异表明存在主动吸收或至少存在对Ni离子的选择机制,因为吸收是逆浓度梯度进行的。因此,镍需要通过离子泵或选择性通道,这需要消耗代谢能量。
5Conclusions结论
The semi-quantitative two-dimensional Ni distribution pattern in the root cross-sections of the Ni hyperaccumulator plant B. coddii obtained using LA-ICP-MS method were supported qualitatively by DMG-staining technique showing a greater concentration of Ni in the cortex of the Ni-spiked roots than in the stele, while the opposite pattern was observed for the control roots. Obtaining similar Ni distribution patterns using two independent methods (including sample preparation) indicates that possible artifacts due to redistribution of Ni within the root tissue during sample preparation were inconsequent. DMG-staining proved to be a fast and low-cost method for qualitative studying of Ni distribution in plant tissues. The result underlines that direct analysis of roots and rhizosphere areas show a great potential in gaining a better understanding of the Ni concentration gradient in the rhizosphere of B. coddii to unravel more information regarding uptake of Ni and its distribution inside the roots.
采用LA-ICP-MS方法获得的Ni超富集植物B. coddii根横切面中Ni的半定量二维分布格局,得到了DMG染色技术的定性支持:添加Ni处理根系皮层中的Ni浓度高于中柱,而对照根系则呈相反格局。采用两种独立方法(包括样品制备)获得相似的Ni分布格局,表明制样过程中Ni在根组织内再分布可能产生的假象影响甚微。DMG染色被证明是定性研究植物组织中Ni分布的一种快速、低成本方法。结果强调,对根系和根际区域的直接分析在深入理解B. coddii根际Ni浓度梯度方面具有巨大潜力,有助于揭示更多有关Ni吸收及其在根内分布的信息。
Acknowledgements致谢
We would like to thank Jakob Frommer for his technical support for embedding and preparing the root samples. This study was funded by the Swiss National Science Foundation and the Austrian Science Fund (FWF–START project 267 N11)
感谢Jakob Frommer在根样包埋和制备方面提供的技术支持。本研究由瑞士国家科学基金会和奥地利科学基金(FWF–START项目267 N11)资助
References参考文献
Angle, J.S., Chaney, R.L., Baker, A.J.M., Li, Y., Reeves, R., Volk, V., Roseberg, R., Brewer, E., Burke, S., Nelkin, J., 2001. Developing commercial phytoextraction technologies: practical considerations. South African Journal of Science 97, 619–623.
Becker, J.S., Dietrich, R.C., Matusch, A., Pozebon, D., Dressier, V.L., 2008. Quantitative images of metals in plant tissues measured by laser ablation inductively coupled plasma mass spectrometry. Spectrochimica Acta Part B-Atomic Spectroscopy 63, 1248–1252.
Becker, J.S., Zoriy, M.V., Pickhardt, C., Palomero-Gallagher, N., Zilles, K., 2005. Imaging of copper, zinc, and other elements in thin section of human brain samples (Hippocampus) by laser ablation inductively coupled plasma mass spectrometry. Analytical Chemistry 77, 3208–3216.
Berazain, R., de la Fuente, V., Rufo, L., Rodriguez, N., Amils, R., Diez-Garretas, B., Sanchez-Mata, D., Asensi, A., 2007. Nickel localization in tissues of different hyperaccumulator species of Euphorbiaceae from ultramafic areas of Cuba. Plant and Soil 293, 99–106.
Bhatia, N.P., Walsh, K.B., Orlic, I., Siegele, R., Ashwath, N., Baker, A.J.M., 2004. Studies on spatial distribution of nickel in leaves and stems of the metal hyperaccumulator Stackhousia tryonii using nuclear microprobe (micro-PIXE) and EDXS techniques. Functional Plant Biology 31, 1061–1074.
Broadhurst, C.L., Chaney, R.L., Angle, J.S., Erbe, E.F., Maugel, T.K., 2004. Nickel localization and response to increasing Ni soil levels in leaves of the Ni hyperaccumulator Alyssum murale. Plant and Soil 265, 225–242.
Brooks, R.R., Chambers, M.F., Nicks, L.J., Robinson, B.H., 1998. Phytomining. Trends in Plant Science 3, 359–362.
Budka, D., Mesjasz-Przybylowicz, J., Tylko, G., Przybylowlicz, W.J., 2005. Freezesubstitution methods for Ni localization and quantitative analysis in Berkheya coddii leaves by means of PIXE. Nuclear Instruments & Methods in Physics
Research Section B-Beam Interactions with Materials and Atoms 231, 338– 344.
Cromwell, E.F., Arrowsmith, P., 1995. Semiquantitative analysis with laser-ablation inductively-coupled plasma-mass spectrometry. Analytical Chemistry 67, 131–138.
de la Fuente, V., Rodriguez, N., Diez-Garretas, B., Rufo, L., Asensi, A., Amils, R., 2007. Nickel distribution in the hyperaccumulator Alyssum serpyllifolium Desf. spp. from the Iberian Peninsula. Plant Biosystems 141, 170–180.
Dessureault-Rompre, J., Nowack, B., Schulin, R., Luster, J., 2006. Modified micro suction cup/rhizobox approach for the in-situ detection of organic acids in rhizosphere soil solution. Plant and Soil 286, 99–107.
Eeckhaoudt, S., Vandeputte, D., Vanpraag, H., Vangrieken, R., Jacob, W., 1992. Laser microprobe mass analysis (LAMMA) of aluminum and lead in fine roots and their ectomycorrhizal mantles of Norway spruce. Tree Physiology 10, 209–215.
Fahrni, C.J., 2007. Biological applications of X-ray fluorescence microscopy: exploring the subcellular topography and speciation of transition metals. Current Opinion in Chemical Biology 11, 121–127.
Gramlich, A.M., Moradi, A.B., Robinson, B.H., Kaesner, A., Schulin, R., 2007. The semi-quantitative distribution of Ni in plant tissues using DMG staining and image processing. Submitted to Environmental and Experimental Botany.
Hall, J.L., 2002. Cellular mechanisms for heavy metal detoxification and tolerance. Journal of Experimental Botany 53, 1–11.
Hattendorf, B., Latkoczy, C., Gunther, D., 2003. Laser ablation-ICPMS. Analytical Chemistry 75, 341A–347A.
Heath, S.M., Southworth, D., Dallura, J.A., 1997. Localization of nickel in epidermal subsidiary cells of leaves of Thlaspi montanum var siskiyouense (Brassicaceae) using energy-dispersive x-ray microanalysis. International Journal of Plant Sciences 158, 184–188.
Hoagland, D.R., Arnon, D.I., 1938. The water culture method for growing plants without soil. California: Agricultural Experiment Station 347, 1–39. Jain, A., 1989. Fundamentals of digital image processing. Prentice Hall, Englewood Cliffs, NJ.
Kaiser, J., Galiová, M., Novotn´y, J., Cervenka, R., Reale, L., Novotn´y, J., Liˇska, M., Samek,ˇ O., Kanick´y, V., Hrdliˇcka, A., Stejskal, K., Adam, V., Kizek, R., 2008. Mapping of lead, magnesium and copper accumulation in plant tissues by laser-induced breakdown spectroscopy and laser-ablation inductively coupled plasma mass spectrometry. Spectrochimica Acta Part B, Atomic Spectroscopy, Amsterdam, Elsevier, The Nederlands. ISSN 0584-8547, 2009, vol. 64, no. 1, pp. 67–73.
Kindness, A., Sekaran, C.N., Feldmann, J., 2003. Two-dimensional mapping of copper and zinc in liver sections by laser ablation-inductively coupled plasma mass spectrometry. Clinical Chemistry 49, 1916–1923.
Kramer, U., CotterHowells, J.D., Charnock, J.M., Baker, A.J.M., Smith, J.A.C., 1996. Free histidine as a metal chelator in plants that accumulate nickel. Nature 379, 635–638.
Kylander, M.E., Weiss, D.J., Jeffries, T.E., Kober, B., Dolgopolova, A., Garcia-Sanchez, R., Coles, B.J., 2007. A rapid and reliable method for Pb isotopic analysis of peat and lichens by laser ablation-quadrupole-inductively coupled plasma-mass spectrometry for biomonitoring and sample screening. Analytica Chimica Acta 582, 116–124.
Li, Y.M., Chaney, R., Brewer, E., Roseberg, R., Angle, J.S., Baker, A., Reeves, R., Nelkin, J., 2003. Development of a technology for commercial phytoextraction of nickel: economic and technical considerations. Plant and Soil 249, 107–115.
Lobinski, R., Moulin, C., Ortega, R., 2006. Imaging and speciation of trace elements in biological environment. Biochimie 88, 1591–1604.
Longerich, H.P., Jackson, S.E., Gunther, D., 1996. Laser ablation inductively coupled plasma mass spectrometric transient signal data acquisition and analyte concentration calculation. Journal of Analytical Atomic Spectrometry 11, 899–904.
Longerich, H.P., Jackson, S.E., Gunther, D., 1997. Laser ablation inductively coupled plasma mass spectrometric transient signal data acquisition and analyte concentration calculation (vol 11, pg 899, 1996). Journal of Analytical Atomic Spectrometry 12, 391–1391.
Ma, J.F., Ueno, D., Zhao, F.J., McGrath, S.P., 2005. Subcellular localisation of Cd and Zn in the leaves of a Cd-hyperaccumulating ecotype of Thlaspi caerulescens. Planta 220, 731–736.
Marschner, H., 1995. Mineral Nutrition of Higher Plants. Academic Press, London. Martin, R.R., Naftel, S.J., Macfie, S., Skinner, W., Courchesne, F., Seguin, V., 2004. Time of flight secondary ion mass spectrometry studies of the distribution of metals between the soil, rhizosphere and roots of Populus tremuloides Minchx growing in forest soil. Chemosphere 54, 1121–1125.
Matlab, 2007. The Math Works, Inc., Natick, MA 01760-2098, United States.
McNear, D.H., Peltier, E., Everhart, J., Chaney, R.L., Sutton, S., Newville, M., Rivers, M., Sparks, D.L., 2005. Application of quantitative fluorescence and absorption-edge computed microtomography to image metal compartmentalization in Alyssum murale. Environmental Science & Technology 39, 2210–2218.
Mesjasz-Przybylowicz, J., Barnabas, A., Przybylowicz, W., 2007. Comparison of cytology and distribution of nickel in roots of Ni-hyperaccumulating and nonhyperaccumulating genotypes of Senecio coronatus. Plant and Soil 293, 61–78.
Mesjasz-Przybylowicz, J., Przybylowicz, W.J., Pineda, C.A., 2001. Nuclear microprobe studies of elemental distribution in apical leaves of the Ni hyperaccumulator Berkheya coddii. South African Journal of Science 97, 591–593.
Metzner, R., Schneider, H.U., Breuer, U., Schroeder, W.H., 2008. Imaging nutrient distributions in plant tissue using time-of-flight secondary ion mass spectrometry and scanning electron microscopy. Plant Physiology 147, 1774–1787.
Mizuno, N., Nosaka, S., Mizuno, T., Horie, K., Obata, H., 2003. Distribution of Ni and Zn in the leaves of Thlaspi japonicum growing on ultramafic soil. Soil Science and Plant Nutrition 49, 93–97.
Moradi, A.B., Conesa, H.M., Robinson, B.H., Lehmann, E., Kaestner, A., Schulin, R., 2009. Root responses to soil Ni heterogeneity in a hyperaccumulator and a nonaccumulator species. Environmental Pollution 157, 2189–2196.
Moradi, A.B., Oswald, S.E., Nordmeyer-Massner, J.A., Pruessmann, K.P., Robinson, B.H., Schulin, R., 2010. Analysis of nickel concentration profiles around the roots of the hyperaccumulator plant Berkheya coddii using MRI and numerical simulations. Plant and Soil 328, 291–302. Published online, doi:10.1007/s11104- 009-0109-8.
Morrey, D.R., Balkwill, K., Balkwill, M.J., Williamson, S., 1992. A review of some studies of the serpentine flora of Southern Africa. In: Baker, A.J.M., Procter, J., Reeves, R.D. (Eds.), The Vegetation of Ultramafic (Serpentine) Soils. Intercept, Andover, pp. 147–158.
Motelica-Hieno, M., Donard, O.F.X., 2001. Comparison of UV and IR laser ablation ICP-MS on silicate reference materials and implementation of normalisation factors for quantitative measurements. Geostandards Newsletter-the Journal of Geostandards and Geoanalysis 25, 345–359.
Pickhardt, C., Dietze, H.J., Becker, J.S., 2005. Laser ablation inductively coupled plasma mass spectrometry for direct isotope ratio measurements on solid samples. International Journal of Mass Spectrometry 242, 273–280.
Prohaska, T., Stadlbauer, C., Wimmer, R., Stingeder, G., Latkoczy, C., Hoffmann, E., Stephanowitz, H., 1998. Investigation of element variability in tree rings of young Norway spruce by laser-ablation-ICPMS. Science of the Total Environment 219, 29–39.
Przybylowicz, W.J., Mesjasz-Przybylowicz, J., Pineda, C.A., Churms, C.L., Ryan, C.G., Prozesky, V.M., Frei, R., Slabbert, J.P., Padayachee, J., Reimold, W.U., 2001. Elemental mapping using proton-induced X-rays. X-Ray Spectrometry 30, 156–163.
Puschenreiter, M., Schnepf, A., Millan, I.M., Fitz, W.J., Horak, O., Klepp, J., Schrefl, T., Lombi, E., Wenzel, W.W., 2005. Changes of Ni biogeochemistry in the rhizosphere of the hyperaccumulator Thlaspi goesingense. Plant and Soil 271, 205–218.
Redjala, T., Sterckeman, T., Skiker, S., Echevarria, G., 2009. Contribution of apoplast and symplast to short term nickel uptake by maize and Leptoplax emarginata roots. Environmental and Experimental Botany 68, 99–106.
Resano, M., Perez-Arantegui, J., Garcia-Ruiz, E., Vanhaecke, F., 2005. Laser ablation-inductively coupled plasma mass spectrometry for the fast and direct characterization of antique glazed ceramics. Journal of Analytical Atomic Spectrometry 20, 508–514.
Robinson, B.H., Brooks, R.R., Howes, A.W., Kirkman, J.H., Gregg, P.E.H., 1997. The potential of the high-biomass nickel hyperaccumulator Berkheya coddii for phytoremediation and phytomining. Journal of Geochemical Exploration 60, 115–126.
Robinson, B.H., Lombi, E., Zhao, F.J., McGrath, S.P., 2003. Uptake and distribution of nickel and other metals in the hyperaccumulator Berkheya coddii. New Phytologist 158, 279–285.
Russo, R.E., Mao, X.L., Liu, H.C., Gonzalez, J., Mao, S.S., 2002. Laser ablation in analytical chemistry – a review. Talanta 57, 425–451.
Saito, M.A., Moffett, J.W., 2001. Complexation of cobalt by natural organic ligands in the Sargasso Sea as determined by a new high-sensitivity electrochemical cobalt speciation method suitable for open ocean work. Marine Chemistry 75, 49–68.
Shi, J.Y., Gras, M.A., Silk, W.K., 2009. Laser ablation ICP-MS reveals patterns of copper differing from zinc in growth zones of cucumber roots. Planta 229, 945–954.
Tappero, R., Peltier, E., Grafe, M., Heidel, K., Ginder-Vogel, M., Livi, K.J.T., Rivers, M.L., Marcus, M.A., Chaney, R.L., Sparks, D.L., 2007. Hyperaccumulator Alyssum murale relies on a different metal storage mechanism for cobalt than for nickel. New Phytologist 175, 641–654.
Tinker, P.B., Nye, P.H., 2000. Solute movement in the rhizosphere. Oxford University Press, New York.
Ulrich, A., Barrelet, T., Krahenbuhl, U., 2007. Spatially resolved plant physiological analysis using LA-HR-ICP-MS. Chimia 61, 111–1111.
Zhao, F.J., Lombi, E., Breedon, T., McGrath, S.P., 2000. Zinc hyperaccumulation and cellular distribution in Arabidopsis halleri. Plant Cell and Environment 23, 507–514.