Contents lists available at ScienceDirect journal homepage: www.elsevier.com/locate/envexpbot
Anja Gramlich a,∗, Ahmad B. Moradi b, Brett H. Robinson c, Anders Kaestner d, Rainer Schulin a
a Institute of Terrestrial Ecosystems, ETH, Universitätstr. 16, CH-8092 Zurich, Switzerland b Helmholtz Centre for Environmental Research - UFZ, Leipzig, Germany c Agriculture and Life Sciences Division, Lincoln University, Canterbury, New Zealand d Paul Scherrer Institut, Villigen, Switzerland
a 瑞士苏黎世联邦理工学院(ETH)陆地生态系统研究所,Universitätstr. 16, CH-8092 Zurich, Switzerland b 德国莱比锡亥姆霍兹环境研究中心(UFZ) c 新西兰坎特伯雷林肯大学农业与生命科学学部 d 瑞士菲林根保罗谢勒研究所(Paul Scherrer Institut)
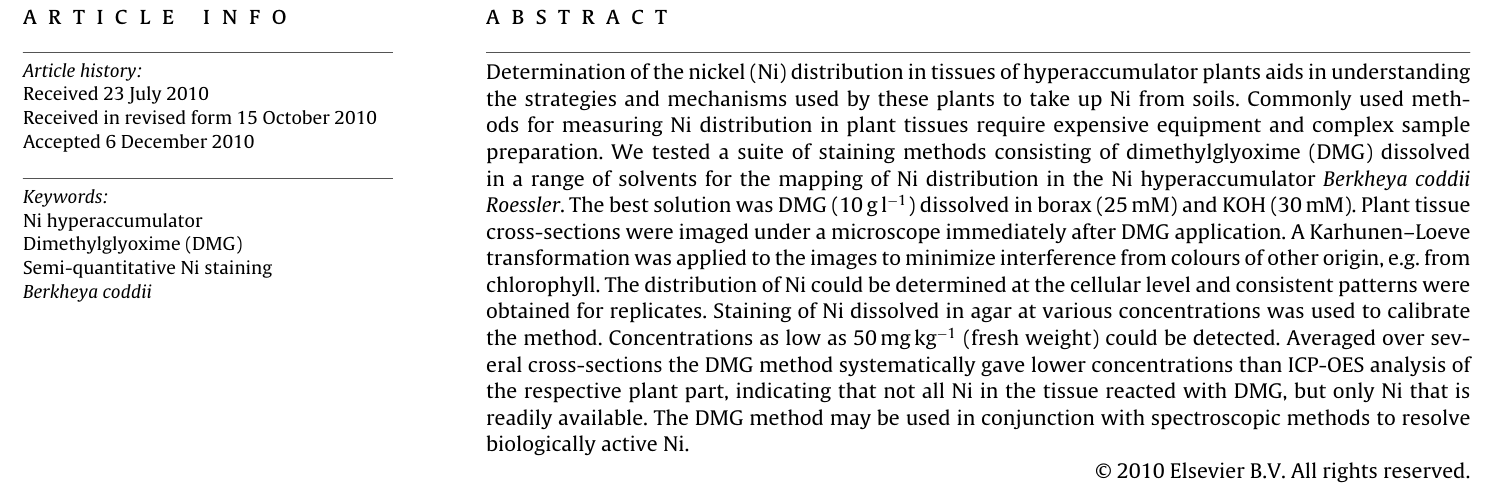
1Introduction引言
Soils derived from ultramafic (serpentine) rocks naturally contain high concentrations of nickel (Ni), usually in the range 0.1–3% Ni (Brooks, 1987). Some plants spontaneously occurring on these soils accumulate one or more orders of magnitude more Ni in their shoots than other species growing in the same environment (Brooks et al., 1977). Plants that accumulate >1000 mg of a trace element kg−1 (dry weight), concentrating the element more in the shoot than in the roots, are called hyperaccumulators. There are more than 300 known species of Ni hyperaccumulators, belonging to more than 33 families (Brooks, 1998b). As the toxicity of the accumulated Ni must be controlled, hyperaccumulation comes at a metabolic cost for the plant, which would be avoided if the metal would be excluded from being taken up by the roots and translocated into the shoots. It is hypothesised that hyperaccumulation confers benefits to the plant, including increased protection against herbivores (Boyd, 1998; Robinson et al., 2003; Sagner et al., 1998).
由超基性(蛇纹岩)岩石发育而来的土壤天然含有高浓度的镍(Ni),通常在0.1–3% Ni范围内(Brooks, 1987)。某些自然生长于此类土壤上的植物,其地上部Ni积累量比同一环境中生长的其他物种高出一个或多个数量级(Brooks et al., 1977)。积累某一微量元素>1000 mg kg−1(干重)、且该元素在地上部的浓度高于根部的植物,称为超富集植物。已知的Ni超富集植物超过300种,隶属于33个以上的科(Brooks, 1998b)。由于必须控制所积累Ni的毒性,超富集对植物而言需要付出代谢代价;若根系不吸收该金属、亦不将其转运至地上部,则可避免这一代价。据推测,超富集能为植物带来益处,包括增强对植食动物的防御(Boyd, 1998; Robinson et al., 2003; Sagner et al., 1998)。
∗ Corresponding author. Tel.: +41 44 632 84 60.
∗ 通讯作者。电话:+41 44 632 84 60。
E-mail address: anja.gramlich@env.ethz.ch (A. Gramlich).
Studies on the distribution of Ni and other heavy metals in plant tissues can provide important information on the mechanisms and ecological benefits of hyperaccumulation. For example, protection against phloem-sucking insects will only be effective if Ni is present at sufficiently high concentrations in the phloem. Understanding Ni allocation in various plant parts can also be valuable for the development of methods using plants to clean up Ni-contaminated soils or for the assessment of risks arising from the use of such soils for crop production (McNear et al., 2005). Soil contamination by Ni can arise from the deposition of dusts generated by mining and smelting activities, shooting, and land application of sewage sludge (Robinson et al., 1997; Brooks, 1998a; Migliorini et al., 2004).
研究Ni及其他重金属在植物组织中的分布,可为揭示超富集的机制及其生态效益提供重要信息。例如,只有当韧皮部中的Ni浓度足够高时,才能有效抵御吸食韧皮部汁液的昆虫。了解Ni在植物不同部位的分配,对于开发利用植物修复Ni污染土壤的方法,以及评估利用此类土壤进行作物生产所带来的风险,也具有重要价值(McNear et al., 2005)。土壤Ni污染可源于采矿和冶炼活动产生的粉尘沉降、射击活动以及污水污泥的土地施用(Robinson et al., 1997; Brooks, 1998a; Migliorini et al., 2004)。
Many authors have studied the distribution of metals in hyperaccumulator plants using electron dispersive X-ray analysis (EDXA) (e.g. Robinson et al., 2003; Bidwell et al., 2004; Marmiroli et al., 2004; Berazain et al., 2007). Unfortunately, EDXA is limited to Ni metal concentrations above 1000 mg kg−1 dry weight (McNear et al., 2005). Critical in EDXA analysis is the position of the sample relative to the X-ray beam during analysis. Large errors can occur if the angle between sample and beam is not precisely controlled. Another source of error is interferences of the energy emission lines of the target element with other elements present in the sample. Moreover, artefacts may result from Ni redistribution in or leaching from non-frozen samples. Mesjasz-Przybylowicz et al. (2001), Bhatia et al. (2004) and Budka et al. (2005) quantified Ni concentrations in various leaf tissues at cellular level using microproton-induced X-ray emission spectroscopy (micro-PIXE), which has a detection limit of 1–10 mg kg−1 dehydrated samples (Ortega, 2005). Micro-PIXE analyses are performed under vacuum on thin sections of resin-embedded samples. Thereby, Ni redistribution offsets some of the gain in sensitivity. Budka et al. (2005) tested several media for freeze-substitution and showed that the distributions and concentrations of metal were heavily dependent on the medium.
许多研究者采用能量色散X射线分析(EDXA)研究了超富集植物中金属的分布(如Robinson et al., 2003; Bidwell et al., 2004; Marmiroli et al., 2004; Berazain et al., 2007)。遗憾的是,EDXA仅适用于Ni浓度高于1000 mg kg−1干重的情况(McNear et al., 2005)。EDXA分析的关键在于分析过程中样品相对于X射线束的位置。若样品与射线束之间的角度未得到精确控制,可能产生较大误差。另一误差来源是目标元素的能量发射谱线与样品中其他元素之间的干扰。此外,未冷冻样品中Ni的重新分布或淋溶也可能导致假象。Mesjasz-Przybylowicz et al.(2001)、Bhatia et al.(2004)和Budka et al.(2005)采用微质子激发X射线发射光谱(micro-PIXE)在细胞水平上定量了不同叶片组织中的Ni浓度,该方法对脱水样品的检出限为1–10 mg kg−1(Ortega, 2005)。Micro-PIXE分析在真空条件下对树脂包埋样品的薄切片进行。因此,Ni的重新分布在一定程度上抵消了灵敏度方面的优势。Budka et al.(2005)测试了多种冷冻置换介质,结果表明金属的分布和浓度在很大程度上取决于所用介质。
0098-8472/$ – see front matter © 2010 Elsevier B.V. All rights reserved. doi:10.1016/j.envexpbot.2010.12.008
0098-8472/$ – 见前页 © 2010 Elsevier B.V. 版权所有。doi:10.1016/j.envexpbot.2010.12.008
Smart et al. (2007) used high-resolution secondary ion mass spectroscopy (NanoSIMS) for analysing Ni distribution in leaf tissues. This technique can quantify metals at the sub-cellular level due to its high spatial resolution (0.05 �m). A further advantage is the low detection limit of <0.1 mg kg−1 for dehydrated samples (Ortega, 2005). However, it requires a complex chemical pre-treatment of the sample that may result in Ni redistribution. McNear et al. (2005) used synchrotron-based fluorescence computed microtomography (CMT) and synchrotron-based absorption-edge CMT to investigate the distribution of Ni in Alyssum murale. These techniques have the advantage that they can provide 3D images without sectioning the sample, while the detection limits are still reasonably low (<18–37 mg Ni kg−1 dry weight). However, the samples need to be shock-frozen and dried. Therefore, a truly in vivo analysis in many cases is impossible. Another drawback of microPIXE, nanoSIMS and synchrotron-based CMT techniques is that they involve a high level of expertise and complex facilities to which access is limited.
Smart et al.(2007)采用高分辨率二次离子质谱(NanoSIMS)分析了叶片组织中的Ni分布。该技术空间分辨率高(0.05 μm),可在亚细胞水平上定量金属。其另一优势是对脱水样品的检出限低至<0.1 mg kg−1(Ortega, 2005)。然而,该方法需要对样品进行复杂的化学预处理,可能导致Ni重新分布。McNear et al.(2005)采用基于同步辐射的荧光计算机显微断层扫描(CMT)和基于同步辐射的吸收边CMT研究了Alyssum murale中Ni的分布。这些技术的优点是无需切片即可提供三维图像,且检出限仍相当低(<18–37 mg Ni kg−1干重)。但样品需经速冻和干燥处理,因此在许多情况下无法实现真正的活体分析。micro-PIXE、NanoSIMS和同步辐射CMT技术的另一缺点是需要高度的专业知识和复杂的设施,而使用这些设施的机会有限。
1.1. Dimethylglyoxime (DMG) analysis1.1. 丁二酮肟(DMG)分析
Element-specific staining techniques do not require expensive and complex equipment. Various authors have used such techniques to localize metals in plant tissues. Tung and Temple (1996) conducted histochemical studies on the distribution of lead (Pb) in root, stem and leaf tissues of various plant species using sodium rhodizonate as a staining agent. Andreˇı et al. (2006) and Ozturk et al. (2006) investigated the zinc (Zn) distribution in sycamore maple leaves and in seeds of wheat plants, respectively, by element specific staining techniques. Dimethylglyoxime (DMG) is a staining agent particularly well suited for Ni. DMG forms strong complexes with Ni. The Ni–DMG complex reflects and transmits red light in the range of 600–450 nm (Dakhel et al., 2006). This colouration can reveal the distribution of Ni in plant tissues. Interferences may occur with cadmium (Cd) and copper (Cu), which also form red complexes with DMG. The colour of the latter complexes, however, is less intense than that of Ni(DMG)2. At concentrations that normally occur in Ni hyperaccumulator plant tissues, Cd and Cu staining by DMG is negligible in comparison to Ni (Seregin et al., 2003).
元素特异性染色技术无需昂贵而复杂的设备。许多研究者已利用此类技术对植物组织中的金属进行定位。Tung和Temple(1996)以玫棕酸钠为染色剂,对多种植物根、茎和叶组织中铅(Pb)的分布进行了组织化学研究。Andreˇı et al.(2006)和Ozturk et al.(2006)分别采用元素特异性染色技术研究了欧亚槭叶片和小麦种子中锌(Zn)的分布。丁二酮肟(DMG)是一种特别适用于Ni的染色剂。DMG可与Ni形成稳定的络合物。Ni–DMG络合物在600–450 nm范围内反射和透射红光(Dakhel et al., 2006)。这种显色可揭示Ni在植物组织中的分布。镉(Cd)和铜(Cu)也能与DMG形成红色络合物,因而可能产生干扰。但后者络合物的颜色强度弱于Ni(DMG)2。在Ni超富集植物组织中通常存在的浓度下,DMG对Cd和Cu的染色与Ni相比可忽略不计(Seregin et al., 2003)。
Many investigators have used DMG for qualitative microscopic detection of Ni in plant tissues (L’Huillier et al., 1996; Heath et al., 1997; Sagner et al., 1998; Küpper et al., 2001; Boominathan and Doran, 2003; Mizuno et al., 2003; Seregin et al., 2003; Bhatia et al., 2004; Richau et al., 2009). Some authors reported crystal formation and Ni redistribution (Bhatia et al., 2004; Mizuno et al., 2003). Whether such artefacts are a problem, however, depends on sample preparation and the type of DMG solution. As DMG is only sparingly soluble in water, ethanol-containing solutions are often used. Ethanol was found to enhance the penetration of some tissues by DMG (Smart et al., 2007), but also to destroy tissue structure and thus may contribute to Ni redistribution (Seregin et al., 2003).
许多研究者已利用DMG对植物组织中的Ni进行定性显微检测(L’Huillier et al., 1996; Heath et al., 1997; Sagner et al., 1998; Küpper et al., 2001; Boominathan and Doran, 2003; Mizuno et al., 2003; Seregin et al., 2003; Bhatia et al., 2004; Richau et al., 2009)。部分研究者报道了晶体形成和Ni重新分布的现象(Bhatia et al., 2004; Mizuno et al., 2003)。然而,此类假象是否构成问题,取决于样品制备方法和DMG溶液的类型。由于DMG在水中溶解度很低,通常采用含乙醇的溶液。研究发现,乙醇可增强DMG对某些组织的渗透(Smart et al., 2007),但也会破坏组织结构,从而可能促使Ni重新分布(Seregin et al., 2003)。
The time over which cross-sections are exposed to the DMG-solutions plays an important role in DMG staining. Seregin et al.
横切片暴露于DMG溶液中的时间在DMG染色中起着重要作用。Seregin et al.
(2003) found that the formation of crystals was no problem if the tissues were imaged immediately after DMG staining. Another advantage of rapid imaging is that there is less time for Ni redistribution in the tissue. However, only a fraction of the reactive Ni may be complexed if the exposure time is too short. Thus, there is a trade-off between the risk of artefacts and the completeness of Ni detection.
(2003)发现,若在DMG染色后立即对组织成像,则晶体形成不成问题。快速成像的另一优点是Ni在组织中重新分布的时间较短。然而,若暴露时间过短,可能只有部分活性Ni被络合。因此,在假象风险与Ni检测的完整性之间需要权衡。
No attempts have been made (or at least published) to use DMG staining in order to determine the distribution of Ni in plant tissues quantitatively. The aim of this study was to develop a method that could be used to determine at least semi-quantitatively the distribution of Ni in hyperaccumulator plants at tissue level. In particular, we sought (1) an appropriate DMG solvent for application to plant tissue, (2) to quantify the intensity of the DMG stain using image analysis, (3) to map Ni concentrations across root, shoot and leaf sections at tissue level, and (4) to validate the method by comparing tissue Ni concentrations determined by DMG staining with tissue analysis by inductively coupled plasma optical emission spectroscopy (ICP-OES).
目前尚未有人尝试(或至少尚未发表)利用DMG染色定量测定植物组织中的Ni分布。本研究旨在建立一种至少能在组织水平上半定量测定超富集植物中Ni分布的方法。具体而言,我们力求:(1)确定适用于植物组织的DMG溶剂;(2)利用图像分析定量DMG染色强度;(3)在组织水平上绘制根、茎和叶切片中的Ni浓度分布图;(4)通过将DMG染色测得的组织Ni浓度与电感耦合等离子体发射光谱(ICP-OES)组织分析结果进行比较,对该方法进行验证。
2Materials and methods材料与方法
2.1. Plant cultivation2.1. 植物培养
We germinated seeds of B. coddii, a well-known Ni hyperaccumulator of the Asteraceae family, and grew the seedlings for three weeks in perlite. The seedlings were then transferred to 0.3 l pots filled with a sandy soil (sand:silt:clay-ratio: 87:8:5) with a pH of 6.4 (KCl), collected from the subsoil of a forest of Eiken, Switzerland. The organic carbon content was 0.6%. The Ni concentration in the unspiked soil was analysed using X-ray fluorescence spectroscopy (XRF, X-Lab 2000, Spectro, Kleve, Germany). Before filling into the pots, Ni(NO3)2 was added to the soil to produce the following concentrations: 0 (control), 31.25, 62.5, 125, 250 and 500 mg Ni kg−1 soil. Three replicate pots were prepared for each Ni concentration. After two months in a climate chamber (with a daily light cycle of 16 h light/8 h darkness, constant humidity of 75%, and controlled variation in temperature between 23 ◦C during day and 16 ◦C over night), we took fresh samples from leaves, roots and stem tissues for cross-sectioning and DMG staining. The remainder of the plant material was dried, ground, and stored for chemical analysis.
我们将B. coddii(菊科中一种著名的Ni超富集植物)的种子萌发,幼苗在珍珠岩中培养三周。随后将幼苗移栽至装有砂质土壤(砂粒:粉粒:黏粒比例为87:8:5)的0.3 l花盆中,该土壤pH为6.4(KCl),采自瑞士Eiken一处森林的底土。有机碳含量为0.6%。采用X射线荧光光谱(XRF, X-Lab 2000, Spectro, Kleve, Germany)分析了未添加Ni土壤中的Ni浓度。装盆前向土壤中添加Ni(NO3)2,使其浓度分别为0(对照)、31.25、62.5、125、250和500 mg Ni kg−1土壤。每个Ni浓度设3个重复盆。在人工气候室中培养两个月后(每日光周期为16 h光照/8 h黑暗,湿度恒定为75%,温度控制在白天23 ◦C、夜间16 ◦C之间变化),采集叶、根和茎的新鲜组织样品用于横切和DMG染色。其余植物材料经烘干、粉碎后保存,用于化学分析。
2.2. DMG solution testing2.2. DMG溶液测试
Previous studies (e.g. L’Huillier et al., 1996; Heath et al., 1997; Sagner et al., 1998; Küpper et al., 2001; Boominathan and Doran, 2003; Mizuno et al., 2003; Seregin et al., 2003; Bhatia et al., 2004) examined a wide range of DMG solvents for Ni staining in plant tissues. We tested five solutions: Three solutions were used as described in the literature; two were obtained by modification of proposed solutions (Table 1). The solution containing borax and KOH is a modification of the borax/NaOH solution used by Seregin et al. (2003). The reason for this replacement was that plant tissues tolerate potassium (K) better than sodium (Na) (Mäser et al., 2002; Rodriguez-Navarro and Rubio, 2006). High Na contents may destroy cells due to osmotic pressure and thus lead to Ni redistribution.
以往的研究(如L’Huillier et al., 1996; Heath et al., 1997; Sagner et al., 1998; Küpper et al., 2001; Boominathan and Doran, 2003; Mizuno et al., 2003; Seregin et al., 2003; Bhatia et al., 2004)考察了多种用于植物组织Ni染色的DMG溶剂。我们测试了五种溶液:其中三种按文献所述配制,另两种由已有溶液改良而得(表1)。含硼砂和KOH的溶液是对Seregin et al.(2003)所用硼砂/NaOH溶液的改良。进行这一替换的原因是植物组织对钾(K)的耐受性优于钠(Na)(Mäser et al., 2002; Rodriguez-Navarro and Rubio, 2006)。高Na含量可能因渗透压而破坏细胞,进而导致Ni重新分布。
Cross-sections were cut by means of a manual cylinder microtome (Dr. G. Schuchardt, Göttingen). To compare the effects of the different solutions, we applied 30 �l droplets on ∼150 �m thick cross-sections of leaf, stem and root tissues from plants grown in 125 and 250 mg Ni kg−1 soil. The maximum distance between two cross-sections stained with different DMG solutions was 5 mm to keep the variation between sections as small as possible. We added <30 �l of solution to each cross-section to minimise leaching. We photographed the stained sections with 100× magnification some 30 s after the application of the solution to the sections, using a light microscope (Zeiss, Switzerland) fitted with a digital camera (Canon Power Shot A640). The time between sample preparation and photography was kept as short as possible to avoid dehydration and formation of Ni–DMG crystals. For each solution, we measured the pH and quantitatively determined the solubility of DMG in the solvents after 2 h of shaking. The optical detection limits of Ni for the five solvents were compared by adding a droplet of each solution and a droplet of a Ni-standard solution on a white filter paper. This procedure was repeated with increasingly diluted Ni-solutions (12–1 mg l−1) until there was no red colouration visible (Seregin et al., 2003).
采用手动圆柱切片机(Dr. G. Schuchardt, Göttingen)制备横切片。为比较不同溶液的效果,我们将30 μl液滴滴加于生长在125和250 mg Ni kg−1土壤中植物的叶、茎和根组织约150 μm厚的横切片上。用不同DMG溶液染色的两张横切片之间的最大距离为5 mm,以尽可能减小切片间的差异。每张横切片滴加<30 μl溶液,以尽量减少淋溶。在滴加溶液约30 s后,使用配有数码相机(Canon Power Shot A640)的光学显微镜(Zeiss, Switzerland)以100×放大倍数拍摄染色切片。样品制备与拍摄之间的时间尽可能缩短,以避免脱水和Ni–DMG晶体的形成。对于每种溶液,测定其pH,并在振荡2 h后定量测定DMG在溶剂中的溶解度。将每种溶液的液滴与Ni标准溶液的液滴滴加于白色滤纸上,比较五种溶剂对Ni的光学检出限。用逐步稀释的Ni溶液(12–1 mg l−1)重复此过程,直至不再出现可见的红色显色(Seregin et al., 2003)。
DMG solvents tested.
所测试的DMG溶剂。
| Solvent溶剂 | Proposed by提出者 | Composition of DMG-solutionDMG溶液组成 | Tested plants and plant parts测试植物及 植物部位 | pH | Optical detection limit of NiNi的光学 检出限 | DMG solubilityDMG溶解度 |
|---|---|---|---|---|---|---|
| KOH | Boominathan and Doran (2003) | 1.16 g DMG dissolved in 100 ml 0.1 M KOH solution | Alyssum bertolonii (roots) | 12 | 2 mg l−1 | Low |
| Ethanol | Küpper et al. (2001) | 1% DMG (w/v) dissolved in ethanol | Alyssum lesbiacum (leaves) | 8.4 | 2 mg l−1 | Soluble after 2h of shaking |
| Ethanol/amm. ac. | Mizuno et al. (2003) | 1 g DMG added to 100 ml ethanol and mixed with 1 M ammonium acetate solution (1:5) | Thlaspi japonicum (leaves) | 6.9 | 4 mg l−1 | Well |
| Borax/NaOH | AfterSeregin et al. (2003) | 1 g DMG and 1.5 g NaOH dissolved in 100 ml of 0.05 M Na2B4O7·10H2O solution | Zea maysL. (roots) | 13 | 2 mg l−1 | Well |
| Borax/KOH | AfterBoominathan and Doran (2003)andSeregin et al. (2003) | 1 g DMG and 0.18 g KOH dissolved in 100 ml of 0.025 M Na2B4O7·10H2O solution | 10 | 2 mg l−1 | Low |
2.3. Sampling and preparation of the specimens2.3. 样品采集与标本制备
As described in Section 3.1, the borax/KOH solution (Table 1) was found to be the most suitable DMG solvent. This solvent was subsequently used for all further tests. For these tests, B. coddii were grown, sampled and prepared for DMG staining as described above. Three leaves were sampled from each plant (the first fully developed leaf on top, fourth leaf from top and bottom leaf): From each leaf, three cross-sections were taken (tip, middle, and one close to the base). Roots were washed with deionised water and one root of average thickness was chosen for cross-sectioning. One cross-section was taken close to the shoot and one in the middle of the roots. In addition, two cross-sections were taken from the stem of each plant (top and middle).
如3.1节所述,硼砂/KOH溶液(表1)被确定为最适宜的DMG溶剂,因此后续所有测试均采用该溶剂。在这些测试中,B. coddii按上述方法培养、采样并制备用于DMG染色。每株植物采集三片叶(顶部第一片完全展开叶、自顶部起第四片叶和底部叶):每片叶取三张横切片(叶尖、中部和靠近基部处)。根系用去离子水冲洗,选取一条平均粗细的根进行横切。在靠近地上部处和根的中部各取一张横切片。此外,从每株植物的茎上取两张横切片(顶部和中部)。
Ë is the diagonal matrix of the eigenvalues and Ired and Igreen are the row vectors of the intensities in the colour channels for red and green. The covariance matrix being symmetric and its eingevectors orthogonal, the eigenvector matrix S was used to transform the two channels into the matrix
Ë为特征值的对角矩阵,Ired和Igreen分别为红色和绿色通道强度的行向量。由于协方差矩阵是对称的且其特征向量正交,利用特征向量矩阵S将两个通道变换为矩阵

The rows of K contained the independent basis images, which represent the primary signals for chlorophyll and Ni–DMG and projected into an orthonormal real space of orthogonal vectors. The basis image in K corresponding to the larger of the two eigenvalues contained the Ni concentration information. As a final step, the basis image was reshaped into its original dimension. For all steps of the image processing the program Matlab (MathWorks) was used.
K的各行包含独立的基图像,它们代表叶绿素和Ni–DMG的主要信号,并被投影到由正交向量构成的标准正交实空间中。K中对应于两个特征值中较大者的基图像包含Ni浓度信息。最后一步,将该基图像重塑为其原始维度。图像处理的所有步骤均使用Matlab(MathWorks)程序完成。
2.4.2. Determination of averaged tissue DMG staining intensities
2.4.2. 组织DMG平均染色强度的测定
Before we analysed the intensities of the tissue staining in the processed images, we subtracted the mean background intensity from each single image by measuring the intensity of a rectangular area next to the sample and subtracting it from the total image intensity. Then, we selected 3–5 rectangular areas in each particular tissue and determined the median staining intensities in the areas. The averages of the 3–5 replicate areas were taken as the mean staining intensity in the respective tissues.
在分析处理后图像中组织染色强度之前,我们先测量样品旁一个矩形区域的强度,并将其从图像总强度中扣除,从而从每幅图像中减去平均背景强度。然后,在每种特定组织中选取3–5个矩形区域,测定这些区域的染色强度中位数。以3–5个重复区域的平均值作为相应组织的平均染色强度。
2.4.3. Calibration2.4.3. 校准
2.4. Image analysis2.4. 图像分析
2.4.1. Karhunen–Loeve transformation2.4.1. Karhunen–Loeve变换
The colour images obtained by the digital camera were recorded in the RGB colour space, i.e. in the three colour channels red, green, and blue. To separate DMG from non-DMG signals, e.g. from chlorophyll, we inspected collocation histograms for the three colour channel combinations red–green, red–blue, and green–blue. The red–green combination showed distinct clusters, and therefore represented the best choice for separation of DMG from other signals. We used the Karhunen–Loeve transformation (Jain, 1989; Basso et al., 2010) to separate the colours representing chlorophyll and DMG as much as possible. Using this transformation, two stochastic signals become statistically independent. They are now projectable into orthonormal components, where the independent vectors are red and green. This was achieved by computing the eigenvector matrix S of the covariance matrix C = cov(Ired, Igreen) for the two colour channels, given by
数码相机获取的彩色图像记录于RGB色彩空间,即红、绿、蓝三个颜色通道。为将DMG信号与非DMG信号(如叶绿素信号)分离,我们考察了红–绿、红–蓝和绿–蓝三种颜色通道组合的共定位直方图。红–绿组合呈现出明显的聚类,因此是分离DMG与其他信号的最佳选择。我们采用Karhunen–Loeve变换(Jain, 1989; Basso et al., 2010)尽可能分离代表叶绿素和DMG的颜色。通过该变换,两个随机信号变为统计独立,并可投影为标准正交分量,其中独立向量为红色和绿色。具体做法是计算两个颜色通道的协方差矩阵C = cov(Ired, Igreen)的特征向量矩阵S,由下式给出

To convert colour intensities into concentrations (mg Ni kg−1 fresh weight), we prepared agar standards as a substitute for plant tissues. Nickel nitrate was added at concentrations of 0, 25, 50, 100, 200, 400, 800, 1600, 3200 mg Ni l−1 to a solution of 30 g agar l−1. Such a high agar concentration compared to standard applications for in vitro cultures was needed for the stability of the slides and because of Ni–DMG leaching at lower concentrations. After autoclaving, the Ni-spiked agar solutions were filled into Petri dishes. The final Ni concentrations of the standards were determined by means of ICP-OES.
为将颜色强度转换为浓度(mg Ni kg−1鲜重),我们制备了琼脂标准品作为植物组织的替代物。向30 g琼脂 l−1的溶液中添加硝酸镍,浓度分别为0、25、50、100、200、400、800、1600、3200 mg Ni l−1。与离体培养的常规用量相比,需要如此高的琼脂浓度,是为了保证切片的稳定性,并因为在较低浓度下会发生Ni–DMG淋溶。经高压灭菌后,将添加Ni的琼脂溶液倒入培养皿中。标准品的最终Ni浓度采用ICP-OES测定。
The agar standards were sectioned and stained in the same way as the plant samples: Cross-sections of ∼150 �m were cut, DMG-solution was added, and the samples were imaged using light microscopy. We analysed five replicates of each concentration standard.
琼脂标准品的切片和染色方法与植物样品相同:切取约150 μm的横切片,滴加DMG溶液,并用光学显微镜成像。每个浓度标准品分析五个重复。
After image processing, we fitted a power function to the experimental data in order to describe the relationship between staining intensity and Ni concentration (Eq. (3)). This function was then used to calculate the Ni concentrations of the stained plant tissues of B. coddii. The detection limit of the method was set to the lowest Ni concentration in agar that resulted in a staining of the agar that was significantly different from the blank agar samples (Wilcoxon rank sum test).
图像处理后,我们对实验数据拟合幂函数,以描述染色强度与Ni浓度之间的关系(式(3))。随后利用该函数计算B. coddii染色植物组织中的Ni浓度。该方法的检出限设定为琼脂染色与空白琼脂样品存在显著差异的最低琼脂Ni浓度(Wilcoxon秩和检验)。
we assumed that the average Ni concentrations of the selected cross-sections gave a sufficient approximation for the Ni concentrations determined by the ICP-OES measurements.
我们假定所选横切片的平均Ni浓度足以近似代表ICP-OES测得的Ni浓度。
2.5. Validation2.5. 验证
2.5.1. ICP-OES measurement2.5.1. ICP-OES测定
To test the calibration with the agar standards, we also determined the Ni concentrations of plant tissues by means of ICP-OES (Vista-MPX, Varian). To obtain sufficient material for ICP analysis, the leaf sampled for staining was analysed together with its nearest neighbour leaf. For stem samples, the stem was divided into four parts that were analysed separately. The entire root system was analysed because of the small mass of the root samples. The samples were dried for 24 h at 40 ◦C and then digested for 40 min at 150 ◦C in 15 ml HNO3 using a digestion block (DigiPREP MS, SCP-Science). Fresh agar samples were digested in the same way as the plant samples. As we could not find plant reference material with comparable Ni concentrations, we used standard addition with a final Ni concentration of 1 mg l−1 in the analysed solution (Ni standard solution, MERCK) for quality control.
为检验琼脂标准品校准的可靠性,我们还采用ICP-OES(Vista-MPX, Varian)测定了植物组织中的Ni浓度。为获得足够的ICP分析材料,将用于染色的叶片与其最邻近的叶片合并分析。对于茎样品,将茎分为四段分别分析。由于根样品质量较小,对整个根系进行分析。样品在40 ◦C下干燥24 h,然后使用消解仪(DigiPREP MS, SCP-Science)在150 ◦C下用15 ml HNO3消解40 min。新鲜琼脂样品采用与植物样品相同的方法消解。由于未能找到Ni浓度相当的植物标准参考物质,我们采用标准加入法进行质量控制,使被分析溶液中的最终Ni浓度为1 mg l−1(Ni标准溶液,MERCK)。
2.6. Statistical analysis of the data2.6. 数据统计分析
For pairwise comparisons of the agar standards, the Wilcoxon rank sum test was used. To analyse the differences in concentration between different plant parts (leaves, stems and roots) and between the different plant tissues, we used one-way ANOVA, followed by pairwise t-test (p-value adjustment method: holm). The significance level was set at p ≤ 0.05. All statistical tests were performed using the software package “R”, version 2.1 (R Development Core Team, 2008).
琼脂标准品之间的两两比较采用Wilcoxon秩和检验。为分析不同植物部位(叶、茎和根)之间以及不同植物组织之间的浓度差异,采用单因素ANOVA,随后进行两两t检验(p值校正方法:holm)。显著性水平设为p ≤ 0.05。所有统计检验均使用软件包“R” 2.1版完成(R Development Core Team, 2008)。
3Results结果
3.1. Solvent choice3.1. 溶剂选择
2.5.2. Comparison of DMG-staining with ICP-OES analysis2.5.2. DMG染色与ICP-OES分析的比较
To compare the concentrations determined by ICP-OES with those obtained by DMG-staining, the ICP-measured concentrations were expressed as fresh-weight related concentrations (mg Ni kg−1). Ratios of dry weight/fresh weight were determined separately for leaf, stem and root samples in four replicates each. Fresh weight concentrations were calculated by multiplying the dry weight concentrations with the respective dry weight/fresh weight quotient.
为比较ICP-OES测得的浓度与DMG染色所得浓度,将ICP测得的浓度换算为以鲜重计的浓度(mg Ni kg−1)。分别测定叶、茎和根样品的干重/鲜重比,各设四个重复。鲜重浓度由干重浓度乘以相应的干重/鲜重比计算得出。
The Ni concentrations obtained by DMG staining related to part of a cross-section only, as it was not possible in general to accurately analyse the entire cross-sectional area for staining intensity. Thus, the values determined by ICP-OES and DMG staining do not exactly relate to the same areas of the cross-sections. For the leaves, we restricted the comparison for this reason to the mid ribs. For roots,
DMG染色所得的Ni浓度仅对应横切片的一部分,因为一般无法准确分析整个横切面积的染色强度。因此,ICP-OES和DMG染色测得的数值并非严格对应横切片的相同区域。出于这一原因,对于叶片,我们将比较限定于中脉。对于根,
The overall distribution patterns of Ni in the tissues of B. coddii, obtained with the five DMG-solutions (Table 1) were similar. However, the image quality differed considerably between solvents. The solution that contained only ethanol evaporated rapidly, and imaging became impossible after 5 min. Moreover, long Ni–DMG crystals formed. The ammonium acetate/ethanol mixture produced a weaker colour than the other solutions, probably because of the lower solution pH. We found no differences between the KOH, the borax/NaOH and the borax/KOH solutions. With all three solutions, we observed development of small crystals 5–10 min after adding the solvents. We chose the borax/KOH solution for all subsequent DMG staining, because (a) the staining produced images of high quality under the light microscope, (b) the pH was optimal for Ni complexation, and (c) plant tissues are generally more tolerant to K than to Na.
采用五种DMG溶液(表1)获得的B. coddii组织中Ni的总体分布格局相似。然而,不同溶剂所得的图像质量差异显著。仅含乙醇的溶液挥发迅速,5 min后便无法成像;此外还形成了较长的Ni–DMG晶体。乙酸铵/乙醇混合液的显色弱于其他溶液,可能是由于其溶液pH较低。KOH、硼砂/NaOH和硼砂/KOH溶液之间未见差异。对于这三种溶液,均在加入溶剂5–10 min后观察到细小晶体的生成。我们选择硼砂/KOH溶液用于后续所有DMG染色,原因在于:(a)染色后在光学显微镜下可获得高质量图像;(b)其pH最有利于Ni络合;(c)植物组织对K的耐受性普遍高于Na。
![Fig. 2. Ni-agar-standard calibration curve [log–log scale]. The X-axis shows the Ni concentrations of the agar medium and the Y-axis shows the intensity of the DMG staining after image-processing and background subtracti](90/figure-02.jpg)
3.2. Qualitative image analysis3.2. 定性图像分析
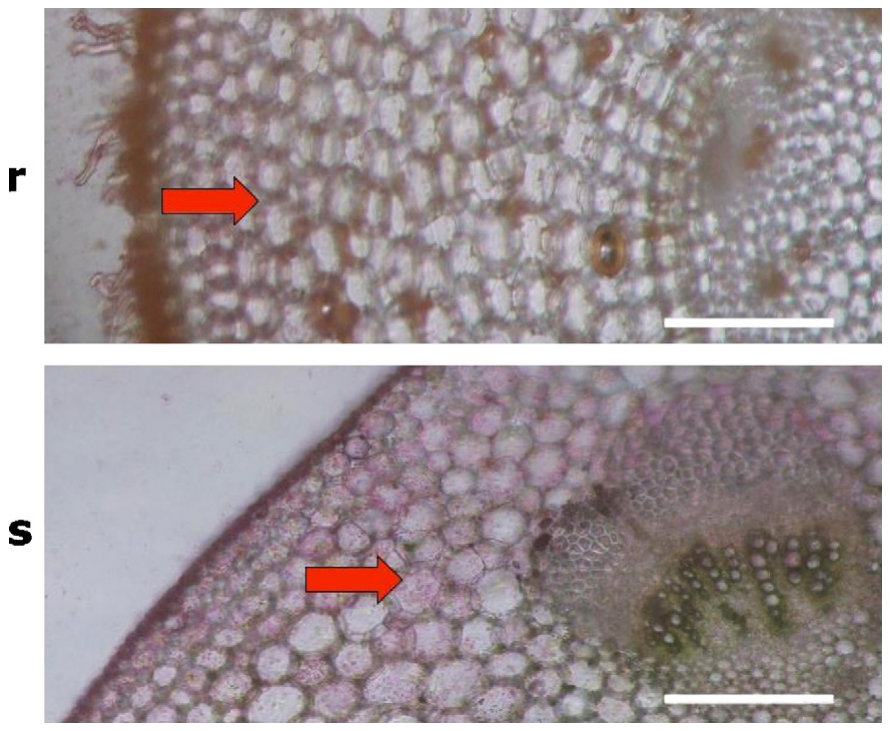
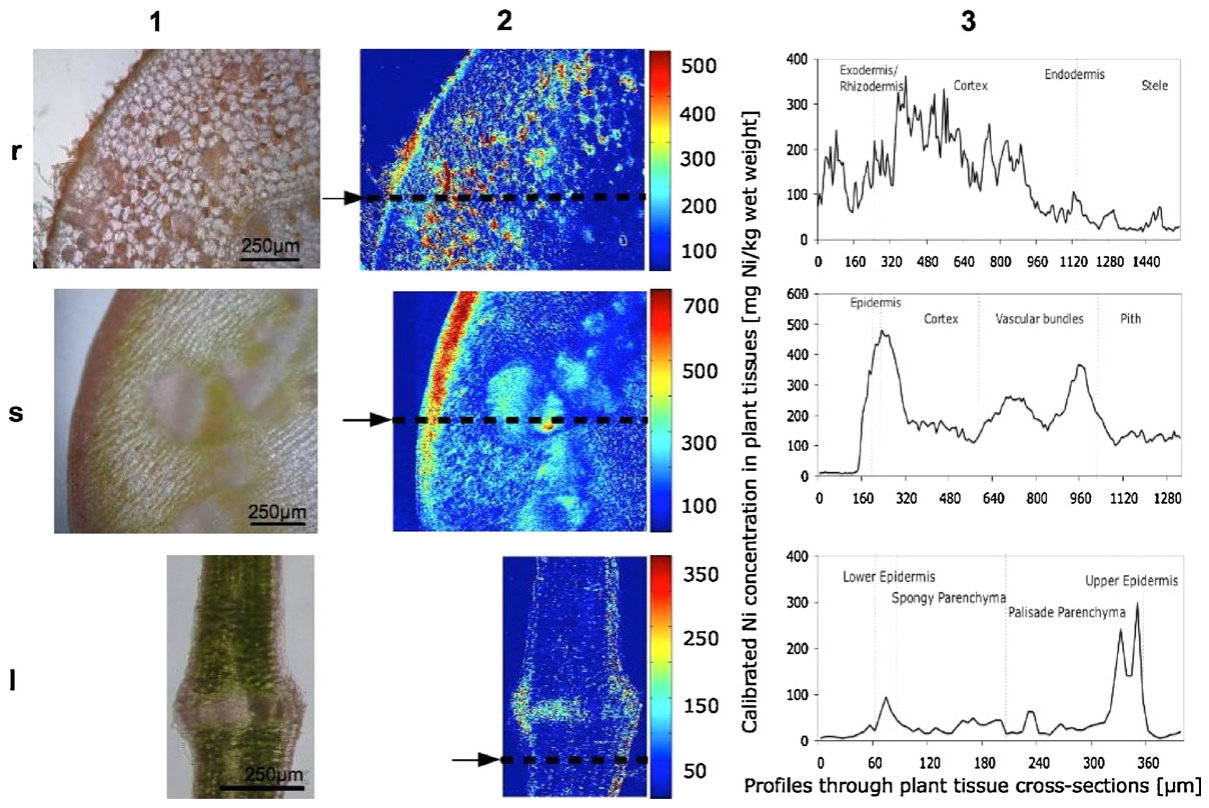
At all Ni concentrations applied, intensive DMG staining was detected in the epidermal cells of leaves and stems (data not shown). Elevated staining intensities were also found in the vascular bundles (xylem and phloem) of many samples. In the roots, staining intensity decreased in the cortex from the exodermis towards the stele. The DMG-staining revealed that Ni was present in both the apoplast and the symplast of various root tissues. In the root cortex, we detected the highest staining intensities in the apoplast, whereas in the stems and leaves most of the DMG stain was found within cells (Fig. 1).
在所有施加的Ni浓度下,叶和茎的表皮细胞中均检测到强烈的DMG染色(数据未列出)。许多样品的维管束(木质部和韧皮部)中也发现染色强度升高。在根中,皮层的染色强度自外皮层向中柱方向递减。DMG染色显示,Ni同时存在于多种根组织的质外体和共质体中。在根皮层中,质外体的染色强度最高,而在茎和叶中,大部分DMG染色位于细胞内(图1)。
3.3. Calibration3.3. 校准
The calibration curve obtained with the agar standards (Fig. 2) followed the power function c = 2.554 ∗ I1.662 (3)
由琼脂标准品获得的校准曲线(图2)符合幂函数c = 2.554 ∗ I1.662(3)
where c is Ni concentration and I is colour intensity.
式中,c为Ni浓度,I为颜色强度。
The intensity of the DMG-staining was less homogeneous in the agar samples with higher Ni concentrations (>200 mg l−1) than in those with lower Ni concentrations. This resulted in larger standard errors at higher concentrations. The intensity of the agar standard with the lowest non-zero Ni concentration (25 mg l−1) was not significantly different from that of blank agar samples. The next Ni concentration level (50 mg l−1), however, differed significantly from the control (p < 0.01). This indicates that the detection limit was between 25 and 50 mg Ni l−1. Comparing samples of plants grown in soil with elevated Ni concentrations with those from control soil (background concentration) revealed clear differences in staining intensity (Fig. 3). The differences were visible in all image processing steps: from the raw RGB-images (a1 and b1), through the transformed images (a2 and b2) to the final Niconcentration maps (a3 and b3). Even though the leaves of B. coddii grown in control soil (soil concentration of 18.6 ± 4.3 mg Ni kg−1) only accumulated 10.7 ± 2.5 mg Ni kg−1 dry weight, a faint staining was still visible (b2 and b3). This means that the Ni was probably not distributed homogeneously, but accumulated in some parts of the leaves, particularly in the epidermis, at concentrations above the detection limit. Moreover, the colour of the tissue may have interfered slightly with the colour of the Ni–DMG complexes. Light reflection caused by air bubbles occasionally produced colour artefacts that interfered with the colour intensity resulting from Ni–DMG complexation (Fig. 3b3). Image processing worked well for roots, stems and leaf midrib cross-sections. In the leaf blades, the high chlorophyll content of the mesophyll slightly impaired Ni–DMG detection. Fig. 4 gives examples for the patterns of Ni distribution found in the root, stem and leaf samples of the plants grown on soil with 500 mg Ni kg−1.
Ni浓度较高(>200 mg l−1)的琼脂样品中DMG染色强度的均匀性低于Ni浓度较低的样品,导致高浓度下的标准误较大。Ni浓度最低的非零琼脂标准品(25 mg l−1)的强度与空白琼脂样品无显著差异;而下一浓度水平(50 mg l−1)则与对照存在显著差异(p < 0.01)。这表明检出限介于25与50 mg Ni l−1之间。将生长于Ni浓度升高土壤中的植物样品与对照土壤(背景浓度)中的植物样品进行比较,发现染色强度存在明显差异(图3)。这些差异在所有图像处理步骤中均可见:从原始RGB图像(a1和b1),到变换后的图像(a2和b2),直至最终的Ni浓度分布图(a3和b3)。尽管生长于对照土壤(土壤浓度为18.6 ± 4.3 mg Ni kg−1)中的B. coddii叶片仅积累了10.7 ± 2.5 mg Ni kg−1干重,但仍可见微弱的染色(b2和b3)。这意味着Ni可能并非均匀分布,而是在叶片的某些部位(尤其是表皮)以高于检出限的浓度积累。此外,组织本身的颜色可能对Ni–DMG络合物的颜色产生轻微干扰。气泡引起的光反射偶尔会产生颜色假象,干扰由Ni–DMG络合产生的颜色强度(图3b3)。图像处理对根、茎和叶中脉横切片效果良好。在叶片中,叶肉的高叶绿素含量对Ni–DMG检测略有影响。图4给出了生长于含500 mg Ni kg−1土壤中植株的根、茎和叶样品中Ni分布格局的实例。
3.4. Quantitative analysis of Ni distribution patterns3.4. Ni分布格局的定量分析
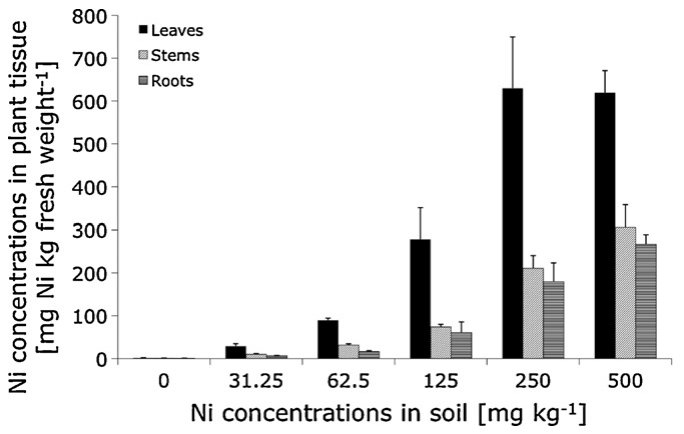
For comparison with the calibrated Ni-DMG concentrations, fresh weight related Ni concentrations were also determined by multiplying the ICP-OES measurements with the respective dryweight-to-fresh-weight ratios for leaves, stems, and roots. The average values of these ratios from five exemplary samples were 0.16 ± 0, 0.18 ± 0.03, and 0.18 ± 0.01 for leaves, stems, and roots, respectively. At all soil Ni concentrations, there was a significantly higher (p < 0.05) Ni concentration in the leaves than in the stems and roots (Fig. 5). We found the highest concentrations in the lower leaves and upper stems (data not shown), in agreement with Robinson et al. (2003).
为与校准后的Ni-DMG浓度进行比较,还将ICP-OES测定值乘以叶、茎和根各自的干重/鲜重比,得到以鲜重计的Ni浓度。由五个代表性样品得出的叶、茎和根的该比值平均分别为0.16 ± 0、0.18 ± 0.03和0.18 ± 0.01。在所有土壤Ni浓度下,叶片中的Ni浓度均显著高于茎和根(p < 0.05)(图5)。我们发现下部叶片和上部茎中的浓度最高(数据未列出),与Robinson et al.(2003)的结果一致。
![Fig. 3. Image processing steps from the raw RGB-images (a1, b1) to the transformed images (a2, b2) showing intensities and the calibrated concentration maps (a3, b3 [colour bars show mg Ni kg−1 fresh weight]). The sample](90/figure-03.jpg)
Tables 2 and 3 show that the Ni concentrations determined by DMG-staining were systematically lower than the values obtained from the ICP-OES analysis of the respective plant parts. The same trend was found for cross-sections of the middle stem (data not shown). Even though variability among images was high, and considering that the images did not cover entire cross-sections, there was a large discrepancy in the Ni concentrations obtained with the two methods. Per unit cross-sectioned area, we detected between 15 and 30% of the Ni detected with the ICP-OES measurement.
表2和表3表明,DMG染色测得的Ni浓度系统性地低于相应植物部位ICP-OES分析所得数值。茎中部横切片也呈现相同趋势(数据未列出)。尽管图像之间的变异性较大,且考虑到图像并未覆盖整个横切面,两种方法所得的Ni浓度之间仍存在较大差异。以单位横切面积计,我们检测到的Ni为ICP-OES测定值的15%至30%。
Ni concentrations increased with soil Ni concentrations in the epidermis of roots and stems (Table 2). The concentrations of Ni were significantly higher in epidermal and exodermal tissues of shoots and roots after exposure to 250 mg kg−1 than to 62 mg kg−1 soil Ni (p < 0.01). The Ni concentrations of the other tissues were below the detection limit in most samples. In the stems, Ni concentrations were in all samples higher in the epidermis than in the cortex and the pith. The vascular bundles occasionally showed higher Ni accumulation than cortex and pith.
根和茎表皮中的Ni浓度随土壤Ni浓度的升高而增加(表2)。暴露于250 mg kg−1土壤Ni后,地上部和根的表皮及外皮层组织中的Ni浓度显著高于暴露于62 mg kg−1土壤Ni时(p < 0.01)。在大多数样品中,其他组织的Ni浓度低于检出限。在茎中,所有样品表皮中的Ni浓度均高于皮层和髓。维管束偶尔表现出高于皮层和髓的Ni积累。
For leaves, we only analysed leaf midrib tissues of plants exposed to 250 mg Ni kg−1 soil (Table 3). Here, the DMG–Ni concentrations of the upper epidermis ranged from 329 ± 40 in the top leaves to 400 ± 29 mg Ni kg DW−1 in the bottom leaves and from 195 ± 14 to 407 ± 28 mg Ni kg DW−1 (top leaves–bottom leaves) for the lower epidermis. This is consistent with our ICP-OES measurements that showed the lowest concentrations in the top leaves and the highest concentrations in the bottom leaves (Table 3). The values obtained for the inner collenchymas and the vascular bundles were in all samples significantly lower than for the upper epidermis (p < 0.05). In the top leaves, the lower epidermis showed significantly lower concentrations than the upper epidermis (p < 0.05).
对于叶片,我们仅分析了暴露于250 mg Ni kg−1土壤中植株的叶中脉组织(表3)。其中,上表皮的DMG–Ni浓度范围为顶部叶片的329 ± 40至底部叶片的400 ± 29 mg Ni kg DW−1,下表皮为195 ± 14至407 ± 28 mg Ni kg DW−1(顶部叶片–底部叶片)。这与我们的ICP-OES测定结果一致,即顶部叶片浓度最低、底部叶片浓度最高(表3)。在所有样品中,内部厚角组织和维管束的测定值均显著低于上表皮(p < 0.05)。在顶部叶片中,下表皮的浓度显著低于上表皮(p < 0.05)。
4Discussion讨论
Using DMG to determine Ni distribution patterns in roots, stems and leaves of B. coddii gave reproducible results. These patterns were similar to those reported by other authors investigating Ni distribution in B. coddii using other methods (Budka et al., 2005; Mesjasz-Przybylowicz et al., 2001; Moradi et al., 2010; Robinson et al., 2003). As in our study, Budka et al. (2005) found the highest concentrations of Ni in the epidermis and vascular bundles of B. coddii. These authors analysed freeze substituted samples using tetrahydrofuran, which may have limited detection to Ni bound to histidine and organic acids such as citrate and malate. The high concentrations we found in midrib epidermis (Table 3) agree with the results of Mesjasz-Przybylowicz et al. (2001).
利用DMG测定B. coddii根、茎和叶中的Ni分布格局可获得可重复的结果。这些格局与其他研究者采用其他方法研究B. coddii中Ni分布所报道的结果相似(Budka et al., 2005; Mesjasz-Przybylowicz et al., 2001; Moradi et al., 2010; Robinson et al., 2003)。与本研究一致,Budka et al.(2005)发现B. coddii表皮和维管束中的Ni浓度最高。这些研究者使用四氢呋喃分析冷冻置换样品,这可能使检测仅限于与组氨酸及柠檬酸、苹果酸等有机酸结合的Ni。我们在中脉表皮中发现的高浓度(表3)与Mesjasz-Przybylowicz et al.(2001)的结果一致。
Ni concentrations measured with ICP-OES (ICP) compared to calibrated Ni concentrations in the plant tissues of roots and stems using DMG-staining and image processing (DMG). Values give averages and standard errors () of n replicates in mg Ni kg−1 fresh plant tissue.
ICP-OES测定的Ni浓度(ICP)与采用DMG染色和图像处理得到的根、茎植物组织校准Ni浓度(DMG)的比较。数值为n个重复的平均值及标准误(),单位为mg Ni kg−1新鲜植物组织。
| Ni concentratioNi浓 | n in soil [mg kg−1]度(土壤)[mg kg−1] | |||||
|---|---|---|---|---|---|---|
| 0 n= 3 | 62.5 n= 3 | 125 n= 3 | 250 n= 3 | 500 n= 2 | ||
| ICP | Stem (top) | 1.3 (0.1) | 42.6 (1.6) | 101.7 (10.2) | 292.9 (39.0) | 350.7 (44.5) |
| DMG | Stem tissues (top) | |||||
| Epidermis | <50 | 35.0 (12.2) | 103.3 (51.5) | 254.6 (25.9) | 302.8 (87.2) | |
| Cortex | <50 | <50 | <50 | <50 | 89.8 (37.3) | |
| Vascular bundles | <50 | <50 | <50 | 62.5 (42.9) | 144.3 (36.4) | |
| Pith | <50 | <50 | <50 | <50 | 142.3 (27.7) | |
| ICP | Whole root | 0.9 (0.1) | 16.4 (1.9) | 60.5 (25.0) | 179.4 (43.9) | 266.8 (22.1) |
| DMG | Root tissues | |||||
| Exodermis | <50 | 45.5 (4.3) | 68.7 (6.3) | 84.3 (5.6) | 318.0 (30.0) | |
| Outer cortex | <50 | <50 | <50 | <50 | 233.6 (120.8) | |
| Inner cortex | <50 | <50 | <50 | <50 | 169.0 (133.0) | |
| Endodermis | <50 | <50 | <50 | <50 | 129.7 (101.9) | |
| Stele | <50 | <50 | <50 | <50 | 75.1 (75.1) |
Using laser ablation to investigate the distribution of Ni in the roots of B. coddii, Moradi et al. (2010) found the lowest root Ni concentrations in the stele, as we found here. In contrast to the DMG method used in our study, the spatial resolution of the laser ablation method was insufficient to distinguish between exodermis and cortex. Similar Ni distribution patterns were also found in the roots of other Ni hyperaccumulators. Mesjasz-Przybylowicz et al. (2007) found that the concentrations of Ni decreased from the outer cortex towards the inner cortex also in the roots of another Ni hyperaccumulator plant (Senecio coronatus Harv). Bhatia et al. (2004) found higher Ni concentrations in the vascular bundles than in the cortex and pith in Stackhousia tryonii F.M. Bailey. High Ni-concentrations in epidermal tissues was reported for Alyssum bertolonii Desv. by Marmiroli et al. (2004) and for Stackhousia tryonii F.M. Bailey by Bhatia et al. (2004). For other plant species, different Ni distribution patterns were observed. Berazain et al. (2007) found the highest Ni concentrations in the cortex of the stems of six species of the Euphorbiaceae family. Differences in reported Ni distribution patterns between different plants, however, may also be due to differences in the methods, plant cultivation or the age of the analysed tissues (Smart et al., 2007). Berazain et al. (2007) used EDXA, which may respond differently to less soluble Ni fractions than DMG.
Moradi et al.(2010)利用激光剥蚀研究了B. coddii根中Ni的分布,与本研究结果一致,发现中柱中的根Ni浓度最低。与本研究所用的DMG方法不同,激光剥蚀方法的空间分辨率不足以区分外皮层与皮层。在其他Ni超富集植物的根中也发现了类似的Ni分布格局。Mesjasz-Przybylowicz et al.(2007)发现,在另一种Ni超富集植物(Senecio coronatus Harv)的根中,Ni浓度同样自外皮层向内皮层方向递减。Bhatia et al.(2004)发现Stackhousia tryonii F.M. Bailey维管束中的Ni浓度高于皮层和髓。Marmiroli et al.(2004)报道了Alyssum bertolonii Desv.表皮组织中的高Ni浓度,Bhatia et al.(2004)则报道了Stackhousia tryonii F.M. Bailey中的同样现象。对于其他植物物种,观察到了不同的Ni分布格局。Berazain et al.(2007)发现大戟科六个物种茎的皮层中Ni浓度最高。然而,不同植物间所报道的Ni分布格局差异,也可能源于方法、植物培养方式或所分析组织年龄的不同(Smart et al., 2007)。Berazain et al.(2007)采用的是EDXA,该方法对溶解度较低的Ni组分的响应可能与DMG不同。
The observation of Ni in the phloem of leaves and stems indicates that Ni in B. coddii is redistributed from older to younger leaves through phloem transport (Marschner, 1986; Page and Feller, 2005; Riesen and Feller, 2005). This would also explain the high Ni concentration Mesjasz-Przybylowicz et al. (2001) found in young B. coddii leaves.
在叶和茎的韧皮部中观察到Ni,表明B. coddii中的Ni通过韧皮部运输从老叶向幼叶重新分配(Marschner, 1986; Page and Feller, 2005; Riesen and Feller, 2005)。这也可以解释Mesjasz-Przybylowicz et al.(2001)在B. coddii幼叶中发现的高Ni浓度。
The variation in Ni concentrations in our images may be due to (1) natural physiological variability in Ni accumulation, (2) variation in cross-section thickness, and (3) variations in light conditions. Variations in thickness of the cross-sections could be substantially reduced by using an automatic microtome instead of a manual microtome. For a given type of tissue, the influence of thickness variations may be reduced to some degree by normalization with respect to chlorophyll content or another component provided it has a homogenous distribution. The effect of light variation can be corrected by subtracting background values. Keeping light conditions constant is a crucial point in the method. Interferences of air bubbles and chlorophyll with the DMG colour are other challenges in DMG staining. Air bubbles can form at any time and any part of the sample, and they are difficult to eliminate during sample preparation. Light reflection and scattering of air bubbles interfere with those of the Ni–DMG complexes. High chlorophyll contents may reduce DMG colour-contrasts in particular in leaf blade sections. The separation of DMG–Ni and chlorophyll signals may be further improved by a more sophisticated image analysis.
本研究图像中Ni浓度的变异可能源于:(1)Ni积累的自然生理变异;(2)横切片厚度的差异;(3)光照条件的变化。使用自动切片机代替手动切片机可大幅减小横切片厚度的差异。对于某一特定类型的组织,若叶绿素或其他组分分布均匀,可通过相对于其含量进行归一化,在一定程度上减小厚度差异的影响。光照变化的影响可通过扣除背景值加以校正。保持光照条件恒定是该方法的关键。气泡和叶绿素对DMG颜色的干扰是DMG染色面临的另外两项挑战。气泡可能在任何时间、样品的任何部位形成,且在样品制备过程中难以消除。气泡的光反射和散射会干扰Ni–DMG络合物的光反射和散射。高叶绿素含量可能降低DMG的颜色对比度,在叶片切片中尤为明显。通过更精细的图像分析,DMG–Ni与叶绿素信号的分离可得到进一步改善。
The DMG method systematically gave lower tissue Ni concentrations than HNO3 digestion and ICP-OES analysis. This indicates that DMG-stained Ni did not represent all tissue Ni, most likely because part of the Ni was not available to react with DMG. As the stability of Ni–DMG complexes is high with a log K of 14.6 (Furia,
与HNO3消解和ICP-OES分析相比,DMG方法测得的组织Ni浓度系统性偏低。这表明DMG染色的Ni并不代表全部组织Ni,最可能的原因是部分Ni无法与DMG反应。由于Ni–DMG络合物的稳定性很高,log K为14.6(Furia,
Table 3表3
Ni concentrations in leaves measured with ICP-OES (ICP) compared to calibrated Ni concentrations in leaf midrib tissues using DMG-staining and image processing (DMG). Values give averages and standard errors () of n replicates in mg Ni kg−1 fresh plant tissue.
ICP-OES测定的叶片Ni浓度(ICP)与采用DMG染色和图像处理得到的叶中脉组织校准Ni浓度(DMG)的比较。数值为n个重复的平均值及标准误(),单位为mg Ni kg−1新鲜植物组织。
| Ni concentration in soil [土壤中Ni浓度[ | mg kg−1]: 250 mg kg−1 | |||
|---|---|---|---|---|
| Bottom leaves n= 3 | Middle leaves n= 3 | Top leaves n= 3 | ||
| ICP | Whole leaves | 683.1 (150.2) | 667.6 (115.6) | 538.4 (97.9) |
| DMG | Leaf midrib tissues | |||
| Upper epidermis | 400.2 (28.3) | 318.8 (25.6) | 329.1 (39.5) | |
| Upper outer collenchyma | 333 (57.0) | 207.1 (40.8) | 207.5 (55.9) | |
| Upper inner collenchyma | 221.6 (31.2) | 52.4 (9.8) | 103.4 (6.3) | |
| Vascular bundles | 102.2 (34.1) | 73.8 (15.4) | 54.9 (6.1) | |
| Lower inner collenchyma | 161.9 (32.6) | <50 | 70.2(17.5) | |
| Lower outer collenchyma | 254.5 (17.6) | 157 (50.8) | 180.7 (4.3) | |
| Lower epidermis | 406.5 (28.1) | 245.8 (46.4) | 195(13.5) |
1972), it can be assumed that all Ni ions that are physically accessible by DMG in a plant tissue will be detected. The stability constant of Ni(DMG)2 for example is higher than that of Ni with histidine or that with citric acid (log K of 8.69 and 4.8, respectively), which are both important ligands for Ni in plant tissues (Krämer et al., 1996; Haydon and Cobbett, 2007). However, DMG may not be able to complex all Ni bound in walls, because the DMG solution may not penetrate suberin and wax containing structures (Smart et al., 2007). Another source of error for underestimation of Ni concentrations in the DMG method compared to ICP-OES analysis could be the use of agar as a medium representing plant tissue in the calibration procedure. It is likely that the speciation of Ni in agar is distinct from that in plant tissue.
1972),可以认为植物组织中所有在物理上可被DMG接触到的Ni离子都能被检测到。例如,Ni(DMG)2的稳定常数高于Ni与组氨酸或与柠檬酸所形成络合物的稳定常数(log K分别为8.69和4.8),而这两者均为植物组织中Ni的重要配体(Krämer et al., 1996; Haydon and Cobbett, 2007)。然而,DMG可能无法络合细胞壁中结合的全部Ni,因为DMG溶液可能无法渗透含木栓质和蜡质的结构(Smart et al., 2007)。与ICP-OES分析相比,DMG方法低估Ni浓度的另一误差来源,可能是在校准过程中使用琼脂作为代表植物组织的介质。琼脂中Ni的形态很可能与植物组织中的不同。
The DMG method developed here has particular potential to be used for comparative analyses of Ni distribution pattern in cross-sections, where factors such as the thickness of sections can be kept constant or do not play a great role. For example, the method can reveal whether Ni is stored in the apoplast or in the symplast (Fig. 1). Such observations can provide important information about uptake processes and underlying mechanisms. The finding that in the root cortex Ni was concentrated in the apoplast indicates that Ni is transported along the apoplastic pathway until reaching the endodermis (Marschner, 1986). The advantage of our DMG-staining method is that cross-sections can be imaged immediately after the addition of the DMG-solution. This means that there is little time available for redistribution of Ni or crystal formation, a problem of methods that involve soaking of cross-sections in DMG-solutions for several hours (Mizuno et al., 2003; Bhatia et al., 2004). The low costs of this method and its simplicity make it widely applicable.
本研究建立的DMG方法尤其适用于横切片中Ni分布格局的比较分析,在此类分析中切片厚度等因素可保持恒定或影响不大。例如,该方法可揭示Ni是储存于质外体还是共质体中(图1)。此类观察可为吸收过程及其内在机制提供重要信息。根皮层中Ni集中于质外体这一发现表明,Ni沿质外体途径运输,直至到达内皮层(Marschner, 1986)。本DMG染色方法的优点在于,加入DMG溶液后可立即对横切片成像。这意味着Ni重新分布或晶体形成的时间很短,而这正是需要将横切片在DMG溶液中浸泡数小时的方法所存在的问题(Mizuno et al., 2003; Bhatia et al., 2004)。该方法成本低、操作简便,具有广泛的适用性。
5Conclusions结论
Using a borax/KOH/DMG solution with a pH of 10, we obtained consistent and reproducible DMG-staining patterns of tissue sections of the Ni hyperaccumulator B. coddii, revealing how Ni that is accessible to the stain is distributed in this plant. To obtain optimal results it is necessary that sections be imaged immediately after staining. It appears that a substantial Ni fraction in the tissues is not accessible to the stain, possibly because it is unable to penetrate suberin and wax-containing structures such as cell walls. The observed distribution patterns were in good agreement with the findings of other authors using different methods. The DMG-staining method has the advantage that it gives a good spatial resolution, does not require expensive equipment, is easy to use, and is rapid in comparison to other methods.
采用pH为10的硼砂/KOH/DMG溶液,我们获得了Ni超富集植物B. coddii组织切片一致且可重复的DMG染色格局,揭示了可被染色剂接触的Ni在该植物中的分布情况。为获得最佳结果,切片必须在染色后立即成像。组织中相当一部分Ni似乎无法被染色剂接触,可能是因为染色剂无法渗透细胞壁等含木栓质和蜡质的结构。所观察到的分布格局与其他研究者采用不同方法所得的结果高度一致。与其他方法相比,DMG染色法具有空间分辨率好、无需昂贵设备、操作简便且快速的优点。
References参考文献
Andreˇı, O., Vollenweider, P., Günthardt-Goerg, M.S., 2006. Foliage response to heavy metal contamination in sycamore maple (Acer pseudoplatanus L.). Forest Snow Landscape Research 80 (3), 275–288.
Basso, A., Cavagnino, D., Pomponiu, V., Vernone, A., 2010. Blind watermarking of color images using Karhunen–Loève transform keying. The Computer Journal, doi:10.1093/comjnl/bxq052.
Berazain, R., de la Fuente, V., Rufo, L., Rodriguez, N., Amils, R., Diez-Garretas, B., Sanchez-Mata, D., Asensi, A., 2007. Nickel localization in tissues of different hyperaccumulator species of euphorbiaceae from ultramafic areas of Cuba. Plant Soil 293, 99–106.
Bhatia, N.P., Walsh, K.B., Orlic, I., Siegele, R., Ashwath, N., Baker, A.J., 2004. Studies on spatial distribution of nickel in leaves and stems of the metal hyperaccumulator Stackhousia tryonii using nuclear microprobe (micro-PIXE) and EDXS techniques. Functional Plant Biology 31, 1061–1074.
Bidwell, S.D., Crawford, S.A., Woodrow, I.E., Sommer-Knudsen, J., Marshall, A.T., 2004. Sub-cellular localization of Ni in the hyperaccumulator, Hybanthus floribundus (Lindley) F. Muell. Plant, Cell and Environment 27, 705–716.
Boominathan, R., Doran, P.M., 2003. Organic acid complexation, heavy metal distribution and the effect of ATPase inhibition in hairy roots of hyperaccumulator plant species. Journal of Biotechnology 101, 131–146.
Boyd, R.S., 1998. Hyperaccumulation as a plant defensive strategy. In: Brooks, R.R. (Ed.), Plants that Hyperaccumulate Heavy Metals. CAB INTERNATIONAL, pp. 181–201. Brooks, R.R., 1977. Detection of nickeliferous rocks by analysis of herbarium species of indicator plants. Journal of Geochemical Exploration 7, 49–57.
Brooks, R.R., 1987. Serpentine and Its Vegetaion: A Multidisciplinary Approach. Dioscorrides, Portland, Oregan, USA. Brooks, R.R., 1998a. General introduction. In: Brooks, R.R. (Ed.), Plants that Hyperaccumulate Heavy Metals. CAB INTERNATIONAL, pp. 1–14.
Brooks, R.R., 1998b. Geobotany and hyperaccumulators. In: Brooks, R.R. (Ed.), Plants that Hyperaccumulate Heavy Metals. CAB INTERNATIONAL, pp. 55–94.
Budka, D., Mesjasz-Przybylowicz, J., Tylko, G., Pryzbylowicz, W.J., 2005. Freeze substitution methods for Ni localization and quantitative analysis in Berkheya coddii leaves. Nuclear Instruments and Methods in Physics Research B 231, 338–344.
Dakhel, A.A., Ali-Mohamed Ahmed, Y., Henari, F.Z., 2006. Structural and optical studies of evaporated bis-(dimethylglyoximato)nickel(ll) thin films. Optical Materials 28, 925–929. Furia, T.E., 1972. Sequestrants in foods. In: CRC Handbook of Food Additives, 2nd ed. CRC Press, Cleveland, OH (Chapter 6). Haydon, M.J., Cobbett, C.S., 2007. Transporters of ligands for essential metal ions in plants. New Phytologist 174, 499–506.
Heath, S.M., Southworth, D., D’Allura, J.A., 1997. Localization of nickel in epidermal subsidiary cells of leaves of Thlaspi montanum var. Siskiyouense (Brassicaceae) using energy-dispersive X-ray microanalysis. International Journal of Plant Sciences 158 (2), 184–188. Jain, A., 1989. Fundamentals of Digital Image Processing. Prentice Hall, ISBN 0- 13332578-4. Krämer, U., Cotter-Howells, J.D., Chanrock, J.M., Baker, A.J., 1996. Free histidine as a metal chelator in plants that accumulate nickel. Nature 379, 635–638.
Küpper, H., Lombi, E., Zhao, F.-J., Wieshammer, G., McGrath, S.P., 2001. Cellular compartmentation of nickel in the hyperaccumulators Alyssum lesbiacum, Alyssum bertolonii and Thlaspi goesingense. Journal of Experimental Botany 52 (365), 2291–2300.
L’Huillier, L., d’Auzac, J., Durand, M., Michaud-Ferriere, N., 1996. Nickel effects on two maize (Zea mays) cultivars: growth, structure Ni concentration and localization. Canadian Journal of Botany 74, 1547–1554.
Marmiroli, M., Gonelli, C., Maestri, E., Gabbrielli, R., Marmiroli, N., 2004. Localisation of nickel and mineral nutrients Ca, K, Fe, Mg by scanning electron microscopy microanalysis in tissues of the nickel-hyperaccumulator Alyssum bertolonii and the nonhyperaccumulator Alyssum montanum l. Plant Biosystems 138 (3), 231–243.
Marschner, H., 1986. Mineral Nutrition of Higher Plants, 2nd ed. Academic Press Limited. Mäser, P., Gierth, M., Schröder, J., 2002. Molecular mechanisms of potassium and sodium uptake in plants. Plant and Soil 247, 43–54.
McNear, D.H., Peltier, E., Everhart, J., Chaney, R.L., Sutton, S., Newville, M., Rivers, M., Sparks, D.L., 2005. Application of quantitative fluorescence and absorptionedge computed microtomography to image metal compartmentalization in Alyssum murale. Environmental Science Technology 39, 2210–2218.
Mesjasz-Przybylowicz, J., Barnabas, A., Pryzbylowicz, W.J., 2007. Comparisons of cytology and distribution of nickel in roots of Ni-hyperaccumulating and nonhyperaccumulating genotypes of Senecio coronatus. Plant Soil 293, 61–78.
Mesjasz-Przybylowicz, J., Pryzbylowicz, W.J., Pineda, C.A., 2001. Nuclear microprobe studies of elemental distribution in apical leaves of the Ni hyperaccumulator Berkheya coddii. South African Journal of Science 97, 591–593.
Migliorini, M., Pigino, G., Bernini, F., Leonzio, C., 2004. The effects of heavy metal contamination on the soil arthropod community of a shooting range. Environmental Pollution 129, 331–340.
Mizuno, N., Nosako, S., Mizuno, T., Horie, K., Obata, H., 2003. Distribution of Ni and Zn in the leaves of Thlaspi japonicum growing on ultramafic soil. Soil Science and Plant Nutrition 49 (1), 93–97.
Moradi, A.B., Swoboda, S., Prohaska, T., Robinson, B.H., Kästner, A., Oswald, S., Wenzel, W.W., Schulin, R., 2010. Mapping of nickel in root cross-sections of the hyperaccumulator plant Berkheya coddii using laser ablation ICP-MS. Environmental and Experimental Botany 69, 24–31.
Ortega, R., 2005. Chemical elements distribution in cells. Nuclear Instruments and Methods in Physics Research B 231, 218–223.
Ozturk, L., Yazici, M.A., Yucel, C., Torun, A., Cekic, C., Bagci, A., Ozkan, H., Braun, H.-J., Sayers, Z., Cakmak, I., 2006. Concentration and localization of zinc during seed development and germination in wheat. Physiologia Plantarum 128, 144–152.
Page, V., Feller, U., 2005. Selective transport of zinc, manganese, nickel, cobalt and cadmium in the root system and transfer to the leaves in young wheat plants. Annals of Botany 96, 425–434.
R Development Core Team (2008). R: A Language and Environment for Statistical Computing. R Foundation for Statistical Computing, Vienna, Austria. ISBN: 3- 900051-07-0, URL http://www.R-project.org.
Richau, K.H., Kozhevnikova, A.D., Seregin, I.V., Vooijs, R., Koevoets, P.L.M., Smith, J.A.C., Ivanov, V.B., Schat, H., 2009. Chelation by histidine inhibits the vacuolar sequestration of nickel in roots of the hyperaccumulator Thlaspi caerulescens. New Phytologist 183, 106–116.
Riesen, O., Feller, U., 2005. Redistribution of nickel, cobalt, manganese, zinc and cadmium via the phloem in young and maturing wheat. Journal of Plant Nutrition 28 (3), 421–430.
Robinson, B.H., Brooks, R.R., Howes, A.W., Kirkman, J.H., Gregg, P.E.H., 1997. The potential of the high-biomass nickel hyperaccumulator Berkheya coddii for
A. Gramlich et al. / Environmental and Experimental Botany 71 (2011) 232–240 phytoremediation and phytomining. Journal of Geochemical Exploration 60, 115–126.
Robinson, B.H., Lombi, E., Zhao, F.J., McGrath, S.P., 2003. Uptake and distribution of nickel and other metals in the hyperaccumulator Berkheya coddii. New Phytologist 158, 279–285.
Rodriguez-Navarro, A., Rubio, F., 2006. High-affinity potassium and sodium transport systems in plants. Journal of Experimental Botany 57 (5), 1149–1160.
Sagner, S., Kneer, R., Wanner, G., Cosson, J.-P., Dues-Neumann, B., Zenk, M.H., 1998. Hyperaccumulation, complexation and distribution of nickel in Sebertia acuminata. Phytochemistry 47 (3), 339–347.
Seregin, I.V., Kozhevnikova, A.D., Kazyumina, E.M., Ivanov, V.B., 2003. Nickel toxicity and distribution in maize roots. Russian Journal of Plant Physiology 50 (5), 793–800.
Smart, K.E., Kilburn, M.R., Salter, C.J., Smith, J.A.C., Grovenor, C.R.M., 2007. NanoSIMS and EPMA analysis of nickel localisation in leaves of the hyperaccumulator plant Alyssum lesbiacum. International Journal of Mass Spectroscopy 260, 107–114.
Tung, G., Temple, P.J., 1996. Histochemical detection of lead in plant tissues. Environmental Toxicology and Chemistry 15 (6), 906–914.