Phyto-DSS Glossary
Irrigation / Component application / Ploughing
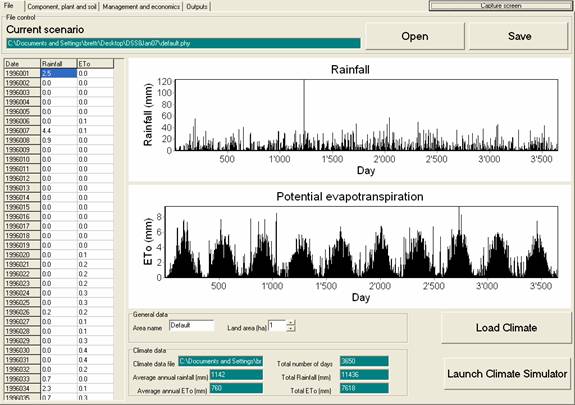
This shows the current .phy file that is loaded. This text file contains the soil, plants, components, and economic data. [top] [index]
This opens an existing file and Save to write the current scenario to disk. It is a good idea to save the scenario of each simulation where you Save results to spreadsheet [top] [index]
This contains the name of the site. It is not used in the simulation. [top] [index]
This is only used for calculating the economics when the economics are calculated on a per hectare basis. [top] [index]
stores tab delimited daily climate data in a .prn format. Climate data should be saved in this way using Excel with the format (year)*1000+Day of Year <TAB> Rainfall <TAB> ETo. The columns should have no header row. Both Rainfall and ETo should be in mm. To import the climate file, click Load Climate. Alternatively, a climate (.prn) file can be created using the climate simulator. [top] [index]

Component
The name of the component to be investigated. Can be any string e.g. Zn or zinc. Used when denoting a daughter product and when showing the results. [top] [index]
Total (mg/kg)
The total concentration (mg/kg) of component in the most contaminated part of the soil profile. [top] [index]
Effluent conc. (mg/L)
The concentration of the component in any effluent that may be applied, as described in the Management and economics / contaminant application section. This number is only used if the Regime box is set to periodically. [top] [index]
Half life (d)
The half life of the component in days. Used to calculate the degradation of organic components or radionuclides. [top] [index]
Daughter product
The name of the component, as designated in the Component field, that forms when this component decays. If the string in this field does not match the string in any of the other Component fields, then it automatically becomes None. [top] [index]
Background (mg/kg)
The total concentration (mg/kg) of metal in the uncontaminated part of the soil profile. [top] [index]
Residual (mg/kg)
The concentration (mg/kg) of the component that can never be brought into soil solution, for example if the component is bound into the silicate matrix. [top] [index]
Soluble (mg/L)
The concentration of component in soil solution, or as determined by an extraction such as 0.1 M NaNO3, from the most contaminated region in the soil profile. [top] [index]
Soluble+amendment (mg/L)
The initial concentration of component in soil solution, or as determined by an extraction such as 0.1 M NaNO3, from the most contaminated region in the soil profile when a soil amendment is added. Note that this can be higher or lower than the value given in the Soluble field. This value is only used if theSoil amendment applied box is checked. [top] [index]
Complex half life (d)
The half life of the complex formed when a soil amendment is added. This value is only used if the Soil amendment applied box is checked. [top] [index]
Plant min. (mg/kg)
The minimum concentration in the plant before a deficiency occurs. Below this value, there is a linear decrease in biomass production. For non-essential elements this value should be zero. This value is only used if the Allow toxicity or deficiency box is checked. [top] [index]
Plant max. (mg/kg)
The maximum concentration the plant shoots can have before the biomass production is zero. [top] [index]
Biomass threshold (mg/kg)
The plant shoot concentration, above which biomass is negatively affected. Biomass decreases linearly until the value in the Plant max. (mg/kg) field is reached, whereupon it is zero. [top] [index]
R.A.F.
The Root Absorption Factor. Root xylem / soil solution concentration quotient. [top] [index]
Decay constant (K)
RAF decreases as the Soluble Component in the soil increases. K describes the rate of this decrease. The value must be 0<K<1. [top] [index]
Leaf/stemQuo
The leaf / stem component concentration quotient. Many components have a higher concentration in the leaves than in the stems. [top] [index]
Initial conc. in plant (mg/kg)
The initial component concentration in the planted biomass. This may be important when simulating essential nutrients such as phosphorous, where a zero concentration would result in a significant yield reduction. [top] [index]
Value (US$)
The current value of the pure component. [top] [index]
Notes
Not used in the simulation. [top] [index]
Solubility
Choose between a linear or Langmuir isotherm. This isotherm is calculated from the initial soluble component / total component quotient in the component Table. [top] [index]
Number of components
Adds or removes components from the component table. Up to ten components can be simulated. [top] [index]
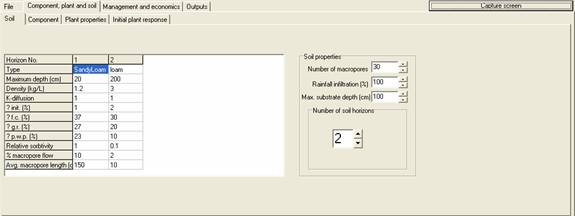
Type
A label that is not used in the simulation. [top] [index]
Maximum depth (cm)
The depth down to which the soil horizon extends. It must be greater than the previous soil horizon. So if horizons 1-4 have depths of 20,30,50 and 125 cm, then the Horizon 1 occurs from 0-20 cm, Horizon 2 from 20-30 cm, Horizon 3 from 30-50 and Horizon 4 from 50-125cm. Ensure that the maximum depth of the deepest horizon exceeds the number in the Max. substrate depth (cm) box, under Soil Properties. [top] [index]
Density (kg/L)
The density of the soil. This affects the total component burden, which is calculated from the concentration. Large differences in density can result in discontinuities in the soil profile. [top] [index]
K-diffusion
Determines the amount of diffusion (0<K<1), which for water is a maximum of 2 cm/d (K=1), and for solutes is a function of their solubility. When K is set to 0 there is no diffusion in the simulation. [top] [index]
θ init. (%)
The initial moisture content of the soil. [top] [index]
θ f.c. (%)
The moisture content at field capacity. Often corresponds to -0.1 Barr. [top] [index]
θ g.r. (%)
The moisture content at the point where transpiration is affected. Often corresponds to -1 Barr. [top] [index]
θ p.w.p (%)
The moisture content at permanent wilting point. Often corresponds to -10 Barr. [top] [index]
Relative sorbtivity
The relative sorption of the components compared to what has been described in the Component table. A value of 1 indicates no difference, 2 twice as much component is absorbed, and 0.5 half as much is absorbed. [top] [index]
% Macropore flow
The percentage of soil solution flux that passes through macropores. [top] [index]
Avg. macropore length (cm)
The average length of the macropores through which macropore flow occurs. The average macropore length has a standard deviation that is 50% of its value. The lengths of individual macropores are random numbers within these bounds. [top] [index]
Number of macropores
The number of macropores used in the simulation. This number does not affect the amount or extent of macropore flow, but reduces the variation in the result caused by the random nature of the macropore length. For simulations longer than 1 year, without the addition of a chelant, this number need not be greater than 1. Setting high values requires more computation time. [top] [index]
Rainfall infiltration (%)
The percentage of rainfall that infiltrates the soil. If this number is not 100% then the remainder is considered to have either runoff or re-evaporated from the soil surface. The Phyto-DSS does not calculate erosion. [top] [index]
Max substrate depth (cm)
The length of the soil profile used in the simulation. Water and components that leave the bottom of this profile are considered to have drained and leached. This number should be less than the maximum depth of the deepest soil horizon entered in the horizons table. [top] [index]
Number of soil horizons
The number of horizons used in the simulation. Be careful when decreasing this number to ensure that the deepest soil horizon is greater than the maximum substrate depth. [top] [index]
Component

Component profile
The distribution of all the components in the soil. Surface describes a superficial layer, At depth describes a layer beneath the surface. Uniform (component) produces a homogeneous soil profile with a concentration of Total in the component table. Uniform (background only) produces a homogeneous soil profile with a concentration of Background in the component table. [top] [index]
Maximum 0%
The maximum depth of soil where no elevated component concentrations are found. This may occur for example when a contaminated soil is capped. This value is only used if At depth is checked in the component profile box. [top] [index]
Minimum 100%
The minimum depth of soil where the component is present at the elevated concentrations described in the Component table. This may occur for example when a contaminated soil is capped. This value is only used if At depth is checked in the component profile box. [top] [index]
Maximum 100%
The maximum depth of soil where the component is present at the elevated concentrations described in the component table. This value is used if either Surface or At depth is checked in the component profile box. [top] [index]
Minimum 0%
The minimum depth of soil where no elevated component concentrations are found. This value is used if either Surface or At depth is checked in the component profile box. [top] [index]
Soil amendment applied
When Soil amendment applied is checked then the Phyto-DSS calculates the solubility, as affected by the amendment that is applied on the date given in "Year of addition" and "Day". The graphic gives the nominal case of solubility following the addition of the amendment. [top] [index]
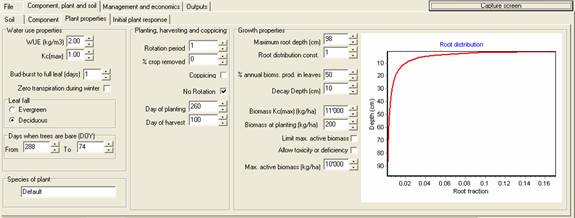
WUE (kg/m3)
The water use efficiency of the crop. [top] [index]
Kc(max)
The crop coefficient of the crop at maturity. For pasturte, this value is 1, by definition. [top] [index]
Bud-burst to full leaf (days)
Used only for deciduous trees. The length of time from the day of year (given in Days when trees are bare) until the leaves are fully developed. [top] [index]
Zero transpiration during winter
Used only for evergreen trees. When the box is checked, then no evapotranspiration occurrs between the dates given in Days when trees are bare. [top] [index]
Leaf fall
For deciduous perennial crops click "Deciduous". For all other crops, including annuals, click "Evergreen". [top] [index]
Days when trees are bare (DOY)
The winter days of year (DOY) when desiduous trees have no leaves and, if the Zero transpiration during winter box is checked, then evergreen trees to no transpire. In the Southern Hemisphere From < To and in the Northern Hemisphere To < From. [top] [index]
Species of plant
Not used in the simulation. [top] [index]
Rotation period
The number of years between harvests. This value is only used if the No rotation box is unchecked. [top] [index]
% crop removed
The percentage of the crop that is removed during the harvest. For example, if alternate rows of trees are removed then % crop removed would be 50. [top] [index]
Coppicing
If this box is checked, then only the aerial parts of the plants are removed in the harvest. The plants regrow from the root-stock the following year. [top] [index]
No rotation
If this box is checked, then the plants are never harvested. [top] [index]
Day of planting
The day of year (DOY) when the crop is planted, either initially or following a harvest. [top] [index]
Day of harvest
The day of year (DOY) when the plants are harvested. Harvests occur every Rotation period years. If No rotation is checked, then the plants are never harvested. [top] [index]
Maximum root depth (cm)
The maximum depth at which plant roots are found. Depends on species, soil type and water availability. [top] [index]
Root distribution const.
A dimensionless unit that controls the decrease in root distribution between the surface and the Maximum root depth. [top] [index]
% annual bioms. prod. in leaves
The leaf production as a percentage of the total annual biomass production. [top] [index]
Decay depth (cm)
The depth to which metal is added to the soil either from leaf fall or from trees dying. Metal is added in decreasing amounts at increasing depths. [top] [index]
Biomass Kc(max) (kg/ha)
The above ground biomass required before the crop coefficient (Kc) is at a maximum. [top] [index]
Biomass at planting (kg/ha)
The initial biomass of the crop. This may be the seeds, seedlings, cuttings or stake. This value is critical in determining the crop development because the early stages of growth are exponential, since photosynthesis is proportional to leaf area and hence biomass. [top] [index]
Max. active biomass (kg/ha)
The maximum biomass that affects plant growth, water use and photosynthesis. This value is used so that when there is a partial harvest of a high biomass crop, for example harvesting every second row ot trees, the growth and transpiration of the crop are limited in the following year. If this value is not used, and the crop biomass >> Biomass Kc(max), then a partial harvest will not affect growth or transpiration. Max. active biomass (kg/ha) is only used if Limit max annual biomass is checked. [top] [index]
Limit max annual biomass
When this is checked, then the active biomass is limited to the value specified in Max. active biomass (kg/ha). [top] [index]
Allow toxicity or deficiency
When this is checked, then plant growth may be affected if the plant component concentration falls outside the values given in Plant min (mg/kg), Plant max (mg/kg), and Biomass threshold (mg/kg). [top] [index]
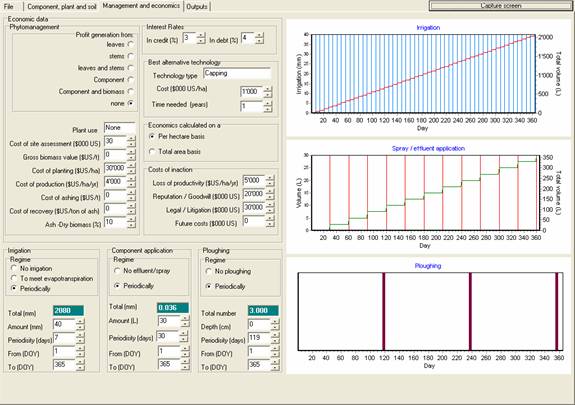
Profit generation from
This should detail any part of the plant that is sold or generates money. [top] [index]
Plant use
A string that is only a note and not used in the simulation. [top] [index]
Cost of site assessment
This should includes all scientific, business and other fixed costs when conducting a site assessment with regard to phytomanagement. [top] [index]
Gross biomass value
This is the amount that the plant part detailed in the profit generation from box can be sold for. [top] [index]
Cost of planting ($US/ha)
The total cost of site preparation and planting for each crop rotation (if applicable). [top] [index]
Cost of production ($US/ha)
This includes the cost of any irrigation, fertilisers or pesticides that may be used, as well as the cost of the harvest. [top] [index]
Cost of ashing (US$/ha)
The cost of incinerating the crop. Note that if incineration produces bioenergy, then this will be calculated under Gross biomass value ($US/ha). If the crop is not incinerated, or there is no cost of incineration, then the Cost of ashing ($US/ha) should be zero. [top] [index]
Cost of recovery ($US/ton of ash)
This value is only used for phytomining operations. It is the cost of recovering the target metal (s) per ton of ash. [top] [index]
Ash-Dry biomass (%)
The weight of ash that is generated as a percentage of the dry biomass. Used only in phytomining operations to calculate the Cost of recovery ($US/ton). [top] [index]
In credit (%)
The % interest gained on capital that may be generated from biofuell, timber or phytomining. [top] [index]
In debt (%)
The interest payable on debts that may be accrued through the costs of phytoremediation, the best alternative technology, or inaction. [top] [index]
This contains the economic data for best alternative technology to phytomanagement, such as capping, soil removal, or soil washing. The Best alternative technology is not required to run a phytomanagement simulation, but can provide a useful reference point in terms of cost. [top] [index]
Technology type
A string that is not used in the simulation. [top] [index]
Cost ($000 US/ha)
The cost of the best alternative technology, in thousands of $US per hectare. [top] [index]
Time needed (years)
The time required for the Best alternative technology to be implemented. [top] [index]
Economics calculated on a
Choose whether you would like the economics to be calculated for the whole area, or as a cost / profit per hectare. [top] [index]
Loss of productivity ($US/ha/yr)
The financial loss from being unable to use the land for production. [top] [index]
Reputation / Goodwill ($000 US)
The cost of the loss of an organisation's reputation due to the failure to remediate a contaminated site. [top] [index]
Legal / Litigation
The legal costs of inaction on a contaminated site, including any court costs and fines. [top] [index]
Future costs
If a no action occurs on a contaminated site and the contaminants eventually become mobile, then this will have financial implications. [top] [index]
Irrigation / Component application / Ploughing
Regime(irrigation)
Crops may either be un-irrigated, irrigated according to their needs, ie to maximise biomass production, or periodically irrigated with a predetermined volume. If "To meet evapotranspiration" is checked, then the crop never suffers from water stress, and the irrigation does not produce any drainage. [top] [index]
Amount (mm) and Amount (L)
The volume of water or effluent/spray that is applied at each irrigation event. Only used if "periodically" is checked. [top] [index]
Depth (cm) (ploughing)
The depth to which the contaminant becomes homogenised. Note that ploughing only affects the contaminant and not the other soil properties. It is best to set the ploughing depth to less than the depth of the first horizon in the soil profile. [top] [index]
Periodicity (days)
The number of days between irrigation / Component application / Ploughing events. If periodicity = 1, then the crop is irrigated every day. Only used if "periodically" is checked. [top] [index]
From (DOY)
The Day Of Year when the Irrigation / Component application / Ploughing begins. [top] [index]
To (DOY)
The Day Of Year when the Irrigation / Component application / Ploughing ends. [top] [index]
% annual bioms. prod. in leaves
% crop removed
% Macropore flow
Allow toxicity or deficiency
Amount (mm) and Amount (L)
Area name
Ash-Dry biomass (%)
Avg. macropore length (cm)
Background (mg/kg)
Biomass at planting (kg/ha)
Biomass Kc(max) (kg/ha)
Biomass threshold (mg/kg)
Bud-burst to full leaf (days)
Climate data file
Complex half life (d)
Component
Component profile
Coppicing
Cost ($000 US/ha)
Cost of ashing (US$/ha)
Cost of planting ($US/ha)
Cost of production ($US/ha)
Cost of recovery ($US/ton of ash)
Cost of site assessment
Current scenario
Daughter product
Day of harvest
Day of planting
Days when trees are bare (DOY)
Decay constant (K)
Decay depth (cm)
Density (kg/L)
Depth (cm) (ploughing)
Economics calculated on a
Effluent conc. (mg/L)
From (DOY)
Future costs
Gross biomass value
Half life (d)
In credit (%)
In debt (%)
Initial conc. in plant (mg/kg)
Kc(max)
K-diffusion
Land area
Leaf fall
Leaf/stemQuo
Legal / Litigation
Limit max annual biomass
Loss of productivity ($US/ha/yr)
Max substrate depth (cm)
Max. active biomass (kg/ha)
Maximum 0%
Maximum 100%
Maximum depth (cm)
Maximum root depth (cm)
Minimum 0%
Minimum 100%
No rotation
Notes
Number of components
Number of macropores
Number of soil horizons
Open
Periodicity (days)
Plant max. (mg/kg)
Plant min. (mg/kg)
Plant use
Profit generation from
R.A.F.
Rainfall infiltration (%)
Regime (irrigation)
Relative sorbtivity
Reputation / Goodwill ($000 US)
Residual (mg/kg)
Root distribution const.
Rotation period
Soil amendment applied
Solubility
Soluble (mg/L)
Soluble+amendment (mg/L)
Species of plant
Technology type
Time needed (years)
To (DOY)
Total (mg/kg)
Type
Value (US$)
WUE (kg/m3)
Zero transpiration during winter
θ f.c. (%)
θ g.r. (%)
θ init. (%)
θ p.w.p (%)